Bilkent University at TRECVID 2007
S. Aksoy, P. Duygulu,C. Aksoy, E. Aydın, D. G¨unaydın, K. Hadımlı, L. Ko¸c, Y. Olgun, C. Orhan, G. Yakın
RETINA Vision and Learning Group Department of Computer Engineering
Bilkent University
Bilkent, 06800, Ankara, Turkey
Abstract
We describe our fourth participation, that includes two high-level feature extraction runs, and one manual search run, to the TRECVID video retrieval evaluation. All of these runs have used a system trained on the common development collection. Only visual information, consisting of color, texture and edge-based low-level features, was used.
1
Introduction
This is the fourth participation of the RETINA Vision and Learning Group at Bilkent University to TRECVID. The team that participated to TRECVID included eight undergraduate students supervised by two faculty members. We have developed a system for automatic classification and indexing of video archives as part of undergraduate research projects. This paper sum-marizes the approaches we have taken in two high-level feature extraction runs, and one manual search run we have submitted this year.
2
Preprocessing
In all of the runs, we have used the shot boundaries, keyframes, and manual annotations provided with the TRECVID 2007 data.
We model spatial content of images using grids and partition the 352 × 240 video frames into 5 rows and 7 columns. Then, low-level features based
on color, texture and edge are computed individually on each grid cell and also on the entire image. The features used are the histograms and statistics (mean and standard deviation) of RGB, HSV and LUV values of the corre-sponding pixels as the color features and the statistics of the Gabor wavelet responses of the pixels at 3 different scales and 4 different orientations as the texture features. Histograms of the gradient orientation values of the Canny edge detector outputs are used as the edge features. Orientation values are divided into bins with increments of 45 degrees and an extra bin is used to store the number of non-edge pixels. Individual components of each fea-ture vector are normalized to unit variance to approximately equalize ranges of the features and make them have approximately the same effect in the computation of similarity.
3
High-Level Feature Extraction
We have developed two methods for high level feature extraction. The first one (Bilkent1) is a generic classifier that uses the low-level features described with the k-nearest neighbor rule. First, we performed experiments using different feature combinations and different k values on the development data. We have empirically decided to use tiled HSV histograms and Canny-based edge orientation histogram features. The k value was also chosen as 51. The examples provided with the common annotation were used to train the classifier for all high-level features.
The second type of detectors developed by Bilkent University (Bilkent2) exploit both color and spatial information using a bag-of-regions represen-tation [1]. The shot classification problem has two critical components: resenting shots and learning models for semantic categories using these rep-resentations. Shot representation is achieved by segmenting keyframes into regions and forming a region codebook that is used to construct histograms of individual regions and region pairs. Learning process is implemented by training Bayesian classifiers using these representations.
The first step is the partitioning of keyframes into regions. After ex-perimenting with several segmentation algorithms, we decided to use the k-means with connectivity constraint algorithm [2]. After an image is seg-mented into several regions, each region is modeled using the multivariate histogram of the HSV values of its pixels with 8 bins used for the H channel and 3 bins for each of S and V channels, resulting in a 72-dimensional feature vector. Then, a codebook of region types is constructed using the k-means algorithm for vector quantization. The number of codewords (k) was set to
1000 empirically. The output of this step is a discrete type label assigned to each region.
Color information can be very useful in discriminating objects/regions in an image if they have very distinct colors. However, just like any other low-level features, color cannot distinguish conceptually different objects/regions if they fall to nearby locations in the feature space. An important element of image understanding is the spatial information. For example, finding a region with dominant blue color (that may be water) and a neighboring beige region (that may be sand) with another blue region (that may be sky) above them can increase the possibility of being a coast image for that image. Furthermore, two images with similar regions can have very different interpretations if the regions have different spatial arrangements. Hence, spatial information can be used to resolve ambiguities in image classification. Different methods have been proposed to model region spatial relation-ships. However, it becomes a combinatorial problem if one tries to model all possible relationships between regions in an image. Therefore, we decided to use only the vertical relationship of “above-below” because it arguably provides a better characterization of the content. For example, flipping a photograph horizontally does not usually alter its semantics but flipping it vertically or rotating it greatly perturb its perception. To determine the vertical relative position of two regions, we use their projections on both axes. If there is an overlap between the projections on the x-axis, their pro-jections on the y-axis are compared. If they have no overlap on the y-axis or if the overlap is less than 50 percent of the area of the smaller region, we conclude that the one with a greater centroid ordinate is above the other one. If these overlap criteria are not met, it is concluded that no significant vertical relative arrangement exists between these two regions. The result of this step is a list of region pairs that satisfy the “above-below” relationship for each image.
After each region is assigned a type label and the pairwise spatial re-lationships are computed, each image is represented as a “bag-of-regions”. We consider two settings for this bag-of-regions representation: 1) each re-gion is regarded separately and a “bag of individual rere-gions” representation is generated, and 2) regions that satisfy the above-below relationship are grouped together and a “bag of region pairs” representation is constructed. Finally, these two representations are used separately to train Bayesian clas-sifiers. Given the positive examples for each semantic concept (high-level feature), using multinomial density models, the probability values needed by the Bayesian decision rule are computed using the maximum likelihood estimates.
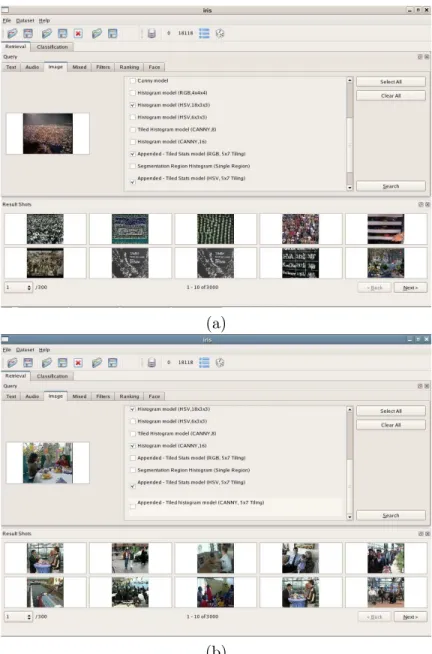
(a)
(b)
Figure 1: Manual search results using low-level color and edge-based fea-tures, and number of faces (a) for a query on finding people in crowd (topic 214), and (b) for a query on finding three or more people at a table (topic 209).
4
Search
The manual run used only low-level visual features that were also used in the high-level feature extraction task. The number of faces in the shots were also used as an additional information. The shots were sorted according to their distance to the query shot using these features. Example queries are shown in Figure 1.
5
Conclusions
Our participation to TRECVID consisted of two high-level feature extrac-tion runs, and one manual search run this year. We are currently working on extending our system with new low-level features, classifiers and novel methods for their multi-modal fusion.
References
[1] D. Gokalp and S. Aksoy. Scene classification using bag-of-regions rep-resentations. In Proceedings of IEEE Conference on Computer Vision and Pattern Recognition, Beyond Patches Workshop, Minneapolis, Min-nesota, June 23, 2007.
[2] I. Kompatsiaris and M. G. Strintzis. Spatiotemporal segmentation and tracking of objects for visualization of videoconference image se-quences. IEEE Transactions on Circuits and Systems for Video Tech-nology, 10(8):1388–1402, December 2000.