Shorttermeffectsofalow-carbohydratedietinoverweightandobesesubjectswithlowHDL-Clevels RESEARCHARTICLEOpenAccess
Tam metin
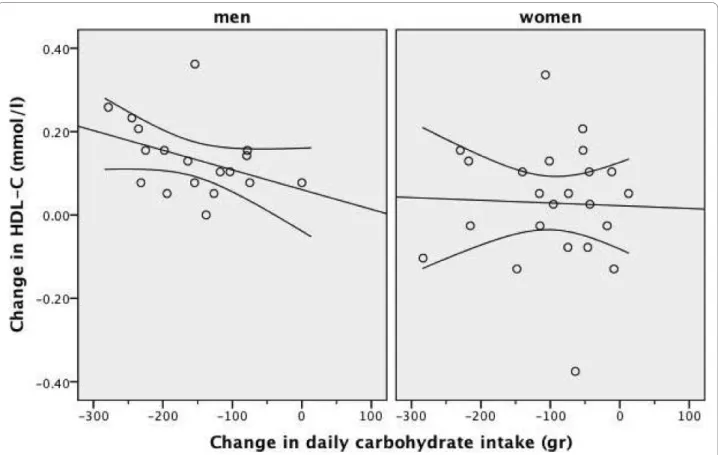
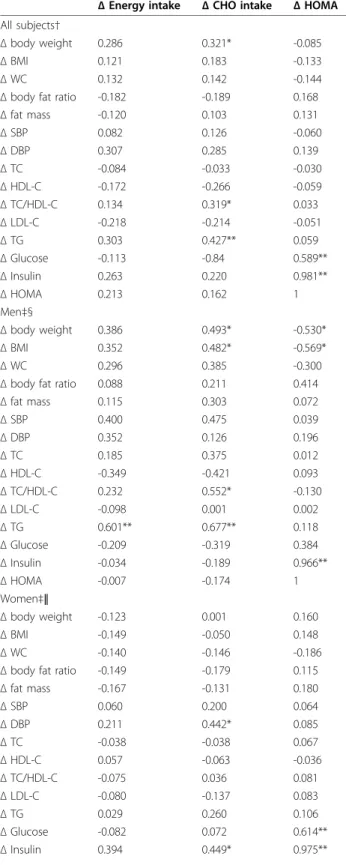
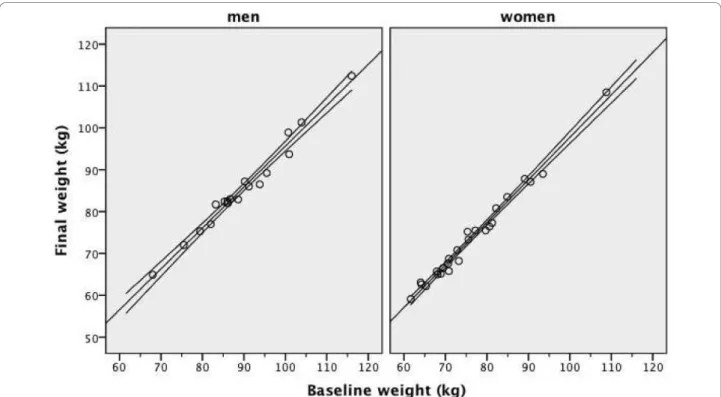
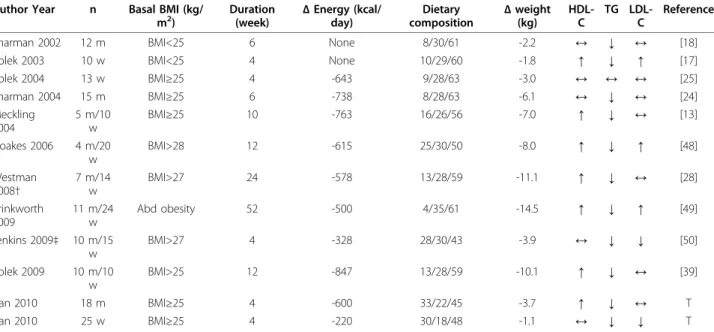
Şekil


Benzer Belgeler
The results of this study revealed that the rate of bleed- ing in patients receiving bridging treatment following the interruption of OAC administration was 16.6%, the use of LMWH
或是與土地相依的農夫,他們在堅持理 想的路途中,獲得了邁向未知世界的勇 氣。
For patients with an initial IOP above 50 mmHg, the difference in the grade of corneal edema measured 30 minutes after treatment was insigni ficant between the ACP and mannitol groups
Başlangıçta küçük bir büro olarak hizmet ve ren ülkemiz Interpol Milli Merkez Bürosu, dünyadaki genel gelişmeler, uluslararası suç ve suçluluğun artma sı sonucu,
Repeated measures of ANOVA were used to determine changes in body mass index (BMI) and C3 complement levels. The Generalized Estimating Equations procedure extends the
Keywords: Work overload, pay dissatisfaction, unethical behavior, organizational ethics, hotel industry Aşırı İş Yükü Etik Dışı Davranışları Nasıl Etkiler?.
But in the concept we proposing that will work on both the colour and black & white images and shadow image of the proposed scheme looks like as a single
Salama and Smarandache [12] presented the idea of a neutrosophic crisp set in a set X and defined the inclusion between two neutrosophic crisp sets,
