• Sonuç bulunamadı

Critical Exponents of Photoinitiated Gelation atDifferent Light Intensities

N/A
N/A
Protected

Academic year: 2021

Share "Critical Exponents of Photoinitiated Gelation atDifferent Light Intensities"

Copied!
11
0
0

Yükleniyor.... (view fulltext now)

Tam metin

(1)

Full Terms & Conditions of access and use can be found at

https://www.tandfonline.com/action/journalInformation?journalCode=lmsb20

Journal of Macromolecular Science, Part B

ISSN: 0022-2348 (Print) 1525-609X (Online) Journal homepage: https://www.tandfonline.com/loi/lmsb20

Critical Exponents of Photoinitiated Gelation at

Different Light Intensities

Z. Doğruyol , N. Arsu & Ö. Pekcan

To cite this article: Z. Doğruyol , N. Arsu & Ö. Pekcan (2009) Critical Exponents of Photoinitiated Gelation at Different Light Intensities, Journal of Macromolecular Science, Part B, 48:4, 745-754, DOI: 10.1080/00222340902959719

To link to this article: https://doi.org/10.1080/00222340902959719

Published online: 22 Jul 2009.

Submit your article to this journal

Article views: 79

View related articles

(2)

Journal of Macromolecular ScienceR, Part B: Physics, 48:745–754, 2009

Copyright©Taylor & Francis Group, LLC ISSN: 0022-2348 print / 1525-609X online DOI: 10.1080/00222340902959719

Critical Exponents of Photoinitiated Gelation

at Different Light Intensities

Z. DO ˘

GRUYOL,

1

N. ARSU,

2

AND ¨

O. PEKCAN

3

1Department of Physics, Yıldız Technical University, Davutpas¸a Campus, Istanbul, Turkey

2Department of Chemistry, Yıldız Technical University, Davutpas¸a Campus, Istanbul, Turkey

3Kadir Has University, Cibali, Istanbul, Turkey

A photo-differential scanning calorimetric (Photo-DSC) technique was used to study the photoinitiated radical polymerization of a 75% epoxy diacrylate (EA) and 25% tripropyleneglycoldiacrylate (TPGDA) mixture with 2-mercaptothioxanthone (TX-SH) as photoinitiator by using different light intensities. Photopolymerization reactions were carried out under identical conditions of temperature and initiator concentration. It was observed that all conversion curves during gelation at various UV light intensities present good sigmoidal behavior as predicted by the percolation model. Observations around the critical time, called the glass transition point (tg), taken for polymerization

to reach the maximum rate (Rpmax) show that the gel fraction exponents β obeyed the

universal percolation picture. On the other hand, Rpmax, tg, and final conversion values

were found to be dependent on the UV light intensity.

Keywords critical exponent, epoxy acrylate, light intensity, photo-DSC, photoinitiator

Introduction

It is well established that free-radical cross-linking copolymerization (FCC) produces a network called a gel. The whole course of the bulk FCC is divided into three stages: low conversion stage, gel effect stage, and glass effect stage.[1–3]It was observed that monomer conversion first increases very slowly, then accelerates because of the gel effect.[4]When the reaction temperature is lower than the glass transition point of the polymer, the glass effect stage occurs as the last stage of polymerization. The glass transition temperature of polymers is customarily defined as the temperature at which the relaxation time on the monomer scale reaches 100 s.[5]Radical chain polymerizations are often characterized by the presence of an autoacceleration in the polymerization rate as the reaction proceeds.[6]

Since the monomer and initiator concentrations decrease with time, usually one would expect the reaction rate to drop with the extent of conversion. However, exactly the opposite behavior has been observed in many polymerization processes (the reaction rate increases with conversion). This behavior during polymerization is referred to as the gel effect, also named the Trommsdorf effect or Norrish–Smith effect.[7]The gel effect corresponds to a

Received 13 November 2008; accepted 22 December 2008.

Address correspondence to N. Arsu, Department of Chemistry, Yıldız Technical University, Davutpas¸a Campus, 34210 Istanbul, Turkey. E-mail: narsu@yildiz.edu.tr

(3)

dramatic increase in the rate of a free-radical polymerization and of the viscosity of the reaction medium. It is caused by diffusion limitations in the reaction medium that slow down the termination but not the propagation reaction. Since free-radical polymerizations are highly exothermic, it induces a sudden increase of the temperature that can be detected by several experimental techniques. Norrish and Smith[7] postulated that the increased viscosity caused by monomers being converted to polymers resulted in a decrease in the mobility of the growing chains, making it more difficult for them to diffuse together and terminate. The term gel effect was used due to the characteristic rise in viscosity accompanying the dramatic increase in polymer conversion.[8]Burnett and Melville[8]and Schulz and Harborth[9]each independently performed polymerizations in the presence of solvent and both have reached the conclusion that the gel effect was caused by increasing bulk viscosity, as solvent reduces the viscosity and delays the onset of the gel effect.

Photoinitiated polymerization of multifunctional acrylates provides an easy and in-stant method for producing highly crosslinked networks. The excellent physical properties and low curing time of these crosslinked materials have led to a growing demand and widespread applications for these materials. Applications–such as curing of coatings on various materials, adhesives, printing inks, and photoresists—are well known in the field of interest.

Photopolymerizable formulations consist of three major components: a pre-polymer and monomer as a diluent and a photoinitiator. In addition to these components, addi-tives (e.g., pigments and co-initiators) are also often a part of these systems. The most expensive part of the formulations is a photoinitiator capable of absorbing light of the appropriate wavelength and producing primary radical species, which are able to initiate polymerization.[10,11]Photoinitiated radical polymerization may be initiated by bond cleav-age (Type I) and H-abstraction type (Type II) initiators.[12]Type II photoinitiators are based on compounds whose triplet excited states readily react with hydrogen donors, thereby producing initiating radicals (Figure 1).[13–15]Because of the bimolecular radical genera-tion process, they are generally slower than Type I photoinitiators, which form radicals unimolecularly.

Typical Type II photoinitiators include benzophenone and derivatives, thioxanthones, benzil, and quinones, while alcohols, ethers, amines, and thiols are used as hydrogen donors. Among Type II photoinitiators, thioxanthone (TX) derivatives in conjunction with tertiary amines are efficient photoinitiators with absorption characteristics that compare favorably with benzophenones.[16]We recently reported[17]the use of a thiol derivative of thioxanthone (TX-SH) as a photoinitiator for free-radical polymerization. A major advantage of this initiator is related to its one-component nature. It can serve as both triplet photosensitizer and a hydrogen donor. Thus, this photoinitiator does not require an additional co-initiator, i.e., a separate molecular hydrogen donor. The mechanism of the photoinitiation is based

(4)

Critical Exponents of Photoinitiated Gelation 747

Figure 2. Photoinitiated free-radical polymerization by using thioxanthone-thiol (TX-SH).

on the intermolecular reaction of the triplet3TX-SHwith the thiol moiety of ground state TX-SH. The resulting thiyl radical initiatesthe polymerization (Figure 2).

The main factors that affect the rate of initiation are light intensity, thickness of sample, absorption properties, and concentration of initiator being used, as well as the number of initiating species that are produced for each photon of light. The effect of light intensity and exposure time for photopolymerization has been studied by many researchers. UV light intensity is one of the most important factors that affect the reaction kinetics of the resin systems and properties of the formed gels.

In our previous study, photopolymerization of EA 75% and TPGDA 25% (P-3038) mix-ture were monitored by the Photo-DSC technique in the presence of various thioxanthone-based initiators.[18] As a continuing study of the photopolymerization kinetics of multi-functional acrylates, we report here photopolymerization of EA/TPGDA with TX-SH as an initiator by Photo-DSC technique at various UV light intensities. It was observed that all conversion curves during gelation had sigmoidal behavior as predicted by the percolation model from which the critical exponents, β, were calculated. The average value for the critical exponent β was found to obey the percolation model. However, the observed glass transition point, tg, maximum conversion rate, Rpmax, and final conversion values were found to be strongly correlated with the applied UV light intensity.

Theoretical Considerations

In the 20th century, various models were developed to understand gel formation in free-radical cross-linking copolymerization (FCC), among which the Flory–Stockmayer theory and percolation theory provide bases for modeling this geometric phase transition.[19–22] Statistical theories, which are called mean field or classical theories, originate from Flory[19] and Stockmayer,[20] and assume equal reactivities of functional groups and the absence of cyclization reactions. The percolation model provides a simple but highly detailed geometrical picture that helps one to understand gelation.[21,22]In this geometrical picture, one may think of monomers as occupying the vertices of a periodic lattice, and the chemical bonds as corresponding to the edges joining these vertices at any given moment, with a probability p. Then, the critical point for the gelation can be identified with the percolation threshold pc, where the newly formed infinite cluster starts to appear. Identifying the gel

(5)

fraction G with a probability of an occupied site to belong to the newly formed infinite cluster, one can predict the scaling behavior of these and related quantities near the gel point, as

G∝ (p − pc)β, pc< p(above percolation) (1) Here, β represents the critical exponent that is given in percolation theory as 0.43, differing from that found by Flory–Stockmayer, 1.0.

We interpreted our results by considering the quasi-static properties of the gel near the glass transition point in the language of percolation.[23]In this picture, the glassy region is defined as a region of sufficiently high viscosity, such that it inhibits the motion of small molecules in a short time frame. The pioneering works in the literature propose that the three-dimensional glass transition is controlled by the percolation of small domains of slow dynamics, which allows one to explain the heterogeneous dynamics close to the glass transition.[24,25]These authors.[24,25]have suggested that domains of slow dynamics perco-late at lower temperature in the quasi two-dimensional cases of thin suspended polymer films and they calculated the corresponding reduction in glass transition temperature, in quantitative agreement with the experimental results. In this study, the “occupation proba-bility” p of the sites in a three-dimensional lattice was taken as the volume fraction occupied by the total number of monomers incorporated into the glassy regions. On the microscopic scale, these glassy regions were assumed to be the initiation centers of the vitrification, which evolve during the polymerization, and percolate as pchas been reached.

Experimental

Materials

2-Mercaptothioxanthone[17]was synthesized according to the previously described proce-dure. Dimethylformamide (DMF, 99+%, Aldrich) was distilled over CaH2under reduced pressure. Epoxydiacrylate (EA) and tripropyleneglycoldiacrylate (TPGDA) were obtained from Cognis France.

Photo Differential Scanning Calorimetry (Photo-DSC)

The photoinitiated polymerization of EA/TPGDA in the presence of 0.5 wt% TX-SH was performed in a Photo-DSC setup (TA-DSCQ100). UV light was applied from a medium pressure mercury lamp with light intensities from 10 to 70 mW/cm2for 150 seconds. The mass of the EA/TPGDA samples was 2± 0.1 mg, which were placed into an open aluminum liquid DSC pan. The measurements were then carried out under identical conditions, i.e., an isothermal mode at room temperature (24.92◦C) under a nitrogen flow of 50 mL/min.

The reaction heat liberated in the polymerization is directly proportional to the number of acrylates reacted in the system. By integrating the area under the exothermic peak, the conversion of the acrylate groups (C) or the extent of the reaction was determined according to Equation (2):

C= Ht/H0theory (2)

where Ht is the reaction heat evolved at time t and H0theory is the theoretical heat for complete conversion. A reaction heat for an acrylate double bond polymerization of

(6)

Critical Exponents of Photoinitiated Gelation 749

Figure 3. Heat flow and rate of polymerization spectra of photopolymerization of EA/TPGDA with

various UV light intensities.

H0theory= 86 kJ/mol wasused.[26]The rate of polymerization (R

p) is directly related to the heat flow (dH/dt) by Equation (3):

Rp= (dC/dt)(dH/dt)/H0theory (3) Photoinitiated polymerization of EA/TPGDA in the presence of TX-SH as an initiator was monitored by Photo-DSC by using of various UV light intensities. Experiments were performed under identical conditions: temperature and initiator concentration. The heat generated by acrylate polymerization was recorded and is presented in Figure 3 together with the rate of polymerization. Conversion of monomer to polymer was calculated from heat flow values and is given in Figure 4.

Results and Discussion

Photoinitiated Gelation

Photo-DSC is a unique method to obtain a fast and accurate indication of the photoinitiator performance. Photo-DSC experiments are capable of providing kinetics data in which the measured heat flow can be converted directly to the ultimate percentage conversion and polymerization rate for a given amount of formulation, with the data obtained reflecting the overall curing reaction of the sample.

It is seen in Figures 3 and 4, that with increasing UV light intensity from 10 to 70 mW/cm2the extent of heat flow, rate of polymerization, and conversion increased up to 50 mW/cm2; however, further increase in light intensity adversely affected these values. One can obviously see the adverse effect on both maxima of the rate of polymerization and final conversion values given in Table 1.

Most probably, high light intensity provides greater efficiency for initiation, leading to more formed primary radicals on the surface of the solution. The excessive radicals formed

(7)

Figure 4. Conversion spectra of photopolymerization of EA/TPGDA with various UV light

intensi-ties.

on the surface of the film create a filter effect that limits the penetration of UV light into the samples, thereby Rpmaxand the final conversion values decrease at high light intensities.

Universality in Gelation

If the temperature, light intensity, and concentration are kept constant, then p will be directly proportional to the reaction time, t. This proportionality is not linear over the whole range of reaction time but it can be assumed that in the critical region, i.e., around the critical point,|p—pc| is linearly proportional to the |t—tc|.Therefore, below the critical point, i.e., for t < tcconversion measures the weight average degree of polymerization. Above tc,

Table 1

Experimentally observed parameters measured by “Photo-DSC” and calculated via “percolation theory” for various UV light intensity during diacrylate, EA/TGPDA

hotopolymerization

Ligth Int. Rpmax*10−3 Conv. at Final Conv. (mW/cm2) t g(s) (s−1) tg(%) (%) βvalue 10 3,7 20 5,0 40 0.53 20 3,2 26 5,4 44 0.53 30 2,4 36 5,9 44 0.50 40 2,3 37 6,0 47 0.52 50 1,4 69 6,6 52 0.51 60 1,6 65 6,7 49 0.49 70 2,9 40 7,5 48 0.49

(8)

Critical Exponents of Photoinitiated Gelation 751

however, conversion measures solely the gel fraction, G, the fraction of the monomers that belong to the macroscopic network.

The aim of this work was to measure the values of the critical exponent, β, with sufficient accuracy to determine its universality class to verify that it indeed has the non-classical values for percolation computed from series expansion and Monte Carlo studies as well as renormalization theory. Our results were interpreted by considering the quasi-static properties of the gel near the glass transition point in the language of percolation.[27]

The double logarithmic plot of the conversion vs.|t—tc| was analyzed, which produced the critical exponent, β, from the slope of the straight line during fitting the data in Fig-ure 4. Here the important problem was the precise determination of the glass transition point and the critical region. In particular, a small shift in tc results in a large shift in the critical exponent. Such a log–log plot reveals that data should be particularly accurate near the critical point. Usually the critical point can be determined by varying tcto obtain good scaling behavior over the greatest range in|t—tc|, if the experiments are performed against time. The time corresponding to the maximum of the rate of polymerization was chosen as the critical time, tc, which may be named as the glass transition point, tg, for the photoinitiated gelation under consideration. The plot of log (conversion) versus log |t—tg| above tgfor the gelation of EA/TPGDA with various UV light intensities are shown in Figure 5. The slopes of the straight lines produced for gel fraction exponent β at light intensities 10, 30, and 60 mW/cm2are presented in Figures 6(a), (b), and (c), respectively. The β values calculated for the gelation of EA/TPGDA at all light intensities are given in Table 1 together with tgand the conversion at tg. Here it has to be noted that the average value (= 0.51) of the calculated β values above tgstrongly suggest that the glassy regions percolate during photoinitiated gel formation.

It is interesting to note that tg values decrease as UV light intensity increases up to 50 mW/cm2, then increased with further increase of light intensity, following the opposite

Figure 5. Double logarithmic plot of the conversion versus time curves above tg for various UV

(9)

Figure 6. Double logarithmic plot of the conversion versus time curves above tgfor (a) 10 mW/cm2

(b) 30 mW/cm2and (c) 60 mW/cm2UV light intensities, respectively. The values of the β exponents

were determined from the slope of the straight lines.

behavior of Rpmaxand final conversion. One naturally may expect that higher light intensity should reduce the time required to achieve higher monomer conversion. On the other hand, the filter effect, which limits the penetration of UV light into the sample, now delays the glass formation process during photoinitiated gelation; as a result, tg values increase by increasing UV light intensity. Surprisingly, conversion at tgcontinuously increased as light intensity increased, indicating that filter effect had not become effective at tgduring the photopolymerization reaction.

As mentioned above, the sol-gel phase transition and/or gelation was first modeled by Flory and Stockmayer on a special lattice called the Bethe lattice on which the closed loops were ignored. An alternative to this model is the lattice percolation model where monomers are thought to occupy the sites of a periodic lattice. The predictions of these two theories about the critical exponents for the sol-gel phase transition are different from the point of the universality. For example, the exponents γ and β for the weight average degree of polymerization and the gel fraction in the Flory–Stockmayer theory (the so-called classical or mean-field theory) gives β= γ = 1, independent of the dimensionality, while the percolation studies based on computer simulations give γ and β around 1.7 and 0.43 in three dimensions, respectively. These two universality classes for gelation problem have been now well established; e.g., when the polymerization temperature is lower than the glass transition temperature, Tg(such as in PMMA and polystyrene) system obeys percolation picture (which is the case in our work). However, for the polymers with low Tg(such as in

(10)

Critical Exponents of Photoinitiated Gelation 753

PAAM and PNIPAM) and biopolymers (such as in carrageenans), the sol-gel transition is better described by the Flory–Stockmayer model.

Conclusions

This work has mainly shown that Photo-DSC technique can be used to measure the critical exponents, β, during gel formation of EA and TPGDA mixtures. It has to be emphasized that β values stayed constant during gelation for all samples irradiated at various light intensities. On the other hand, it was observed that the other gelation parameters—such as tg, Rpmax, and final conversion—presented considerable variations depending on the intensity of the irradiated light.

References

1. Qin, J.; Guo, W.; Zhang, Z. Modelling of the bulk free radical polymerization up to high conversion-three stages polymerization. Polymer. 2002, 43, 1163–1170.

2. Mahabadi, H.K.; O’Driscoll, K.F. Termination rate constant in free-radical polymerization. J. Polym. Chem. Ed. 1977, 15, 283–300.

3. Maxwell, I.A.; Russell, G.T. Diffusion controlled copolymerization kinetics. Macromol. Theory Simul. 1993, 2, 95–128.

4. Kaya, D.; Pekcan, ¨O. Studying of the critical exponents around the glass transition in bulk polymerization of ethyl methacrylate by using fluorescence techniques. Phase Transit. 2004,

4(77), 359–373.

5. Ediger, M.D.; Angell, C.A.; Nagel, S.R. Supercooled Liquids and Glasses. J. Phys. Chem. 1996,

100, 13200–13212.

6. North, A.M. Chapter 5. Reactivity, Mechanism and Structure in Polymer Chemistry. In Jenkins, A.D. and Ledwith, A., eds. The Influence of Chain Structure on the Free Radical Termination

Reaction; Wiley-Interscience: New York, 1974,

7. Norrish, R.G.W.; Smith, R.R. Catalysed polymerization of methyl methacrylate in the liquid phase. Nature. 1942, 150, 336–337.

8. Burnett, G.M.; Melville, H.W. Determination of the velocity coefficients for polymerization processes. III. Effect of environment on polymerization processes. Proc. R. Soc. London. 1947,

189, 494–507.

9. Schultz, G.V.; Harbort, G. ¨Uber den mechanismus des explosiven polymerisationsverlaufes des methacryls¨auremethylesters. Makromol. Chem. 1947, 1, 106–139.

10. Arsu, N.; Reetz, I.; Yagci, Y.; Mishra, K.M. Photoinitiated Radical Vinyl Polymerization. In Mishra, K.M.; Yagci, Y., eds. Handbook of Vinyl Polymers Second Edition. CRC Press: London, 2009, pp. 141–204.

11. Roffey, C.G. Photopolymerization of Surface Coatings, John Wiley & Sons Ltd.: New York, 1982, pp. 72–100.

12. Pappas, S.P. UV Curing Science and Technology; Technology Marketing Corp.: Norwalk, CT, 1978.

13. Fouassier, J.P. Photoinitiation, Photopolymerization and Photocuring; Hanser Publishers: Munich, 1995, p. 20.

14. Dietliker, K. Chemistry & Technology of UV & EB Formulation for Coatings, Inks & Paints; SITATechnology Ltd.: Vol. III. London, 1991.

15. Davidson, R.S. Exploring the Science, Technology and Applications of UV and EB Curing; SITA Technology Ltd.: London, 1999.

16. Davis, M.J.; Doherty, J.; Godfrey, P.N.; Gren, P.N.; Yung, J.R.A.; Parrish, M.A. UV-curing behavior of some photoinitiators and photoactivators. J. Oil Colour Chem. Assoc. 1978, 11, 256– 263.

(11)

17. C¸ okba˘glan, L.; Arsu, N.; Yagci, Y. et al. 2-Mercaptothioxanthone as a novel photoinitiator for free radical polymerization. Macromolecules. 2003, 36, 2649–2653.

18. Do˘gruyol, Z.; Karasu, F.; Balta, D.K.; Arsu, N.; Pekcan, ¨O. Universality in gelation of epoxy acrylate with various photoinitiators: a photo differential scanning calorimetric study. Phase Transit. 2008, 81, 935–947.

19. Flory, P.J. Molecular size distribution in three dimensional polymers. I. Gelation. J. Am. Chem. Soc. 1941, 63, 3083–3090.

20. Stockmayer, W.H. Theory of molecular size distribution and gel formation in branched-chain polymers. J. Chem. Phys. 1943, 11, 45–55.

21. De Gennes, P.G. Scaling Concepts in Polymer Physics; Cornell University Press: Ithaca, NY, 1988, p. 54.

22. Stauffer, D.; Aharony, A. Introduction to Percolation Theory; Taylor & Francis: London, 1992. 23. Yilmaz, Y.; Kaya, D.; Pekcan, ¨O. Can the glass transition in bulk polymers be modeled by

percolation picture? Eur. Phy. J. E. 2004, 15, 19–25.

24. Long, D.; Lequeux, F. Heterogeneous dynamics at the glass transition in Van Der Waals liquids, in the bulk and in thin films. Eur. Phys. J. E. 2001, 4, 371–387.

25. Berriot, J. et al. Gradient of glass transition temperature in filled elastomers. Europhys. Lett.

2003, 64, 50–56.

26. Andrejewska, E.; Andrzejewski, M. Polymerization kinetics of photocurable acrylic resins. J. Polym. Sci. Part A Polym. Chem. 1998, 36, 665–673.

27. Kaya, D.; Pekcan, ¨O.; Yilmaz, Y. Fast transient fluorescence technique to study critical exponents at the glass transition. Phase Transit. 2003, 76, 543–556.

Şekil

Figure 1. Photoinitiated free radical polymerization by using aromatic carbonyl compounds.
Figure 2. Photoinitiated free-radical polymerization by using thioxanthone-thiol (TX-SH).
Figure 3. Heat flow and rate of polymerization spectra of photopolymerization of EA/TPGDA with
Figure 4. Conversion spectra of photopolymerization of EA/TPGDA with various UV light intensi-
+3

Referanslar

Benzer Belgeler

Yöremizde, çeşitli gebelik dönemlerindeki kadınların tetanoza karşı bağışıklık düzeyinin araştırıldığı çalışma sonucunda 91 gebe kadının %53’ünün

Girit Ceziresi‟nin idare-i mülkiyyesi taraf-ı hümayunumuzdan mensub bir valiye tefviz olunup kılâ-i Ģahanemizin hikmet-i muhafazasıyla cezirede bulunan askerin

The obtained results showed that composite BiOCl/AgI catalyst was more active to degrade 3-CP than the pure BiOCl and AgI samples.. The amount of BiOCl was changed up to 50% in

It was also shown that if polymer systems which are initially of an isolator charac- ter are doped with carbon nanotubes of nano dimensions and when the amount of this addition

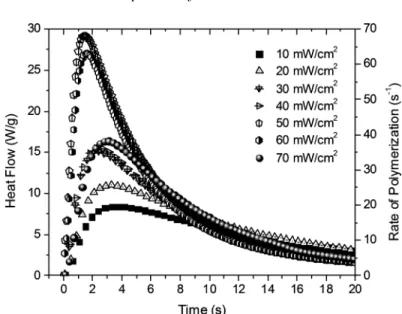
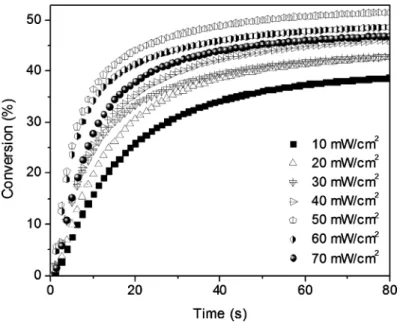
Rate of polymerization spectra of photopolymerization of EA/TPGDA with various photoinitiator (TX-SH) concentrations irradiated at 25 ◦ C by UV light with an intensity of 40 mW/cm

Ayrıca pompalama sırasında beton pompasının hidrolik basıncı ve hat içindeki betonun basıncı sürekli olarak ölçülerek kayıt altına alınmış, her bir aşamada

The results indicated that (1) the educational levels were signif icantly related to personality factor, (2) there was a significant relationship between adjustment and the

Conception and study design; realization of operations; analysis and/or data interpretation; statistical analysis; manuscript redaction or critical review of its content;