OXFORD BULLETIN OF ECONOMICS AND STATISTICS, 57, 4 (1995) ()3()5-9()49 S3.0()
AN INTEGRATED ANALYSIS OF TURKISH
INFLATION!
Kivilcim Metin
1. INTRODUCTION
Turkey, in its recent economic history, experienced three relatively high inflationary periods, namely, 1954-59, 1977-80 and 1984 onwards. Inflation has been a striking characteristic of the Turkish economy since 1977. It reached its zenith point with an annual rate of 100 percent in 1979/80. The introduction of mixed stabilization and liberalization policies in January 1980 resulted in a temporary recession, but helped to cut the annual inflation from three digits to 25 percent by the end of 1983. However, inflation rose to 40 percent from 1984 and settled down at the 50 percent level during the second half of the 198O's. The reason for inflation is well known: excessive growth of the money supply. It grew uncontrollably to cover the budgetary deficits of public bodies, namely State Economic Enterprises (SEEs), which relied on Central Bank Credit.
The principal aim of this paper is to examine the inflationary process in Turkey covering the period of 1950-88.' The approach is based on analysing the inflation rate in an open economy by distinguishing between (i) pure monetarist theories, (ii) internal theories (labour market theories and excess demand explanations) and (iii) external theories, including the role of imported inflation (see Surrey, 1989). Additionally, the effects of fiscal expansion can be considered as a factor of determining inflation as part of the adjustment process due to the public sector budget deficit. Inflation is also determined by excess demands,- which may originate in the monetary, government, goods, external and labour sectors of the economy. Theoretic-tThis paper is based on my D.Phil, thesis submitted to the University of Oxford. 1 am exu-emely grateful to David Hendry for his help and advice. Comments from John Muellbauer, Tim Jenkinson, Stephen Hall and Fourth Meeting of (EC)^ participants are appreciated. I also
gratefully acknowledge the helpful comments of Stephen Nickell, although all errors are my responsibility.
'See Fry (1980, 1986), Togan (1987), Onis and Ozmucur (1990) for work on inflation dynamics in Turkey.
-The idea is that the excess demand in each sector of the economy leads to inflation is certainly not new. The origin.s of this theory, a theory has not changed much in more than 200 years, is David H ume. See his Essavi: Moral. Poliliail and Literary (p. 318).
513
C Blackwell Publishers Ltd. 1995. Published by Blackwell Publishers, 108 Cowley Road, Oxford OX4 UF, UK & 238 Main Street, Cambridge, MA 02142, USA.
ally, the partial impacts of these excess demands in each sector will determine inflation. Empirically, however, it is not always easy to find good proxies to describe these excess demands. The concept of cointegration, which iden-tifies a stable long-run relationship among the variables of the related set, might provide a measure of the excess demand. The variables are in the form of deviations from long-run steady-state relations — known as Error Correc-tion Mechanisms (ECM) — which are derived from the sectoral relaCorrec-tionships of the economy since the concept of cointegration is isomorphic to error correction. Indeed, Engle and Granger (1987) showed the equivalence between a cointegration relation; defined as a stationary combination of nonstationary variables, and the ECM determined by a priori economic argument. Bearing in mind these definitions, excess demand in any market as measured by the deviation from the long-run equilibrium (ECM) is allowed potentially to affect inflation. Pursuing this economic structure, in the remainder of this paper Turkish inflation will be investigated empirically using multivariate cointegration analysis.^
The organization of the paper is as follows. Section II proposes an inflation model which approximates the Turkish economy. Individual sectoral analyses of Turkish inflation are examined in Section III. The results of the previous Section III are used to implement a disequilibrium analysis in Section IV. Section V concludes.
II. THE MODEL
In this section, we present a model in which the partial impacts of the monetary, government, external and labour sectors of the economy on the Turkish inflation are examined.
First, we will discover how inflation is generated by taking a slightly round-about route. The starting point for our model is the dematid for money function. Agents wish to hold nominal money (M) in proportion to their nominal income (Y) in a static equilibrium state. However, they hold less money as interest rates {R) and inflation (Ap) increase. So
M = KY{\+RY{\+ApY (1) where a, /3 < 0 and K are constant. The lower case letters denote logs of corresponding capitals and A denotes the first difference of the related variable. Therefore, in terms of Friedman's model, a stable demand for money function confronts an exogenously controlled supply with equilibrium achieved by adjustment in the price level. The key requirement is a money demand equation with nominal money being exogenous, and that claim can ^Recently, empirical research has been carried out concerning cointegration as suggested by Johansen (1988) (see Johansen and Juselius (1990, 1991), and Juselius (1991, 1992) for empirical applications.
AN INTEGRATED ANAL'VSIS OF TURKISH INFLATION 5 1 5 be tested."* If the monetary authority wishes to slow the inflation trend it has to deliver a lower trend growth rate for the money .supply. Therefore, anti-inflation policy is simple to design and execute.
Second, if our understanding of fiscal policy is to be illuminated by the link between deficits and inflation, one must seek this connection not only in the impact of inflation on public finances but also in the effect of money creation on inflation. To model the public sector of the economy, we use the logic of the public finance approach to inflation. In a closed economy, it is as.sumed that all debt takes the form of non-interest bearing money. Any primary public sector deficit must be financed by printing money. On this basis the public sector budget identity will be
(G-T]/Y=AH/Y (2)
where G stands for public expenditures, T stands for public sector revenues,
Y stands for nominal income and H denotes base money. In a steady state
growing economy, by using simple arithmetic
A{H/Y) ={H/Y)[{AH/H)-{AY/Y )] ={AH/Y) -(H/Y ){Ap +g) (3)
where Ap and g are inflation and the growth rate of real income, respectively. ft is assumed that the long-run income elasticity of demand for money is unity. Then the simplified budget constraint can be determined as
A[HlY)HG-T)IY-{HIY){Ap+g) (4)
As a fraction of nominal income, G-T must be financed either by inflation tax H{Ap) or the real seigniorage Hg which accumulates to the government when income and money demand increases and the corresponding supply of money is provided; if not, it must be financed by increasing the real money stock at a rate which exceeds that justified by money demand given inflation and real income growth. Solving (4) for inflation we obtain
Ap = c + y{((G-T)/H)-g) (5)
In (5), c represents the constant term which can be interpreted as the inertial inflation rate and y is expected to equal one.'' The justification t3ehind this reverse equation (5)'' is that fiscal expansion is inflationary; any increase in the budget deficit, however caused, is likely to be inflationary even if it is only partly monetized.
Following from this, a model regarding the determination of inflation in an open economy context is considered. If there is a long-run tendency for ^For the Turkish data, this claim was tested in Metin (1992, Ch. 5, pp. 142-45). It was evident that inflation, the level of real income and the interest rate are weakly exogenous for the parameters of the money demand function.
'See Phelps {1973), Begg (1987), Anand and van Wijnbergen (1989) and Rodrik (1990). ''The direction of the causality between the public sector deficits and inflation is examined in Metin (1994) by employing an econometric model which tests the exogeneity and endogeneity status of the variables.
516 BULLETIN
domestic prices to follow foreign prices measured in a common currency, then this occurrence can be well represented by Purchasing Power Parity (PPP). The PPP specification can be written as
Pn = e+P\^ (6)
where p,,, p^, e represent the logarithm of domestic and world prices and the exchange rate respectively. Consequently, price equalization between coun-tries depends on the exchange rate regime in operation. The 'Law of One Price' also applies to financial assets in the form of Uncovered Interest Rate Parity (UIP). The UIP relationship can be defined as
r[) = Ae + rw (7)
where r,, and r^ represent the logarithm of the domestic and the world nominal interest rates and Ae is the expected change in the exchange rate.
Finally, domestic wage inflation, which is related to excess demand in the economy, can be modelled. If producers follow mark-up pricing, then nominal wage (W) claims above the productivity level are reflected in prices. So, for the unions, the long-run nominal wage is associated with the price level, unemployment (U) and labour productivity {Lp) while the wage which concerns producers is related to the level of producer prices and the produc-tivity level. Therefore the 'wedge' between the workers' cost of living and the prices received by manufacturing firms should also be considered.'' In wich case, the real wage ( W,) relationship is summarized as
(8) where the wedge is denoted by {Wed). Then (8) is reparameterized using labour productivity adjustment:
W,-Lp=-aAp-pU + rWed (9)
It means that real wages increase in proportion to labour productivity. There-fore, productivity adjusted real wages are determined negatively by the level of unemployment and inflation, positively by a wedge. It can also be inter-preted as an unemployment equation as given below
(10) It is clear from the above analysis that there are many explanations for inflation. Alternatively expressed, each of the sectoral theories captures a pan, but not all of the story. Moreover, in time each may be of differing importance. An econometric structure which embodies all of the disequi-libria, contains the conditional exjjectation of current inflation given two information sets
'See Nickell (1982, 1984), Layard and Nickell (1986), Hall (1986, 1989), Hall and Henry (1987). Jenkinson (1986), Beckerman and Jenkinson (1986a, b), Clements and Mizon (1991) and Juselius (1991) for theory and empirical applications.
AN INTEGRATED ANALYSIS OF TURKISH INFLATION 5 1 7 E{Ap\I,,h) (11)
=|ECM- W,_,,ECM-M,_,,ECM-PPP,_,, ECM-UlP,_,,ECM-def,_,)
where /= 1, 2. /, includes the basic variables of interest, ECMs which are derived from the sectoral relationships of the economy. L represents a linear function of variables which includes the short-run effects arising from the changes in the related variables through the channels of transmission mechanisms.
The variables in the model are constructed as follows. ECM - M is the cointegration relationship among {M/P), (Y/P), R. It shows that an infla-tionary monetary policy — the monetary growth in excess of the growth in real productive factors — affects the inflation rate. ECM-def is the co-integration relationship among (G-T)/H, (H/Y), g, Ap. It shows that {G-T) must be financed by increasing the real money stock. ECM-PPP and ECM - UIP are obtained from the cointegration relationships of
(Pt)~Pw~^) and ('•/;"'• iv~^^) respectively. The effects of disequilibrium in
the goods and capital market on inflation are represented by the ECM-PPP and the ECM-UIP. UY (the residual obtained from the regression of nominal income on a constant and trend) represents the excess demand for goods. When aggregate demand is above the full employment level, nominal wages are bid up and this will put an upward pressure on prices. To represent this effect, E C M - W is defined as the cointegration relationship among W,,
U, Lp, Ap, Wed. Q contains the set of variables which includes constant,
.seasonal and intervention dummies. All variables are derived in Section III. First, the inflation rate is regressed on the variables in /, and L" and then the parsimonious model is obtained after some sequential reductions. As a whole, therefore, the structural model of the inflationary process will be constructed in the context summarized above and examined empirically in the remainder of this paper.
III. LONG-RUN SECTORAL ANALYSIS OF INFLATION
The aim of this section is to analyse the long-run inflation determination in each sector of the Turkish economy using cointegration analysis and to produce some proxies to represent each sector's excess demand which will be used in the disequilibrium analysis in Section IV.
''A more general model where all the ECMs interact to allow non-linear reactions was too complicated to estimate from the small data sample available.
/. Monetary Inflation (Quarterly)
This section analyses the inflationary effects of the Turkish monetary policy over 1949(4)-1987(4).'' In order to test for cointegration the maximum likeli-hood procedure developed in Johansen (1988) and Johansen and Juselius (1990) is used. Test statistics are reported in Table 1. Looking at both the trace and the maximum eigenvalue statistics leads us to accept definitely one and possibly two cointegrating relationships and two unit roots. Interpreting fj the evidence, from the first row of the standardized eigenvectors, one co-integrating combination seems to represent a real money demand relationship as, (1, 10.0, -2.86, 0.10). Thus,
(ml -p) = -lOOAp-l- 2.86( y - p ) - O . l O r
could well be a long-run solution for real money balances except perhaps for the high real income elasticity coefficient, which is about 2.9, This is well defined if there is indeed only one cointegration relationship. The second potential cointegration vector can be obtained from the renormalization of the first and the second rows of a standardized eigenvector matrix as
Ap=0.6(y-p) + 0.lr. This suggests that inflation is stationary around the
real income and interest rates. The adjustment coefficients, which are often called loadings, show that the main effect of the first cointegrating vector (long-run demand for money) is on (ml - p ) ; however, there is almost no effect on the other variables. This is a strong indication of the weak exo-geneity of these variables for the long-run parameters of the demand for money function. In the second column of loadings, a feedback appeared from inflation on interest rate despite the fact that they do not seem to be cointegrated beyond the excess demand effect. Overall, in the Turkish economy, real money demand is determined by inflation, interest rates and income.
2 Public Sector Inflation (Annual)
In this subsection, we examine the cointegration relationship among four variables, namely, base money over income, [HjY), the growth rate of real income, g, inflation and the deficit over base money ( G - T)/HA" According ''Ml is nominal money (narrow, definition: currency in circulation plus demand deposits), P IS the GNP price deflator, Y is constant price GNP and R is the Central Bank Nominal Discount Rate. The main series are taken from the IMF International Financial Statistics — several monthly issues — and are quarterly, seasonally unadjusted. Since Turkish GNP and the GNP deflator are only available as a yearly base, we generated them quarterly using the method suggested by Fernandez (1981) (see Metin (1992, pp. 132-35) for the details).
'"The data on central government expenditures and revenues are based on Ministry of Finance sources. GNP and the price level — consumer price index — are obtained from
Inter-national Financial Statistics. Base money is based on Central Bank resources. The central
government deficit does not include the SEEs deficit. Since reliable statistics about SEEs deficits are available after the second half of the 197O's the central government deficit is there-fore used as a proxy for the total deficit.
AN INTEGRATED ANALYSIS OF TURKISH INFLATION
TABLE I
Monetary Sector Analysis
Johansen Tests for the Number of Cointegrating Vectors*
519 Eigenvahies-Null r = () r^l r<2 r<3 0.0'>5. 0.053, 0.141. O.M)9 Alternative r>l r>2 r>3 r=A Max Score (0.%) 56.75(27.34) 23.41 (21.27) 8.44(14.59) 3.99(8.083) Trace Score (0.95) 92.59(48.41) 35.84(31.25) 12.43(17.84) 3.99(8.083) *The order of the VAR is 4. We have included a constant term and trend In the VAR. /• denotes number of cointegration vectors. The Trace' and the "Max' statistics are defined in Johansen and Juselius (1990). The critical values are taken from Table A2 in Johansen and Juselius (1990). Variable ml -p Ap Variable ml —p 1.000 - 0 . 1 6 3 ml -p Standardized eigenvectors Ap y-p 10.047 -2.867 1.000 1.408 Standardized loadings Ap r 0.102 ().J04 ml —p Ap y-p r - 0 . 1 4 1 - 0 . 0 1 6 0.008 0.046 -0.130 0.044 -0.126 0.141
to the values of both trace and maximum eigenvalue statistics in Table 2, there is one cointegrating relationship and three unit roots.
The first row of standardized eigenvectors can only be interpreted as an inflation equation rather than as a deficit over base money or as base money over income relationship, because none of the last two yielded a target relationship with the correct signs for the parameters. The cointegration relationship as given below, highlights the important determinants of the inflation rate.
^p = 2.1{G-T)|H-2.5g+\.\[h-y)
TABLE 2
Public Sector Deficit Analysis
Johansen Tests for the Ntimber of Cointegrating Vectors* Eigenvalues: 0.051, 0.218, 0.437, 0.518
Max Trace
Nttll Alternative Score (0.95) Score (0.95)
r = 0 r>\ 26.32(27.34) 20.72(21.27) 8.85(14.59) 57.80(48.41) 31.48(3L25) 10.75(17.84) r S 3 r-A
"The order ofthe VAR is
Variable Row 1 Variable Ap 1.0 Col 1 (h-- 1 . 1.90 (8.08) 2. We have included a constant term
Standardized eigen vectors y) g G-T/H
124 2.451 - 2 . 7 0 3
Standardized loadings
1.90 (8.08) and trend in the VAR.
Ap 0.129 ih-y) - 0 . 1 6 8
.1,' 0.136
G - T/H - 0.264
Firstly, the deficit explains much of Turkish inflation for the sample period. On the basis of the cointegration relationship, we cannot reject the positive relationship between inflation and the public sector deficit (as a percentage of
H). Secondly, inflation is determined by the monetization of the economy
and more specifically the ratio of base money to income.
3. Inflation in an International Context (Annual)
We now tum our empirical consideration to exchange rate behaviour and inflation, built around the PPP and the UIP — observed Interest rate
A N INTEGRATED ANALYSIS OF TURKISH INFLATION 521
tials." The sample period is 1950-87, covering three devaluations, and which shifted from a fixed to a fioating regime in 1980.'
-It is expected that there is a cointegrating vector, including all five variables namely, p^, p^, e, r^ and r^ in which the hypothesis that the coefficients of variables are 1, - 1 , - 1 , 1 and - 1 respectively. According to the trace and the maximum eigenvalue statistics, definitely one, and possibly two, co-integrating vectors were obtained in Table 3. The first eigenvector is close to PPP regarding the sign of parameters. However, in terms of the size of the variables, it does not satisfy the target relationship which is summarized as (1, - 1 , -1). Unfortunately, we could not find any evidence on ob.served interest rate differentials in the first two rows of standardized eigenvectors; even the linear combinations of them could not provide a meaningful parameter set. To sum up, the PPP relationship was only derived as being, P/, = 0.6p,, + 0.7e. Having no evidence on the intere.st rate differentials can be explained by a policy change in the interest rate adjustments during the early
198O'.s.
4. Inflation in the Labour Sector (Annual)
This subsection examines real wage and price determination in Turkey over the period 1963-88. The set of variables modelled in the system is: W, is the real wage defined as the difference between the logarithm of the nominal wage and the logarithm of the manufacturing wholesale price index; the labour productivity is defined as Lp =ym — memp, where ym is the logarithm of real manufacturing industries" output and memp is the logarithm of the number of employees in the manufacturing industry. U is the total number of officially recorded unemployed workers. The wedge is represented as the difference between the logarithm of the consumer price index and the logarithm of manufacturing industries' wholesale price index. Therefore, the variable set contains real wage, infiation, a wedge, labour productivity and the imemployment level.'^
According to both maximum eigenvalue and the trace statistics given in Table 4, two cointegrating relationships were obtained. Renormalization of the first and the second rows of a standardized eigenvector matrix yielded below given relationship
'' See Johansen and Juselius (1991) and Juselius (1991) for related empirical works.
'-The data can be summarized as: /'„ is Turkish consumer price index ( 1 9 8 0 = 100), /'„ is industrial countries' consumer pnce index (1980 = 100). Traditionally, the main trade partners of Turkey are OECD countries, including EC countries, the LIS, Japan and the other industrial-ized countries. Therefore, industrialindustrial-ized countries have been chosen to represent the foreign influence, e is the exchange rale measured as TL over the US dollar ( 1 9 8 0 = 100), /•„ is the Turkish time deposit rate (annual), r,, is the US treasury bond rate. The series are taken from International Financial Statistics — several issues.
' 'The data is obtained from Bulutay (1990) and Uygur (1990).
522 BULLETIN
TABLE 3
Exchange Rate Analysis
Johansen Tests for the Number of Cointegrating Vectors*
Eigenvalues: 0.042, 0.196. 0.363. 0.470, 0.605
Max Trace
Null Alternative Score (0.95) Score (0.95)
/-=0 r<2 r>2 r>3 r>A r=5 35.34(33.26) 24.13(27.34) 17.18(21.27) 8.29(14.59) 1.66(8.083) 86.62(69.97) 51.28(48.41) 27.14(31.25) 9.96(17.84) 1.66(8.083)
*The order of the VAR is 2. A constant and a trend are allowed to enter the edly. in order to model a linear trend in the levels of the price variables.
Standardized eigenvectors Variable Row 1 Row 2 Variable Pn 1.000 0.273 Col. 1 /'M e r,, -0.628 -0.697 -0.477 1.000 -0.757 -0.705 Standardized loadings Col. 2 VAR unrestnct-5.346 -7.465 -0.147 0.020 -0.694 0.041 0.040 -0.359 -0.011 -0.333 - 0.008 -0.028
It suggests that unemployment is determined positively by real wages and inflation and negatively by labour productivity. In addition, the wedge has some positive effects on the unemployment level.
rv DISEOUILIBRIUM DETERMINATION OF TURKISH INFLATION Now we draw together the preceding analyses to examine the disequilibrium effects on prices in Turkey. Recalling the model which is given in Section II (see equation (11)) the structural model of the inflationary process was constructed. Here we used ECMs — each represents its sectoral excess
AN INTEGRATED ANALYSIS OF TURKISH INFLATION 523
TABLE 4
Labour Sector Analysis
Johansen Tests for the Number of Cointegrating Vectors*
Eigenvalties: 0.0.19. 0. '66. Null r=0 r<l r<2 r < 3 ;-<4 native r>l r>2 r>3 r>4 r=5 0.4^9 0 7?0 0 9!7 Max. Score (0.95) 56.06(33.26) 30.14(27.34) 14.16(21.27) 7.12(14.59) 0.92(8.083) Trace Score (0.95) 108.43(69.97) 52.36(48.41) 22.21(31.25) 8.05(17.84) 0.92(8.083) Scaled trace Score 84.85 40.97 17.38 6.30 0.07
*The order of the VAR is 2. We have included a constant term and trend in ihe VAR. Given the short length of the data and the large number of variables, the trace tesi is scaled by T- k. T \s the number of observations and A the number ol coetticienls. This yielded only one significant cointegrating vector Variable Row 1 Row 2 Variable U 1.00 -3.263 Cot. 1 Standardized eigenvectors W, - 1.00 1.00 Lp -11.071 -10.321 Standardized loadings Col. 2 A/; - 1 - 1 .885 .083 wed 6.130 6.632
u
w,
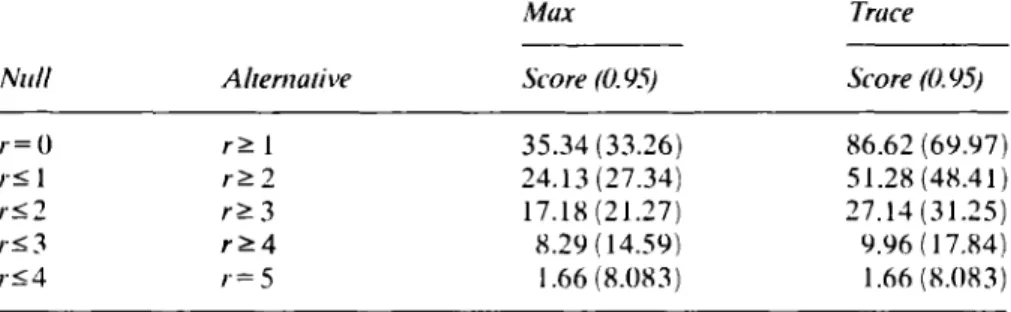
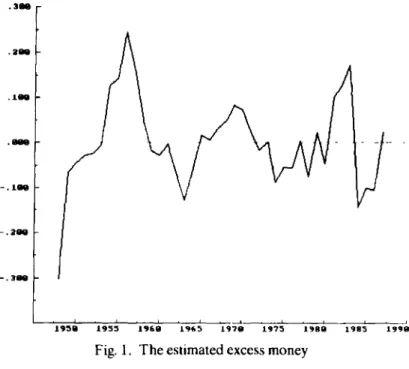
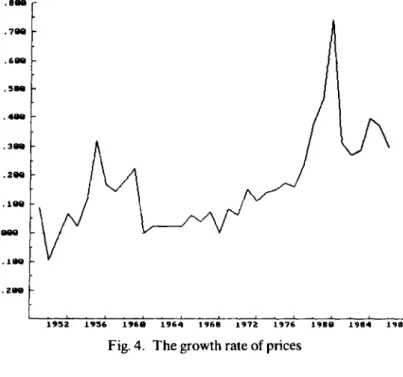
Lp Ap wed 0.168 0.019 -0.018 0.176 0.101 -0.070 0.048 -0.044 -0.043 - 0.005demands — which were derived in the previous Section III in addition to some short-run variables. Figures 1-5 show E C M - M , E C M - P P P and ECM - UIP, the growth rate of price level and (G - T)/H respectively.
A parsimonious model was obtained after several sequential simplifica-tions of model (1 ).'* The final outcome is given in model (2).'^
'••We should inform the reader of several points: (i) T h e E C M - M in model ( I ) differs from the cointegration vector in Section III.l, since yearly data was used for the w h o l e analysis, and s o we reproduced E C M - M annually, (ii) T h e data analysis suggested that ( G - T)/H w a s
BULLETIN
1930 19S3 1970 197S 1980 198S 1990
Fig. 1. The estitnated excess money
In terms of diagno.stic test statistics, the estimated model (2) performed satisfactorily. There was no indication of residual autocorrelation (see y4/?|_2f =0.55), and the normality of the residuals was accepted (once D55 was included).'* ARCHiF{l, 26) = 2.77 did not reject homoscedasticity of residuals. However, the RESET test suggested a possible non-linearity in the model. This is not surprising since many of the disequilibria are likely to interact: e.g. a given deficit may cause higher inflation when the excess demand for goods is larger. The standard error of the equation was 0.06. This is a good prediction for Turkish inflation, which has shown substantial able to the residuals (ECM — def). (iii) Regrettably, a reliable data series for the labour sector is only available after 1960; therefore, ECM — W has not been taken into account in the following analysis due to the limited data length. Using the data from 1960 to 1987, model (1) including ECM - W was also estimated, but the results did not suggest any significant effects from the labour market on Turkish inflation.
"One cannot expect any ECMs which are weakly exogenous for the parameters of the model (2). Weak exogeneity suggests that all the cointegrating vectors enter only the conditional model. Cointegrating exogeneity (Hunter, 1990,1992) implies that long-run relations are block triangular, therefore it means no long-term feedback of inflation onto related ECMs. Weak exogeneity is also not necessary here since an efficient analysis is impossible due to data limita-tions (see Engle « aL, 1983).
"'The model in equation (2) basically suffered from a major outlier in 1955 which was not explained by the variables in the infonnation set, and did not correspond to any obvious historical events. Thus, we created a dummy (D55) to pick this up.
AN INTEGRATED ANALYSIS OF TURKISH INFLATION 525
1950 1935 14<>3 1 9 7 « 197S 1 9 8 8 19B5 19')a
Fig. 2. The deviations from the purchasing power parity
1.30
-.20
1932 1936 19«B 19*4 196B 1972 197* 198B 19B4 198«
Fig. 3. The deviations from the interest rate differentials
.700 .too .3B0 .400 .300 .200 .100 1932 1936 19tO 19«4 196B 1972 1976 1980 19114 1988
Fig. 4. The growth rate of prices
1930 1933 19tO 19«3 197O 1973 1980 198S 1990
Fig. 5. (G-T)/H
AN INTEGRATED ANALYSIS OF TURKISH INFLATION TABLE 5
Modelling the Turkish Inflation by OLS, 1950-86
527 Dependent variable is Ap Variable 0 Constant UY UY_, ECM-PPP., ECM-UIP ECM-U1P_, ECM-M ECM-M_, {G-T)IH A{{G-T)/Y) Apw AECM-M (ECM-UIP)/2 D55 g R-a Fdi DW Normality x"i 2, AR,_,, Fjf ARCH,,fj, RESET, Fj, Model (1) Coef (std. err.) -0.175(0.276) -0.001(0.178) -0.027(0.389) 0.130(0.289) 0.127(0.079) -0.102(0.089) -0.141(0.080) 0.278(0.217) -0.328(0.238) 1.298(0.318) -4.702(1.63) 1.504(0.655) 0.8405 0.0793 11.98,,,,, 2.046 6.0 0.47,,,, 0.20,;;,, 2-11.,,24, Model (2) Coef. (std. err.) -0.064(0.039) 0.074 (0.044) 1.111 (0.135) -3.901(0.670) 1.663(0.362) 0.229(0.099) -0.272(0.093) 0.257(0.020) -0.234(0.166) 0.8973 0.0601 30.58,^,«, 2.072 " ' 1.33 0.55,, ,„, 2.77,2,,, 3.74,,.,,, Notes: f^R, _ is a test for (th or /th order autocorrelation suggested by Harvey (1981). /^A is the ARCH test (AutoRegressive Conditional Heteroscedasticity due to Engle (1982). is Ramsey's (1969) test.
iticreases iti the sample period, in particular in the late 197O's with three-digit inflation and most of the 198O's with over 40 percent per annum. Further-more, testing for constant parameters of model (2) showed no predictive failure over a subset of seven observation. In fact, forecast x^(7)/7 = 1.66 and the Chow test F[l, 22) = 1.55 showed no misprediction of the model.
A crucial feature of model (2) is that the lagged dependent variable did not matter, so it was eliminated from the model at an early stage of the simplifica-tion process. Inflasimplifica-tion transpires to have much less inertia than might have been anticipated: the ECMs explain its behaviour and reveal relatively rapid O BlackweU Publishers Ltd. 1995.
528 BULLETIN
reactions. Excess demand for goods as measured by UY had no effect on infiation. However, the growth rate of real income appeared with a negative coefficient (-0.23), although it was not statistically significant (omitted variable F test f ( l , 27) = 0.796). E C M - M was included but not significant in levels. The effect of excess money (ECM - M) only enters as a change, and suggests that there is no long-run effect, given the other explanatory variables. Therefore, monetary expansion increases short-run infiation.
External transmission effects, which come from the disequilibrium between the goods and assets markets, appear in two ways. Firstly, the coeffi-cient of the ECM - PPP,_ I is 0.07 and is significant at the 10 percent level. Economic theory suggests that PPP falls should lead to more infiation. However, in this case, a negative correlation between PPP and Turkish infiation was not found. During the sample period, {p,)~Pw) went up dramatically but the exchange rate fell even further. Therefore, PPP fell substantially and this led Turkish infiation to rise relative to world infiation. In addition, an imported inflation effect on Turkish infiation appeared in the highly significant coefficient of Ap^y. The parameter of Ap^ should not be greater than one; however, here it appeared as 1.663. For the overall benefit of the model (2) we retained it. Secondly, an additional effect arising from a disequilibrium in the asset market emerged in the coefficient of (ECM-UlP)/2 which is averaged as, 1/2(ECM-UIP, + ECM-UIP,_,), is
-0.27 and is highly significant.
The most important determinant of infiation appears in the central government deficit per unit of base money, measured by {G-T)/H and
A({G-T)/Y The former appeared with almost a unit coefficient and affected
infiation directly with a highly significant parameter. Fiscal expansion is indeed inflationary in Turkey. When A{G-T)/Y was included in the model, it improved the sign and size of the parameters of the other variables.'^ Economically, this suggests that public sector deficit increases result in a short-run increase in nominal income which in turn lowers infiation. But in the following stage, the resulting demand pressure leads to an increase in infiation which persists while the deficit continues. This supports the view that an excessive deficit of the public sector to a large extent was the main source of persistent high inflation. Therefore, there is a strong relation between the public sector deficit and the inability to bring infiation down.
V. CONCLUDING REMARKS
This paper aimed at analysing inflation in a general framework of sectoral relationships rather than a specific and delineated single sector analysis. In
consider the effect of the public sector on inflation we tried several forms of deficit scaling, namely, (G-T)IH, (G-T)IY, ((G- T)IH-g) and finally ECM-def in the modelling. Eventually, inclusion of ( G - T)/H and A((G- T)IY provided a better result than the others and helped to obtain a correct sign and an interpretable size of the other parameters of the model.
AN INTEGRATED ANALYSIS OF TURKISH INFLATION 5 2 9
this sense, it highlights the relative importance of .sectors which contribute to infiation. By conducting a disequilibrium analysis, it was found that fiscal expansion dominated the determination of inflation. The excess demand for money affected inflation positively but only in the short-run. Imported infla-tion and the excess demand for assets in capital markets had some effect on consumer price inflation while there was no significant effect from the excess demand for goods. A key policy implication is that infiation could be reduced rapidly by eliminating the fiscal deficit.
Bilkent University, Ankara, Turkey
Date of Receipt of Final Maniisc ript: November / W4
REFERENCES
Anand, R. and van Wijnbergen, S. (1989). 'Inflation and the Financing of Govern-ment Expenditure: an Introductory Analysis with an Application to Turkey', The World Bank Economic Review, Vol. 3, pp. 17-38, The International Bank for Reconstniction and Development, The World Bank.
Beckerman, W. and Jenkinson, T. (1986a). 'What Stopped the Inflation? Unemploy-ment or Commodity Prices?', The Economic Journal, Vol. 96, pp. 39-54.
Beckerman, W. and Jenkinson, T. (1986b). How Rigid are Wages Anyway?', in Beckerman, W. (ed.). Wage Rigidity, Unemployment and Macroeconomic Policy, London, Duckworth.
Begg, D. (1987). 'Fiscal Pblicy", in Dornbusch, R. and Layard, R. (eds). The Perform-ance of the British Economy, Oxford University Press, Oxford.
Bulutay, T. (1990). 'Labour Market Information System in Turkey', Chapter 3 of
Report on Employment in Turkey, mimeographed, Ankara, ILO.
Clements, M. P. and Mizon, G. E. (1991). Empirical Analysis of Macroeconomic Time Series: VAR and Structural Models', European Economic Review, Vol. 35, pp. 887-917.
Engle, R. F. (1982). 'Autoregressive Conditional Heteroscedasticity with Estimates of the Variance of United Kingdom Inflation', Eeonometrica, Vol. 50, pp. 982-1008. Engle, R. F., Hendry, D. E and Richard, J.-F. (1983). 'Exogeneity', Eeonometrica, Vol.
51, pp. 277-304.
Engle, R. F. and Granger, C. W. J. (1987). 'Cointegration and Error Correction: Representation, Estimation and Testing', Eeonometrica, Vol. 50, pp. 987-1008. Fernandez, R. B. (1981). A Methodological Note on the Estimation of Time Series',
Review of Economics and Statistics,Vo[. 53, pp. 471-76.
Fry, M. J. (1980). 'Money, Interest, Inflation and Growth in Turkey', Journal of Monetary Economics, Vol. 6, pp. 535-45.
Fry, M. J. (1986). 'Turkey's Great Inflation', METU Studies in DevetopmetU, Vol. 13, pp. 95-116.
Hall, S. G. (1986). 'An Application of the Granger and Engle Two-Step Estimation
Procedure to United Kingdom Aggregate Wage Data', BULLETIN, Vol. 48, pp. 229-39.
Hall, S. G. (1989). 'Maximum Likelihood Estimation of Cointegrating Vectors: An Example of the Johansen Procedure', BULLETIN, Vol. 51, pp. 213-18.
Hall, S. G. and Henry, S. G. B. (1987). 'Wage Models', National Institute Economic Review, February.
Harvey, A. C. (1981). The Econometric Analysis of Time Series, Philip Allan, London. Hume, D. (1963). 'Of the Balance of Trade' in Essays: Moral, Political and Literary,
London, Oxford University Press.
Hunter, J. (1990). 'Cointegrating Exogeneity', Economics Letters, Vol. 34, pp. 33-35. Hunter, J. (1992). 'Tests of Cointegrating Exogeneity for PPP and Uncovered Interest Rate Parity in the United Kingdom', Joumal of Policy Modelling, vol. 14, pp. 453-63.
Jenkinson, T. J. (1986). 'Testing Neo-classical Theories of Labour Demand: An Application of Cointegration Techniques', BULLETIN, Vol. 48, pp. 241 -51. Johansen, S. (1988). 'Statistical Analysis of Cointegration Vectors', Joumal of
Economic Dynamics and Control, Vol. 12, pp. 231 -54.
Johansen, S. and Juselius, K. (1990). 'Maximum Likelihood Estimation and Inference on Cointegration with Applications to the Demand for Money', BULLETIN, Vol. 52, pp. 169-210.
Johansen, S. and Jusehus, K. (1991). Testing Structural Hypothesis in a Multivariate Cointegration Analysis of the PPP and the UIP for UK', Joumal of Econometrics, Vol. 53, pp. 211-44.
Juselius, K. (1991). 'Long-run Relations in a Well Defined Statistical Model for the Data Generating Process: Cointegration Analysis of the PPP and UIP Relations Between Denmark and Germany', in Grueber, J. (ed.), Econometric Decision Models: New Methods of Modelling and Applications, Springer Verlag.
Juselius, K. (1992). 'Domestic and Foreign Effects on Prices in an Open Economy', Journal of Policy Modelling, Vol. 14, pp. 401-28.
Layard, R. and Nickell, S. (1986). Unemployment in Britain', Economica, Vol. 53, pp. 121-70.
Metin, K. (1992). The Analysis of Inflation: The Case of Turkey (1948-1988), Unpublished D.Phil. Thesis, University of Oxford.
Metin, K. (1994). 'Modelling the Public Sector Deficit of the Turkish Economy', Department of Economics Discussion Paper, No. 1994-1, Bilkent University, Ankara, Turkey.
Nickell, S. J. (1982). 'The Determinants of Equilibrium Unemployment in Britain', Economic Joumal. Vol. 92. pp. 555-75.
Nickell, S. J. (1984). 'The Modeling of Wages and Employment', in Hendry, D. F. and Wallis, K. F. (eds). Econometrics and Quantitative Economics, Basil Blackwell. Onis, Z. and Ozmucur, S. (1990). 'Exchange Rates, Inflation and Money Supply in
Turkey; Testing the Vicious Circle Hypothesis', Joumal of Development Eco-nomics, Vol. 32, pp. 133-54.
Phelps, E. (1973). 'Inflation and the Theory of Pubhc Finance', Swedish Joumal of Economics, Vol. 75, pp. 67-82.
Ramsey, J. B. (1969). 'Test of Specification Errors in Classical Linear Regression Analysis', Jotimal of the Royal Statistical Society, Vol. B31, pp. 350-71.
Rodrik, D. (1990). 'Premature Liberalization, Incomplete Stabilization: The Ozal Decade in Turkey', J. F. Kennedy School of Government, Harvard University, Cambridge, mimeo.
AN INTEGRATED ANALYSIS OF TURKISH INFLATION 531 Surrey, M. J. C. (1989). Money, Commodity Prices and Inflation: Some Simple Tests',
BULLETIN, Vol. 51, pp. 219-39.
Togan, S. (1987). 'The Influence of Money and the Rate of Inflation in a Financially Repressed Economy: The Case of Turkey', Applied Economics, Vol. 19, pp.
1585-601.
Uygur, E. (1990). 'Pblicy, Productivity, Growth and Employment in Turkey, 1960-1989, and Prospects for the 1990s', ILO MIES Document No. 90/4.