An Application to Turkey
BySfibidey "logan
C o n t e n t s : I. Export Incentives. - II. Interindustry Distribution o f Incentives. - III. Conclusion.
I
was forced to reschedule its debts to Western governments and n 1979, Turkey ran up against the limits of foreign borrowing and foreign commercial banks. A precondition for rescheduling was the acceptance of the IMF's structural adjustment program imple- mented on January 24, 1980. B y 1985, Turkey's current account deficit was a manageable $1 billion. The balance-of-payments turnaround during the 1980s was achieved largely by dramatic improvements in exports. Exports increased from $2.9 billion in 1980 to $13.6 billion in 1991. The increase in exports experienced during the 1980s was achieved through a consistent export promotion policy, which relied on three main instruments: exchange rate policy, which affects every tradeable good; credit policy and fiscal incentives, both of which tend to present biased sectoral effects.In this paper, we study quantitatively the system of export incen- tives in Turkey. We abstain from considering exchange rate policy, and rather investigate in what way the credit policy and fiscal incen- tives have affected the structure of nominal and effective subsidy rates. The following section analyzes the determination of sectoral export subsidy rates under each of the various export incentive mea- sures. The characteristics of inter-industry distribution of export sub- sidies are presented in Section II. The final section gives some policy recommendations of rationalizing the subsidy system.
Remark: This research was supported by a grant from the Turkish E X I M B A N K . The author wishes to acknowledge his indebtedness to E X I M B A N K . However, E X I M - B A N K bears no responsibility for any errors or views expressed in this paper.
778 W e l t w i r t s c h a f t l i c h e s Archiv
I. Export Incentives
The quantitative analysis of export incentives is carried out in this paper under eight headings: (i) export credits, (ii) tax rebate scheme, (iii) premium from the "Support and Price Stabilization Fund", (iv) taxation of agricultural commodities subject to the "Support and Price Stabilization Fund", (v) duty free imports of intermediates and raw materials, and exemption from the value added tax, (vi) foreign exchange allocations, (vii) exemption from the corporate income tax and (viii) other subsidies.
E x p o r t C r e d i t s
The Turkish export credit system has operated in accordance with a structure typically of most developing countries. The Central Bank has provided funds that were channeled through private commercial banks to producers/exporters of selected products at favorable terms. Simultaneously, the government subsidized the commercial banks that were providing export credits from their own sources. In both cases, export credits are exempt from various taxes, duties and fees. To analyze the amount of subsidies provided through export credits, we consider the cost of loanable funds in the three markets. Since figures on the interest cost paid by the borrower are not publicly available, we first derive estimates of the effective cost of credits for the commercial banking system. Then we consider the determination of the cost of export credits when funds for these credits are obtained from (i) Cen- tral Bank sources and (ii) from commercial bank sources.
In Turkey, a commercial bank accepting demand and/or time de- posits has to keep as reserve requirements constant fractions of de- mand and time deposits, respectively. The bank receives interest on reserve requirements. In addition, the bank is required to keep a con- stant fraction of total deposits as liquidity requirement, which may consist of cash, deposits in the Central Bank, and treasury bills and bonds.
Let D 1 be the demand deposits, D 2 the time deposits, D = (D 1 +D2) total deposits, a,t the reserve requirement ratio on demand deposits, a,2 the reserve requirement ratio on time deposits, and a d the liquidity requirement ratio. The bank obtaining the deposits D x and D2 can provide as credit the following total amount of funds
The cost of these funds to the banking system will be
C = r i D 1 + r21D21 -t- r22D22 -t- r23D23 -I- r 2 4 D 2 4 + g D - r r l a r l D 1 - - r r 2 d r 2 D 2 - - r d a a D ,
where
r 1 interest rate on demand deposits,
r2i interest rate on time deposits with a duration of one m o n t h for
i = 1, three months for i = 2, six months for i = 3 and one year for
i = 4 ,
O the ratio of general expenses to deposits,
r,1 interest rate paid on required reserves held against demand de- posits,
r,2 interest rate paid on required reserves held against time deposits, r~ interest rate paid on liquidity reserves,
Dt demand deposits,
D2i time deposits with a duration of one m o n t h for i = 1, three months for i = 2, six months for i = 3 and one year for i = 4 ,
D 2 total time deposits (D21-I-D22q-D23d-D24).
The cost of transferable funds to the banking system is given by
R , , = ( C / F ) .
The cost of transferable funds show the cost of funds to the banks. The banks add to this cost their "commission", a transactions tax which is a constant fraction of the cost of transferable funds, the contribution to the "Interest Differential Rebate F u n d " which is a fraction of the cost of transferable funds, the contribution to the "Re- source Utilization Support F u n d " which replaced the "Interest Rate Rebate F u n d " in 1985, and a stamp duty. The sum total of the cost of transferable funds, R,,, and related expenses yields the nominal cost of credit, Rn.
The nominal cost of credit still does not represent the effective cost of credit to the borrower. The banks usually block a certain percentage of loans in commercial bank deposits. The percentage of proceeds so blocked vary widely from bank to bank and from client to client. The percentages fall between 20 and 30 percent, but are in some instances higher as indicated by Ersel and Sak [1988]. When estimating this percentage denoted by b, we have used data on commercial deposits and total credit of deposit money banks, and divided the annual change in commercial deposits to the annual change in total deposits. We have taken 50 percent of the evaluated values as the estimated
780 W e l t w i r t s c h a f t l i c h e s A r c h i v
values. The estimated value of the effective cost of borrowing is deter- mined as:
Re = R,/(1 -- b).
Next, consider the interest cost of export credits when extended through Central Bank sources. The determinants of the interest cost in this case can be summarized under three headings: (i) the interest rate charged by the Central Bank on funds given to commercial banks when these funds are to be used for export credits, (ii) exemption from various taxes related to export credits, and (iii) the interest rate rebate received from the "Interest Rate Rebate Fund".
The interest rates on export credits charged by the Central Bank are publicly known. The bank providing the export credits adds to this amount a bank commission. The export credit is exempt from the transactions tax and stamp duty. Until 1985, the bank had to con- tribute to the "Interest Differential Rebate Fund" which was replaced in 1985 by the "Resource Utilization Support Fund". The bank ex- tending the export credit received a rebate from the "Interest Differen- tial Rebate Fund" established at the Central Bank. Since banks block 20 to 30 percent of the loans and ask the borrower to keep the amount in commercial bank deposits, the final cost of export credits, when extended through Central Bank sources, will be determined following the procedures of the previous section.
The above considerations apply when the bank obtains the funds from the Central Bank sources. The bank could also use its own funds. According to Turkish regulations, the reserve requirements and liquid- ity requirement ratios in this case are much smaller than in the case of funds used for extending non-preferential credits.
Let D represent the deposits, a,~ the reserve requirement ratio on deposits when funds are used to finance export credits, and adx the liquidity ratio. The total resources the banking system can provide as export credit will be
Fx = D - - a r x D - ad~ D .
The cost of these funds to the banking system will be
Cx = r i D 1 + r21D2t + r22D22 + r23D23 + r2,tD24
+ o D - r , x a , x D - rdxaaxD - - $irrfD
where
rdx interest rate paid on liquidity requirements,
si,,f subsidy rate paid from the Interest Rate Rebate Fund.
Hence the cost of transferable funds to the banking system in the case of export credits is
R,,x -- (CffFx).
The banks add to this cost their commission. As before, the export credit is exempt from the transactions tax and stamp duty. There was a contribution to the "Interest Differential Rebate Fund", after 1985 to the "Resource Utilization Support Fund". The bank extending the export credit receives rebate from the "Interest Differential Rebate Fund". Taking into consideration the blocked accounts, we end up following similar procedures as in the previous two sections with the interest costs when funds for export credits are channeled through commercial bank sources.
The subsidy concept we analyze in this study measures subsidies from the exporter's point of view by considering the alternative of borrowing on the private financial market. Letting Rrt be the annual rate of interest charged on credits obtained from commercial banks at month t of year T, rrt the annual rate of interest the exporter has to pay on the export credit obtained during the month t of the year T, V~t the amount of credit extended to sector i during the month t of year T, zr,i the duration of the credit obtained during the month t of year T for sector i and measured in terms of days, and w i the average turn- over rate of credits in sector i, then the amount of subsidy provided by the relevant credit can be determined following Bauman and Braga [1988] as
SiTt = W i V~t [(1 + R r t - rTt) (z~/360) - - 1].
Thus, the amount of subsidy provided by export credits to sector i is given by:
= X
!
In the calculations of sectoral subsidies provided through export cred- its we first determine the interest differential between the cost of bor- rowing on the private financial market and the interest cost of export credits for the cases when export credits are financed by Central Bank and commercial bank sources, respectively. Then, using the informa- tion on the duration of credits, the average turnover rate of credits, and the amount of credits extended through the Central Bank and
782 W e l t w i r t s c h a f t l i c h e s A r e h i v
commercial bank sources, respectively, we determine the sectoral sub- sidies through the formulas given above. Finally, we divide the sec- toral subsidy figures by sectoral exports and obtain the sectoral sub- sidy rates.
T a x R e b a t e S c h e m e
The tax rebate system introduced in Turkey during the year 1963 can be studied under three headings: (i) normal tax rebate, (ii) addi- tional tax rebate and (iii) advance payments on tax refund on exports.
Originally, the aim of the export tax rebate scheme was to re- imburse exporters for indirect taxes paid at the last and earlier stages of fabrication, and specific tax rebates were paid individually for each exported product. The system was changed to the ad valorem system in 1964. The tax rebate scheme used during the 1980s was based on the Tax Rebate Decree of 1975. With this decree, the commodities for which taxes would be rebated were classified in ten different lists, and the tax rebate rates were specified for each of these lists. The rebate rates were changed every year with the publication of the export regime. In a decree published in 1986, the number of commodity lists were reduced to four, and the rebate rates were specified again. At the end of 1986, a fifth commodity list was added. In a decree published in 1988, the tax rebate rates were to be reduced by 10 percent each month starting April, 1988, and the tax rebate scheme was to be dis- continued at January 1, 1989. The decree of October 1988 specified that the tax rebate scheme would be continued until April 15, 1989, and that the scheme would be discontinued thereafter.
In addition to the tax rebate lists there are tax rebates given to large exporters. During 1981 for exports between $4 and $15 million, the exporter received an additional marginal rebate of 5 percent. If the value of exports exceeded $15 million, the additional tax rebate was 10 percent. The limits and the marginal tax rebate rates indicated above were changed during 1982 and 1986. In 1982, for exports be- tween $ 2 and $10 million the marginal rebate rate was 6 percent, for exports between $10 and $30 million the marginal rate was 12 percent, and for exports in excess of $ 30 million the average addi- tional rebate rate was set at 10 percent. During 1986, the marginal rebate rate for exports between $2 and $10million was set at 2 percent and for exports between $10 and $30 million at 4 percent. The average additional tax rebate rate for exports between $ 30 and $ 50 million was set at 4 percent, and for exports exceeding $ 50 million at 6 percent.
The tax refunds are calculated at the end of the year and thereafter are refunded to the exporter. With the 1987 Budget Law it was agreed that a certain portion of the tax refund should be paid to the exporter in advance. Thus the subsidy was equivalent to a loan with no interest cost granted for the specified period of time. Firms which had realized exports of at least $10 million were entitled to the subsidy. The per- centage of the tax to be refunded was set at 30 percent for exports in the range $ 1 0 - 3 0 million, at 33 percent for exports in the range $ 3 0 - 50 million, at 36 percent for exports in the range $ 50-100 million, and 40 percent for exports exceeding $100 million. The advances to be paid in three installments were to be paid back after 6 months. These amounts would be deducted from the tax refund to be determined in the new year.
In the calculation of the subsidy figure provided through tax re- bates, the rebate rates were obtained from the tax rebate rates given for each commodity list specified in the relevant "Decree on Tax Rebate Rates". Let s l [ aX be the export tax rebate rate of commodity i, s-~x2t~ the average additional tax rebate rate when exports exceed the specified maximum, ct the share of exports by the foreign trade compa- nies in total exports, fl the share of export rebate to be paid as advance payment, R the cost of borrowing funds on the private financial mar- ket, and m the duration of the advance payment extended measured in terms of months. The foreign trade companies are organized to trade in a wide array of goods and services. To gain the status of a foreign trade company, an exporting firm in 1988 had to undertake exports totaling at least $30 million. As a result, such companies benefited from the additional tax rebate rates at their m a x i m u m level. Accordingly, we can determine the gross subsidy rate on commodity i as
i as
s0:ax = sl~aX + , ~ s 2 ~ x + ~fl(sl~ "X + s2~x){(1 tax + R ) ~'/1~ - 1 } ,
where the first term indicates the normal tax rebate rate, the second term the additional tax rebate rate and the third term the subsidy provided through the advance payment of the tax rebate.
Given s0~ aX, the gross subsidy rate in sector j of the Turkish input- output table is calculated as
k t a x = y , i = 1
where sO~ =i denote the gross subsidy rate for commodity i of sector j, X~ export of commodity i of sector j, X~ total exports of sector j, and k the number of commodities in sector j of the input-output table.
784 W e l t w i r t s c h a f t l i e h e s A r c h i v
The subsidy rates were calculated using the export data for the year 1986 provided by the State Institute of Statistics. The data pre- pared according to the six digit BTN classification distinguish between 3067 different commodities. We then used a bridge between the BTN classification of exports and the 49 tradeable sectors of the input-out- put table prepared by the State Institute of Statistics.
P a y m e n t s f r o m t h e S u p p o r t a n d P r i c e S t a b i l i z a t i o n F u n d
In December 1986, a new system of cash incentives for exports was introduced. In general the premium was determined according to each ton of weight. For certain items the premium was determined on the basis of the number of units (eggs, tires), or to square meters (ceramic tiles). Among the goods transmission mechanisms received a premium of $1,000 per ton, cars a premium of $ 550 per ton, and eggs a premium of $ 4 per 1,000 eggs.
In order to determine the subsidy granted through payments from the Support and Price Stabilization F u n d we make use of the follow- ing relation between the US dollar value of exports (X~), the US dollar price of the commodity (p~) and the quantity of exports (x~) measured at the same unit as the premium is paid:
= x , .
Denoting the premium paid in US dollars per unit of quantity of com- modity i by SPSF~, we determine the total payment on commodity i
a s
SPSF~ x, = (SPSFJp~) X~ .
Hence the subsidy rate on commodity i will be
~psf = (SPSF~ xi) / X ~ = (SPSF..,,/p~)
and the subsidy rate in sector j is determined as
k
Z ~P~fi(Xj/Xy),
i = 1
where S; psfi denotes the subsidy rate for commodity i of sector j. The subsidy rates were calculated for each of the four years in the period 1988-91. When calculating the subsidy rates for 1988 we used the six digit export data for the year 1986 provided by the State Institute of Statistics. In 1989, Turkey switched over from the six digit BTN classification of trade data to an eight digit "harmonized system"
classification for exports. Accordingly, the number of commodities increased considerably for the period after 1989. For the period 1989- 91, we use the trade data for the year 1989, which contained 8,252 com- modities. As before, we used a bridge between the eight digit classifica- tion of exports and the 49 tradeable sectors of the input-output table prepared by the State Institute of Statistics.
E x p o r t o f C o m m o d i t i e s S u b j e c t t o t h e P r i c e S t a b i l i z a t i o n S u p p o r t F u n d
In Turkey, agriculture is the only sector where exports are taxed. All other traded sectors receive subsidies. The tax rates on agricultural exports, determined by the Money and Credit Board, are announced according to the value and weight of the goods exported. For certain items, the tax rate is determined on the basis of the number of units (sheep), of value (dried figs) and in general according to each ton of weight. Among the goods, sheep had a tax of $15 per unit during 1986, dried figs $0.25 per unit of $1 exported, and cotton $250 per ton.
In the calculation of the sectoral tax rates, we used the same approach developed for the analysis of subsidies under payments from the Support and Price Stabilization Fund.
D u t y F r e e I m p o r t s o f I n t e r m e d i a t e s
a n d R a w M a t e r i a l s a n d E x e m p t i o n f r o m t h e V a l u e A d d e d T a x
Exporters or manufacturer-exporters may import intermediates and raw materials to be incorporated in products that will be exported either directly by themselves or through subsidiary industries without paying customs duty and other related taxes.
In addition to the above mentioned export incentives, the ex- porters were also exempted from paying the production taxes during the first half of the 1980s. This incentive was granted within the context of exemptions provided in the Expenditure Tax Law. With the intro- duction of the value added tax at the end of 1984, the production tax was abolished and exporters were exempted from paying the value added tax on commodities that will be exported.
To determine the subsidy granted through the scheme, we make use of input-output tables. The balance relation between demand and supply in each sector can be written as
786 W e l t w i r t s c h a f t l i c h e s A r c h i v where B=(b,j) M=(m~ i) x=(x,) y=(y,) E = ( E t ) I M = ( i m ~ )
t=(t,)
the domestic intermediate goods coefficient matrix, where bli denote the a m o u n t of domestic good i required to pro- duce one unit of sector j's output (i,j = 1 , . . . , 64),
the imported intermediate goods coefficient matrix, where m o denote the a m o u n t of imported good i required to produce one unit of sector j's output (i,j = 1, . . . . 64), the output vector, where xi denote the output of sector i (i = 1 .. . . . 64),
the final demand vector, where y~ denote the final demand for commodity i (i = 1 .. . . . 64),
the export vector, where E~ denote the exports of commod- ity i (i = 1 .... ,64),
the import vector, where im~ denote the imports of com- modity i (i = 1 .. . . . 64), and
the vector of gross nominal protection rates where tj de- note the gross nominal protection rate (customs duty, all other related taxes, surcharges including the value added tax rate)
(j=
1, ..., 64),Taking the total differential we obtain dy + dE - d i M = ( I - B - M ) d x ,
where I denotes the identity matrix. Consider an increase in exports given by dE. The associated increase in gross output is obtained when dy = 0 and d i M = M d x as
dx = (I - B)- 1 d E ,
and the associated increase in the imports of intermediates and raw materials as
M dx = M (1 - B)- 1 d E .
Given the vector of gross nominal protection rates t, reported in Togan [1993], the associated increase in import taxes will be
t M d x = t M ( 1 - B) - 1 d E . Considering in the export vector
the vector e as constant, the total amount of imports and related taxes that have to be paid by the exporters for intermediates and production taxes (value added taxes) under no tax exemptions when exporting/~, Turkish liras of exports can be determined as
t M ( I - B ) - l e ~ = t z E .
In order to estimate the sectoral subsidy rates, we choose the ex- port vectors so that dE 1 =(1,0,0 ... 0), dE2 =(0,1,0,0 ... 0) . . . and dE64=(0 ... 0,1) and making use of the relation
u t M ( I - B ) - l d E ~ j = ( 1 , . . . , 6 4 ) ,
where u denotes the unit vector, we obtain the amount of duties the exporter of sector j has to pay when importing the intermediates and raw materials for producing the output of sector j for the purpose of exporting. Since the exporter does not pay the estimated amount of duties it represents the subsidy. In the calculation of the subsidy rates we make use of the 1985 input-output table prepared by the State Institute of Statistics.
F o r e i g n E x c h a n g e A l l o c a t i o n
The "Export Promotion Decree" of 1980 specifies that exporters who hold Export Encouragement Certificates granted by the Office of Incentives and Implementation at the State Planning Organization or a letter of credit can apply for foreign exchange. The exporter to whom a global sum of foreign exchange is allocated has the right to import intermediate and raw materials duty free.
The incentive value of the foreign exchange allocation is twofold. First, the exporter does not pay the duties when importing the inter- mediates and raw materials. The second is related with the fact that foreign exchange generally commands a premium over its official rate. The first type of the subsidy was estimated in the section before. The second type of subsidy is estimated
s{ e = [ ( k s - E) D,]/X,,
where E .r denotes the black market exchange rate, E the official ex- change rate, D~ the amount of foreign exchange allocated to sector j, and X~ the amount of exports of sector j.
788 Weltwirtschaftliches Archiv
E x e m p t i o n f r o m C o r p o r a t i o n T a x
The corporation income tax law has clauses on exemptions con- cerning exports. According to these clauses, a portion of profits made on the export of industrial goods, fresh fruits and vegetables, marine products, as well as the revenues from freight to countries abroad and tourism revenues in foreign exchange, may be deducted from corpora- tion income.
The incentive value of the exemption is calculated using the sym- bols:
// profits before taxes
fraction of the profit not subject to corporation income tax fl corporate tax rate
fai surcharge rate on Defense Industry Fund
f m surcharge rate on Public Relief and Solidarity Fund
f,,at~r surcharge rate on Apprenticeship and Diffusion of Technical and Vocational Training Fund
withholding tax rate.
Consider a firm producing for the domestic market with profits before taxes of H. The after-tax profit is given by the relation:
A = H - f l H - (fa, +f~,,~ +fod,v,) f i l l .
On the other hand, for a firm making H of profits before taxes and exporting X units, the after-tax profits will amount to
B = n - f l [ n - ~ X ] - (fdi + f p , ~ + f,~,v, ) f l i H - o t X ] - y ~ X - f d ~ c t X .
Hence the difference between B and A can be considered as the tax saving of the exporting firm, and thus a subsidy:
S ct = B -- A = ( f l - - y ) c t X + (fp,~ + f , u t v t ) f l o t X + (fl--~,)fd, o t X . Since the tax would be paid during the period 1983-91 in three equal installments during the months of April, July and October, the subsidy from corporation income tax exemption is determined as
S " = (Ea/3)/(1 + R) 3/12 "l- (S'73)/(1 + R) 6/12 -I- (Ea/3)/(1 + R ) 9/12 . O t h e r I n c e n t i v e s
Other incentives consist of (i) premium paid from the Resource Utilization Support Fund, (ii) freight incentive, and (iii) exemption from taxes, duties and fees.
Resource Utilization Support Fund
Towards the end of 1984, the Government established at the Cen- tral Bank the Resource Utilization Support Fund. The objective of the fund was to create additional resources for exports and investments in accordance with the objectives set in Annual Development Plans and Programs.
According to the regulations set in a Communique of 1984, all exports of commodities subject to the Price Stabilization Support F u n d would receive a 2 percent subsidy, and all exports of commodi- ties not subject to the Price Stabilization Support Fund would receive a 4 percent subsidy from the Resource Utilization Support Fund. In a Communique of 1986, the 2 percent rate was reduced to zero per- cent, and the 4 percent rate to 2 percent. Export subsidies from the Resource Utilization Support F u n d were discontinued starting on November 1, 1986.
Incentive to Freight
According to a Communique of the Money and Credit Board in 1986, a subsidy is to be paid for the transport of export products forwarded from Turkish ports to the ports of three groups of countries on the gross ton basis. The payment is in the range of $ 3 - 1 2 per ton of freight transported on ships sailing under the Turkish flag, and $1.5-6 on ships sailing under foreign flags.
In order to determine the incentive value of the subsidy, we con- sider Turkish data for the two digit SITC classification of exports to the three country groups (North Africa, East Coast of America and Far East, West Coast of America and Australia) as reported in the OECD's "Foreign Trade by Commodities" for the year 1986. Let x o be the quantity of commodity i exported to the j-th destination, N} the premium per ton of freight transported on ships under the Turkish flag, Nf the premium per ton of freight transported on ships under foreign flags, and a the share of the tonnage of ships under the Turkish flag in the total tonnage of ships transporting Turkish exports under Turkish and foreign flags. The amount of the subsidy is then deter- mined using the formula
aNf. xij + (1--a) Njf xij.
Exemption from Taxes, Duties and Fees
All procedures related to exporting are exempt from taxes, duties and fees. The procedures include the credits supplied by banks with
790 W e l t w i r t s c h a f t l i c h e s A r e h i v
the proviso that they be used for financing exports, fees charged by banks, insurance companies and public notaries related with the pro- cedures they carry out concerning exports, taxes on bank and insur- ance company procedures and stamp duty. Since these incentive mea- sures have already been considered in the previous section on export credits we refrain in this section from an explicit consideration of the incentive value of this subsidy.
Other Incentives
Finished and semi-finished goods to be imported may be processed and re-exported. Materials supplied locally may be added to the im- ported materials for improving or completing these goods which will be re-exported as finished goods or as semi-finished goods. At this stage, the main contribution would be workmanship. When these goods are brought to the country on a temporary admission basis, they are not charged customs duty, taxes or fees. They are imported against a letter of guarantee. This temporary import regime provides a convenience for exporters of the commodities within the context of the Customs Law. Since these imports are covered in our study within the discussion of duty free imports of intermediates and raw materials and exemption from the value added tax, we refrain in this section from an explicit consideration of the incentive value of this subsidy.
Article 25 of the Export Promotion Decree of December 1, 1986, and article 55 of the Export Promotion Communique of 1986 specify the terms of a new incentive measure, called the Housing Fund Ex- emption. According to the import regime, the importers have to pay $ 3 per metric ton during the transportation of commodities with BTN numbers 27.09, 27.10, 27.11, 27.12, 27.13, and 27.14 to third countries on Turkish highways. The importers could be exempted from paying the housing fund provided they obtain the export encouragement certificate from the State Planning Organization.
The final incentive measure to be considered in this study is the incentive provided to exporters by allowing them to retain and utilize abroad foreign exchange earned from exports. The foreign exchange may be utilized by the exporter for covering all the expenditures re- lated to the importation of commodities by the exporter; expenditures for the establishment and maintenance of offices, representatives, branches and partnerships abroad; and payments on the principal and the installments of the foreign exchange credit obtained at home or abroad.
Since it is not possible to obtain reliabe figures for estimating the subsidy provided through the housing fund exemption and the incen- tive by allowing exporters to retain and utilize abroad the foreign ex- change earned from exports, we refrain from an explicit consideration of the incentive value of these two types of subsidies.
II. Interindustry Distribution of Incentives
In order to estimate the nominal subsidy rates in the tradeable sectors of the Turkish economy, we first consider the sum total of sectoral subsidies calculated in the previous section under export cred- its, tax rebate scheme, premium from the Support and Price Stabiliza- tion Fund, duty free imports of intermediates and raw materials and exemption from the value added tax, the Resource Utilization Sup- port Fund, foreign exchange allocations, incentive to freight, and the incentive provided through exemption from corporation tax. We then subtract from this total the tax rates charged through the Support and Price Stabilization Fund. At this point, we note that the subsidy ele- ment conferred by the export tax rebate scheme depends on the actual indirect taxes paid for which the scheme is supposed to compensate. Following Milanovich [1986], we assume that in the year 1980 the tax rebates were merely sufficient to compensate for the actual incurred indirect taxes. The 1980 tax rebate rates are obtained from the World Bank study [1981]. We have to subtract from the above total the in- direct tax rates for the year 1980. All of these calculations have been done and the final results are reported in Table 1.
The table shows the subsidy rates for each of the 49 tradeable sec- tors. From the table it follows that the economy-wide nominal subsidy rate declined over the period from 31.98 percent in 1983 to 13.04 per- cent in 1990. More significantly, recent policies have narrowed the interindustry distribution of nominal subsidy rates. The standard de- viation of nominal subsidy rates declined from 19.76 in 1983 to 8.13 in 1990.
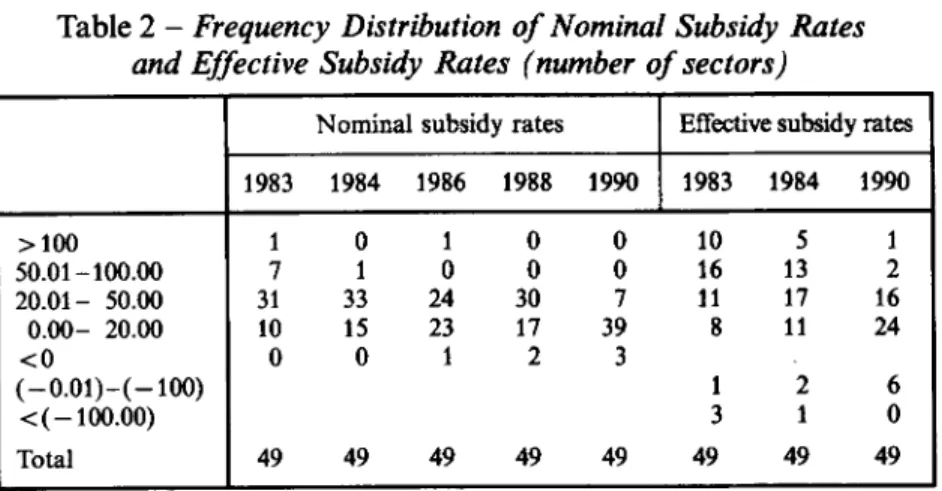
Table 2 presents the frequency distribution of the nominal subsidy rates. The most striking conclusion to be derived from this table re- lates to the height of subsidies in Turkey. From the table we note that among the 49 tradeable goods industries considered, there were 8 industries in 1983, 1 industry in 1984 and 1986, and no industries in 1988 and 1990, which had a nominal subsidy rate higher than 50 per- cent. Additionally, there were 10 industries in 1983, 15 in 1984, 23 in 1986, 17 in 1988 and 39 industries in 1990 which had a non-negative
792 W e l t w i r t s c h a f t l i c h e s A r c h i v %a I i) .ID o ~ . ~~ ~o F . .~ ~~ ~ o _ ~ ~ ~ ~ ~ - ~ 0% 0 ~ " - 1 -- I g ..= r o ~ -- I I I i ~- e~(',l ~ - . 0 ~ i ' % l ~ i ' ~ l ~ ' l ~ ' ~ I "ll r r e ~ ~ 0 . ~ 0 ~ 0 ~ 0 0 ~ r" ~ ' , ~ ~ " ' ~ . . ~ 0 8
.5 o ..~ m ~ . ~ ~ . ~ o I I . ~
~
~
'
~
~,~ " ~
"~
~ 9 I ' ~ ~ 1 ~- I ~ 1 ~ ~,,~t~ 9 =- = = o - ~o z < " Z ~ ID.=I 0 5 ~ ~ 1 7 6 ~ ~ o o ~ m ~4 0 0794 W e l t w i r t s c h a f t l i c h e s A r c h i v
Table 2 -
Frequency Distribution of Nominal Subsidy Rates
and Effective Subsidy Rates (number of sectors)
> 1 0 0 50.01 - loo.O0 2 0 . 0 1 - 50.00 0 . 0 0 - 20.00 < 0 (-0.01)-(-100) < ( -- 100.00) Total
N o m i n a l subsidy rates Effective subsidy rates
1983 1984 1986 1988 1990 1983 1984 1990 1 0 1 0 0 10 5 1 7 1 0 0 0 16 13 2 31 33 24 30 7 11 17 16 10 15 23 17 39 8 11 24 0 0 1 2 3 49 49 49 49 49 1 2 6 3 1 0 49 49 49
?ource: Own calculations.
nominal subsidy rate less than 20 percent. In 1986, there was one industry, in 1988 two industries and in 1990 three industries with negative subsidy rates.
After having discussed the height of subsidy, we now turn to a more detailed examination of the characteristics of export incentive policies. For this purpose, we will again use Table 1. First, we note that in 1983 the highest subsidy rates were granted to the sectors of fabricated metal products (101.055), printing and publishing (73.364), and paper and paper products (73.226). In the same year, the sectors receiving the lowest subsidies were ginning (3.618), processed tobacco (7.439) and agriculture (7.713). In 1984, the subsidy rates were re- duced over all sectors. The highest reductions in subsidy rates were achieved in fabricated metal products, wood and cork products, wood furniture and fixtures. Comparison of the nominal subsidy rates for 1986 with those for 1984 reveal that subsidy rates were raised in four sectors and were reduced in the remaining 45 sectors. The sectors for which the nominal subsidy rates were increased included leather and fur products, processed tobacco, and ginning. In contrast, the largest reductions in subsidy rates during 1986 were achieved in the sectors of fabricated metal products, clothing and other food processing. Dur- ing the period 1986-88, subsidy rates increased in 27 sectors and decreased in 22 sectors. The sectors for which the subsidy rates in- creased during the period included the grain mill products, agricul- ture, and iron and steel industries. The sectors for which subsidy rates decreased included leather and fur products, ginning and stone quary-
ing industries. D u r i n g the p e r i o d 1 9 8 8 - 9 0 , subsidy rates increased in 4 a n d decreased in 45 industries. T h e sectors f o r w h i c h subsidy rates increased included ginning, o t h e r f o o d processing a n d p r o c e s s e d to- b a c c o sectors. T h e sectors f o r which subsidy rates decreased included m o t o r vehicles, o t h e r t r a n s p o r t e q u i p m e n t , a n d grain mill p r o d u c t s . By 1990, the highest subsidy rates were p a i d to i r o n a n d steel (37.657), p a p e r a n d p a p e r p r o d u c t s (31.61), a n d p e t r o l e u m refinery (28.329). O n the o t h e r h a n d , the sectors o f o t h e r t r a n s p o r t e q u i p m e n t ( - 4 . 0 0 8 ) , shipbuilding a n d repairing ( - 2 . 2 0 8 ) a n d f o r e s t r y ( - 0 . 4 9 2 ) received the lowest subsidy rates.
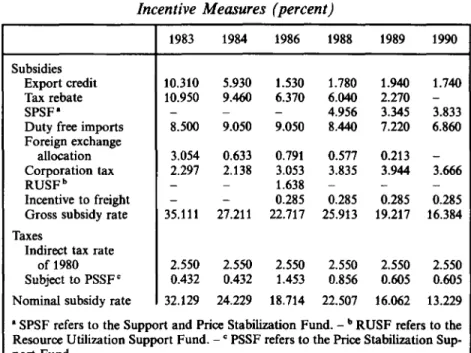
So far we have e x a m i n e d the s t r u c t u r e o f subsidies at the aggregate i n d u s t r y level w i t h o u t going into details r e g a r d i n g the i m p o r t a n c e o f v a r i o u s incentive measures. Table 3 presents d a t a o n the v a r i o u s in- centive measures. F r o m Table 3 it follows t h a t in 1983 the m o s t im- p o r t a n t incentive m e a s u r e was the tax r e b a t e scheme. A f t e r 1986, the possibility o f i m p o r t i n g g o o d s e x e m p t f r o m c u s t o m s d u t y against e x p o r t s b e c a m e the m o s t i m p o r t a n t incentive measure.
Table 3 -
Economy-wide Subsidy Rates Provided Through Different
Incentive Measures (percent,)
Subsidies Export credit Tax rebate SPSF 9
Duty free imports Foreign exchange
allocation Corporation tax RUSF ~
Incentive to freight Gross subsidy rate Taxes
Indirect tax rate of 1980 Subject to PSSF ~ Nominal subsidy rate
1983 1984 1986 1988 1989 1990 10.310 5 . 9 3 0 1 . 5 3 0 1 . 7 8 0 1 . 9 4 0 1.740 10.950 9 . 4 6 0 6 . 3 7 0 6 . 0 4 0 2.270 - - - - 4.956 3 . 3 4 5 3.833 8.500 9 . 0 5 0 9 . 0 5 0 8 . 4 4 0 7 . 2 2 0 6.860 3.054 0 . 6 3 3 0 . 7 9 1 0 . 5 7 7 0.213 - 2.297 2 . 1 3 8 3 . 0 5 3 3 . 8 3 5 3 . 9 4 4 3.666 - - 1.638 - - - - - 0.285 0.285 0.285 0.285 35.111 27.211 22.717 25.913 19.217 16.384 2.550 2.550 2.550 2.550 2.550 2.550 0.432 0.432 1.453 0.856 0.605 0.605 32.129 24.229 18.714 22.507 16.062 13.229
"SPSF refers to the Support and Price Stabilization Fund. - b RUSF refers to the Resource Utilization Support Fund. - c PSSF refers to the Price Stabilization Sup- port Fund.
796 Weltwirtschaftliches A r c h i v
Table 4 presents nominal subsidy rates for broad industry groups. In the upper part of the table, industries were classified into nine industry groups, and in the lower part into four trade categories.
Calculations presented in the first part of Table 4 reveal significant characteristics within the subsidy system. There is a marked tendency for subsidy rates to escalate from lower to higher stages of fabrication. In general, the subsidy rates are lowest for primary activities, followed by mining and energy, and highest on manufacturing. For instance, in 1984 the nominal subsidy rate was 8.31 percent for primary activities, 15.43 percent on mining and energy, and 31.64 percent on manufac- turing.
The escalation of subsidy rates is also evident among the subsec- tors of manufacturing, within which the lowest subsidy rates apply to consumer goods. Higher rates were applied during the 1980s to invest- ment goods and in 1990 to intermediate goods.
The second part of Table 4 reveals that throughout the 1980s the subsidy rates on export industries were lower than those on export- and import-competing industries, which in turn received the highest subsidy rates among the four trade categories.
Nominal subsidy is concerned with the impact of incentives on product prices. Effective subsidy is concerned with the impact of in- centives on production activities taking into account incentives to out- puts and tariff and tariff-like charges to the intermediate inputs of these activities. Let VA be the value added in domestic prices inclusive of the net value of all subsidies on the final output, and VA w the value added world prices, or what the processing would be in the absence of any tariffs or other interventions affecting the price of the final prod- uct and the cost of its intermediate inputs, then the effective subsidy rate is determined by the relation:
E S R = (VA - VAw) 100
VAw
Calculations of the E S R for 1983 and 1990 in Table 4 reveal that the average E S R for the economy as a whole decreased from 37.52 in 1983 to 12.25 in 1990. Furthermore, the interindustry distribution of effec- tive subsidy rates narrowed during the period. The standard deviation of effective subsidy rates declined from 115.861 in 1983 to 22.513 in 1990.
Consideration of the frequency distribution of effective subsidy rates reveal that among the 49 tradeable sectors considered there were
T a b l e 4 -
Subsidy Rates by Major Commodity Groups
and Trade Categories (percent)
Primary activities" Mining & energy b Manufacturing Consumer goods Processed food c Beverages & tobacco d Non-durable
& durable con- sumer goods 9 Intermediate goods f Investment goods Machinery g Transport equipment h Other manufac- turing industries Export industries j Export- and import-
competing industries ~ Import-competing
industries Non-import corn-
Nominal subsidy rates
1983 1984 1986 1988 1990 1983 1984
Effective subsidy rates
1990 Commodity groups 8.62 8.31 5.29 16.54 4.86 6.38 5.62 2.55 18.06 15.43 13.78 12.16 9.71 17.63 14.10 8.64 43.11 31.64 24.65 57.76 16.87 77.80 63.75 23.26 30.08 22.05 12.57 13.60 9.42 19.58 71.91 23.79 26.24 19.84 11.14 13.85 9.13 - 8 . 1 6 91.48 23.91 15.01 8.40 13.92 14.69 11.63 - 4 . 3 5 12.59 24.65 38.99 28.16 14.52 12.99 9.44 130.46 89.86 22.36 45.66 34.74 31.44 31.46 22.62 87.85 53.28 26.01 61.22 40.63 25.79 31.00 12.68 147.01 84.04 13.98 69.03 43.40 27.21 30.08 15.83 175.41 96.75 22.92 38.27 32.47 21.61 33.71 3.41 59.38 4 4 . 7 9 - - 1 3 . 6 0 41.00 32.85 34.37 30.60 12.15 63.48 62.07 15.18 Trade categories 38.97 26.15 16.21 11.38 7.95 23.91 55.02 14.30 46.16 36.62 28.53 33.77 23.20 87.39 62.04 37.20 37.37 25.11 19.88 22.91 12.27 46.21 27.54 11.25 petingindustries m 24.46 19.78 16.13 23.11 12.09 30.74 20.72 7.89 "Includes sectors No. 1 - 4 . - b Includes sectors No. 5 - 1 0 . - c Includes sectors No. 11-16. - a Includes sectors No. 1 7 - 1 9 . - "Includes sectors No. 21, 22, 24 and 26. - f Includes sectors No. 20, 23, 25 a n d 2 7 - 4 0 . - ' Includes sectors No. 4 1 - 4 4 . _ h Includes sectors No. 4 5 - 4 8 . - i Inchides sector No. 49. - J Includes sectors No. 12, 1 6 - 2 3 , 36 and 41. - ~ Includes sectors No. 8 - 9 , 29, 31, 3 9 - 4 0 , 4 2 - 4 3 and 49. - i Includes sectors No. 3, 5, 6 - 7 , 10, 13, 27, 30 and 4 4 - 4 8 . - ~ Includes sectors No. 1 - 2 , 4, 11, 1 4 - 1 5 , 2 4 - 2 6 , 28, 3 2 - 3 5 and 37--38.
798 Weltwirtschaftliches Archiv
10 (1) industries in 1983 (1990) which had an effective subsidy rate higher than 100 percent. There were 16 (2) industries in 1983 (1990) with effective subsidy rates between 100 and 50 percent. 11 (16) indus- tries had effective subsidy rates within the range of 20- 50, and 8 (24) industries in the range of 0-20. In 1983 (1990), there was 1 (6) indus- try with negative effective subsidy rates with values greater than
- 100, and there were 3 (0) industries with effective subsidy rates less
than - 100.
In 1983, the sectors with the highest effective subsidy rates were fabricated metal products (305.249), leather and fur products (254.957) and wood products (227.758) industries. The sectors with the lowest effective subsidy rates were fruits and vegetables (-504.476), other food processing (-220.038) and plastic products (-127.377). In 1990, the sectors with the highest effective subsidy rates included the grain mill product (109.344), iron and steel (87.471) and agricultural machinery (33.977) industries. The sectors with the lowest effective subsidy rates were motor vehicles (-14.501), other food processing (-14.1), and railroad equipment (-11.224).
During the period 1983-84, effective subsidy rates increased in 4 and decreased in 45 industries. The largest increase in effective subsidy rates occurred in the sectors of fruits and vegetables, plastic products and processed tobacco. The largest decreases in effective subsidy rates were achieved in the fabricated metal products, wood products, and paper and paper products industries. During the 1984-90 period, effective subsidy rates increased in 8 and decreased in 41 industries. The largest increase in effective subsidy rates were achieved in the sectors of other food processing, plastic products, and grain mill products. Effective subsidy rates decreased in fruits and vegetables, leather and fur products, and fabricated metal products industries.
Table 4 presents the effective subsidy rates for the broad industry groups. From the table we note that effective subsidy rates escalate from lower to higher stages of fabrication. The effective subsidy rates are lowest for primary activities, followed by mining and energy, and highest on manufacturing. In 1983 (1990), the effective subsidy rate was 6.38 (2.55) percent for primary activities, 17.63 (8.64) percent on mining and energy, and 77.80 (23.26) percent on manufacturing. The second part of Table 4 reveals that in 1983 (1990) the highest effective subsidy rates applied to export- and import-competing industries, as in the case of nominal subsidy rates.
III. Conclusion
This paper has analyzed the changes in the structure of export incentives in Turkey from 1983 to 1990. It has been shown that during the 1980s the level of the economy-wide subsidy rates and that of the interindustry dispersion of incentives have substantially been lowered. Using the estimates of the effective subsidy figures it was shown that the Turkish export- and import-competing industries have benefited from the export incentives more than the other sectors. Finally, it is emphasized that the system of export incentives has been and still is too complicated and is therefore blurring the transparency of the incentive system. A simplification of the system would be highly use- ful. Such an attempt should consider that frequent alterations in the nominal subsidy rates cause uncertainty to exporters and industrial firms thereby creating unnecessary difficulties in planning for future production.
References
Bauman, Renato, Helson C. Braga, "Export Financing in LDCs: The Role of Subsidies
for Export Performance in Brazil". Worm Development, Vol. 16, 1988, pp. 821-833.
Ersel, Hasan, (;riven Snk, Public Borrowing and the Development of Financial Markets
in Turkey. Capital Market Board, Research Report. Ankara, 1988.
Milanovieh, Branko, Export Incentives and Turkish Manufactured Exports, 1980-1984.
World Bank Staff Working Papers, No. 768. Washington, D.C., 1986.
Togan, Subidey, Foreign Trade Regime and Trade Liberalization in Turkey during the
1980s. Turkish Eximbank Publication. Ankara, 1993 (in Turkish).
World Bank, Turkey: Industrialization and Trade Strategy. Washington, D.C., 1981.
A b s t r a c t : How to Assess the Significance of Export Incentives: An Application to Turkey. - This paper analyzes the changes in the structure of export incentives in Turkey from 1983 to 1990. It shows that during the 1980s the level of the economy-wide subsidy rates and that of the inter-industry dispersion of incentives have substantially been lowered. Using the estimates of the effective subsidy figures it is shown that the Turkish export- and import-competing industries have benefited from the export incen- tives more than the other sectors. Finally, it is emphasized that the system of export incentives is too complicated and is therefore blurring the transparency of the incentive system.
8 0 0 W e l t w i r t s c h a f t l i e h e s A r c h i v
Z u s a m m e n f a s s u n g: Zur Sch~tzung der Bedeutung von Exportanreizen. Der Fall Tfirkei. - Der Autor untersucht die Ver~inderungen in der Struktur der Exportan- reize in der Tfirkei yon 1983 bis 1990. Er zeigt, dab ira Laufe der achtizger Jahre das Niveau der landesweiten Subventionsraten und tier interindustriellen Streuung der Subventionen betr~ichtlich gesenkt worden ist. Unter Verwendung von Sch,~tzungen tier effektiven Subvention kommt er zu dem Ergebnis, dab die mit den Exporten mad Importen konkurrierenden tiirkischen Firmen aus den Exportanreizen einen gr6Beren Nutzen gezogen haben als die anderen Sektoren. SchlieBlich hebt er hervor, dab das System der Exportanreize zu kompliziert ist und dadurch die Transparenz des Anreizsy- stems beeintr~chtigt.