Süleyman Demirel University Journal of Natural and Applied Sciences Volume 21, Issue 2, 332-337, 2017 Süleyman Demirel Üniversitesi
Fen Bilimleri Enstitüsü Dergisi Cilt 21, Sayı 2, 332-337, 2017
DOI: 10.19113/sdufbed.67183
Development of UV-Vis Spectrophotometric Method for Rapid Nickel Determination in
Original Oil Matrix
Feyzullah TOKAY*1,2
1Balıkesir Üniversitesi, Fen Edebiyat Fakültesi, Kimya Bölümü, 10145, Balıkesir 2Balıkesir Üniversitesi, Bilim ve Teknoloji Uygulama ve Araştırma Merkezi, 10145, Balıkesir
(Alınış / Received: 21.01.2017, Kabul / Accepted: 17.04.2017, Online Yayınlanma / Published Online: 25.04.2017) Keywords
Edible oils,
Nickel determination, UV-Vis spectrophotometry,
Abstract: A novel method for the determination of nickel in edible oils was proposed. The suggested procedure was on the basis of complexation of N, N’-bis(4-methoxysalicylidene) ethylenediamine and nickel in oily media and UV-Visible spectrophotometric determination at 396 nm. The complex formation was completed within 20 seconds. The mixture of n-hexane and acetone (1:4, v/v) was used as solvent and the molar absorptivity of the complex was calculated as 6540 L mol-1 cm-1.The limits of detection and quantification were
0.24 and 0.82 µg g-1, respectively. The calibration graph was linear between
0.25-1.50 mg L-1 nickel concentration with 0.9995 correlation coefficient. The
reliability of the suggested method was tested by analysis of organometallic nickel standard and the recovery and relative standard deviation were found as 97.0 % and 3.8 %, respectively. Furthermore, the developed method was successfully applied on nickel spiked real samples and recovery values were between 90.0 - 104.0 %.
Orijinal Yağ Matriksinde Hızlı Nikel Tayini için UV-Vis Spektrofotometrik Metot
Geliştirilmesi
Anahtar Kelimeler Yenilebilir yağlar, Nikel tayini,
UV-Vis spektrofotometri
Özet: Bu çalışmada, yenilebilir yağlarda nikel tayini için yeni bir metot sunulmuştur. Önerilen prosedür, N, N’-bis(4-metoksisalisiliden) etilendiamin ve nikelin yağ ortamında kompleksleşmesi ve 396 nm’de UV-görünür bölgede spektrofotometrik tayinine dayanmaktadır. Kompleks oluşumu 20 saniyede tamamlanmaktadır. n-Hekzan ve aseton karışımı (1:4, h/h) çözücü olarak kullanılmış ve kompleksin molar absorpsiyon katsayısı 6540 L mol-1 cm-1
olarak hesaplanmıştır. Tayin ve gözlenebilme sınırları sırasıyla 0,24 ve 0,82 µg g-1 olarak bulunmuştır. Kalibrasyon grafiği 0,25-1,50 mg L-1 nikel derişimi
aralığında doğrusaldır ve korelasyon katsayısı 0,9995’dir. Önerilen yöntemin gerçekliği organometalik nikel standardı kullanılarak test edilmiş; % geri kazanım ve % bağıl standart sapma değerleri sırasıyla % 97,0 ve % 3,8 olarak bulunmuştur. Ayrıca, geliştirilen yöntem nikel katılmış gerçek örneklerde de başarıyla uygulanmış ve % geri kazanım değerleri %90,0 -104,0 aralığında bulunmuştur.
1. Introduction
Nickel (Ni) is an essential element for the activation of urease enzyme and have important role in biological systems. Additionally, Ni has potential harmful effects on health. Exposure to Ni can cause eczema and some allergic reactions on skin. Furthermore, compounds of this element may be carcinogenic. Considering the mentioned effects,
accurate and precise determination of this element becomes significant [1-2].
The vegetable oils are obtained from plants, seeds, nuts and fruits by pressing, centrifugation, or solvent extraction. Oils are the main source of calories, fat-soluble vitamins, antioxidants and energy. The vegetable oils have been produced for centuries and the quality of oils is verified by various parameters including acidity, concentration of peroxides, fatty acid composition and iodine value. Additionally, the
quality of the vegetable oil is strongly depend on the concentration of trace elements. Ni and the other metals including Fe, Cu, Co, Zn and Pb can be introduced to the oil matrix during growth of plant (from soil, fertilizers, insecticides, etc.) or oil production process. Beside the toxic nature of some of trace metals, they may promote oxidation reactions and form toxic compounds such as aldehydes, ketones, peroxides, epoxides and other carcinogenic compounds which may cause pathological effects in human body. Consequently, many undesirable results such as discoloration, rancidity, degradation of nutrients and turbidity may occur in edible oils [3-4].
Depending on the significant effects of elements on oil quality, metal determination studies received great attention in food analysis. Various sample pretreatment techniques for oil matrix and element detection techniques exist in literature. Open vessel wet digestion, dry ashing, microwave-assisted digestion, acid or chelating agent extraction, dilution with organic solvent and emulsification were some of the sample preparation strategies for element analysis in edible oils [5-9].
The wet digestion and dry ashing strategies were the oldest oil decomposition techniques. Unfortunately, element losses and contamination may occur during decomposition process. In general, reproducibility of the results are not satisfactory and the blank values are high [10]. The microwave (MW) assisted digestion is a promising mineralization technique. The MW assisted decomposition shortens the sample pretreatment step. However, expensive instrumentation, risk of vessel explosion and dilution of the oil sample are the disadvantages of the technique [8, 11]. The extraction of elements via chelating agent is a recently popular sample preparation technique for edible oils. Briefly, aqueous phase including chelating agent is mixed with oil sample and the blend is mechanically stirred to transfer trace elements from oil phase to aqueous phase. Despite being an environmentally friendly, this non-destructive technique is time consuming [12-14].
Considering the laborious, outlasting, overpriced and risky sample preparation procedures, it is aimed to develop a basic, miniaturized, cost effective and free of hazard sample preparation and determination method for nickel in edible oil samples. Within this scope, nickel and a Schiff base called N,N’-bis(4-methoxysalicylidene) ethylenediamine were chelated in oily media and amount of nickel was determined using UV-Vis spectrophotometry. For the first time, a new method based on complexation strategy coupled with UV-Vis spectrophotometric determination for nickel in original oil sample without any sample preparation such as digestion, extraction etc. has been reported. The proposed methodology was successfully applied on corn, canola, olive, sunflower, hazelnut and soy oil for nickel determination.
2. Material and Method 2.1. Reagents
The chemicals used were of analytical grade and no further purification was required. Acetone and n-hexane were obtained from Merck (Darmstadt, Germany). To overcome turbidity and obtain clear solutions, mixture of n-hexane-acetone (1:4) was used for dissolution and/or dilution of chelating agent and real samples as solvent in experiments as described previously [15]. The chelating agent, N,N’-bis(4-methoxysalicylidene) ethylenediamine (MSE), was prepared by condensation reaction of ethylene diamine and 4-methoxysalicylidene as described previously [16]. A 5,000 mg kg-1 organometallic
nickel standard was purchased from Conostan (Quebec, Canada). Working solutions of nickel was prepared daily with solvent mixture as required. 2.2. Preparation of chelating agent solution and real samples
The stock chelating agent solution was prepared by dissolution of 8.2 mg MSE in 25.0 mL flask in solvent mixture as 1.0 mmol L-1. Subsequently, 2.5 mL of this
solution was pipetted and diluted with solvent mixture 10 times to obtain working solution of MSE (100.0 µmol L-1).
Six type of refined edible oils including corn, canola, olive, sunflower, hazelnut and soy oil were commercially purchased from local Turkish markets. The samples were stored in dark at room temperature until analysis. Two grams of oil sample was accurately weighed and diluted to 25.0 mL with solvent mixture and used as sample solution for analysis.
2.3. Instruments
Recording the spectra and the absorbance measurements were made by PG Instruments T80+ double beam UV-Vis spectrophotometer (Leicestershire, UK) using a couple of 1-cm optical path length quartz cuvette. The spectrophotometer was fitted with tungsten lamp as the source and deuterium lamp as the background corrector. A Heidolph MR 3001 K model magnetic stirrer was utilized for homogenization of the solutions. The weighing of the samples were carried out with Sartorius TE214S analytical balance. The accurate volumes were delivered with Eppendorf micropipettes.
2.4. Analytical procedure
Nickel content of oil samples were determined by standard addition method as described previously [15]. This quantitative analysis approach was preferred to eliminate oil sample matrix contribution to the analytical signal. Accordingly, 2.0 mL of oil
solution, standard nickel solution and 1.0 mL of chelating agent solution was transferred into volumetric flask and diluted up to 5.0 mL. The blend of the reagents were mixed well and waited for 20 seconds. Then, a portion of the solution was filled in quartz cuvette and absorbance measurement was achieved at 396 nm against to reagent blank. The reagent blank was prepared similar to standards without chelating agent. The nickel concentrations of the sample solutions were found by standard addition calibration graph. The assays were performed at room temperature and under atmospheric pressure. All the experiments were duplicated at least three times to guarantee reproducibility.
3. Results
Different parameters such as wavelength, reaction time, Beer’s law validity range and effect of matrix ions were studied. Additionally, detection and quantification limits, accuracy and precision of the method were determined. The previously obtained and reported data about stoichiometry of the Ni-MSE complex as 1:1 and complex formation constant as 2.7(±0.4)x104 found valuable for the continuation of
this work [17].
3.1. Spectral characteristics of Ni-MSE complex According to analytical procedure, 50.0 µmol L-1 of
MSE and nickel were mixed and allowed to react forming Ni-MSE in n-hexane-acetone medium. The absorption spectra of nickel, MSE and Ni-MSE were recorded in the range of 200-900 nm with 0.5 nm intervals and depicted in Figure 1. The yellowish green complex gave clearly two absorption maxima in the visible region. According to the figure, maximum absorbance value of Ni-MSE was obtained at 327 nm. However, the absorbance of non-complexed MSE cannot be neglected at this wavelength. Therefore, the second maximum of the spectrum at 396 nm was investigated. At this wavelength, absorbance value of non-complexed MSE could be disregarded. Additionally, free nickel had no absorbance at this wavelength. So, 396 nm wavelength was used throughout the spectral studies.
Figure 1. UV-Vis spectra of Ni, MSE and Ni-MSE (Concentration: 50.0 µmol L-1)
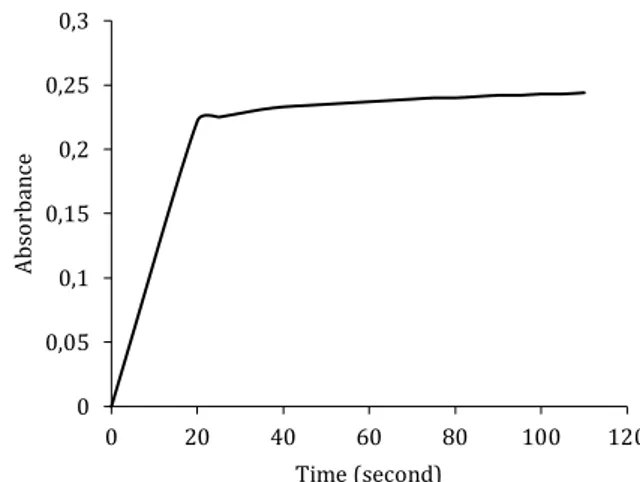
3.2. Kinetic study
Complexation of nickel and MSE is an equilibrium reaction and investigation of the time required for the completion of complexation is important to obtain maximum absorbance and reproducible results. Kinetic study was conducted to find out the required time for complexation and stability of the complex. Consequently, standard nickel and MSE concentration were mixed in 50.0 µmol L-1
concentration and absorbance of the complex was monitored during 25 minutes with 1 second intervals. Measurement of the absorbance showed that Ni-MSE complex was stable during 25 min. The absorbance values were plotted against time and visualized in Figure 2. It is seen that complexation reaction was reached equilibrium in 20 seconds. This means that nickel levels can be expeditiously determined in oil matrix. In view of literature reports on metal determination in oil samples which need longer extraction or digestion time [7, 10], analysis can be completed in very short period with this method.
Figure 2. Required time for complexation 3.3. Order of reagent additions
All the experiments were carried out by adding the reagents in same order in all sequences. Accordingly, the substances were mixed in following order; oil sample, nickel standard and MSE solution. However, the studies showed that, alteration in the order of reagents did not cause significant difference in absorbance.
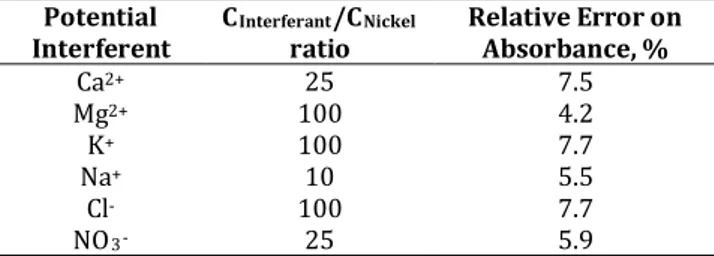
3.4. Influences of coexisting species
The selectivity of the proposed method was tested with various ions that are naturally found in edible oil matrix. In this purpose, increasing quantities of different amount of typically interfering ions such as Ca2+, Mg2+, K+, Na+, Cl- and NO3- were added to 50.0
µmol L-1 nickel and analyzed according to the
suggested procedure. Tolerable limits of coexisting ions were defined as concentration of the ion causing a relative error ≤10% on absorbance value. The
0 0,2 0,4 0,6 0,8 1 1,2 300 350 400 450 500 Abs or ba nc e Wavelenght (nm) MSE Ni-MSE Ni 0 0,05 0,1 0,15 0,2 0,25 0,3 0 20 40 60 80 100 120 Abs or ba nc e Time (second)
results were summarized in Table 1. The obtained data showed that the aforecited ions have no obvious interfering effect on nickel determination. Moreover, this technique overcomes the effect of natural oil matrix.
Table 1. Effect of interfering ions on the complexation of Ni and MSE
Potential
Interferent CInterferantratio /CNickel Relative Error on Absorbance, %
Ca2+ 25 7.5 Mg2+ 100 4.2 K+ 100 7.7 Na+ 10 5.5 Cl- 100 7.7 NO3- 25 5.9 3.5. Analytical data
Molar absorption coefficient (ε) of the Ni-MSE complex was calculated as 6540 L mol-1 cm-1 by the
equation of Lambert Beer’s law given below.
A = εbC (1)
Where A was absorbance value of complex measured at 396 nm; ε was molar absorptivity (L mol-1 cm-1); b
was optical path length (cm) and C was the concentration of analyte (mol L-1). The calibration
graph was fitted between 0.25-1.50 mg L-1 nickel
concentrations with 0.9995 correlation coefficient. A standard addition calibration graph which was prepared with organometallic standard nickel solutions was depicted in Table 3.
Figure 3. Calibration graph for Ni determination
The precision and accuracy of the proposed procedure were tested with 5 replicate analysis of standard nickel solutions. According to the results, recovery and relative standard deviation (RSD) values were found as 97.0 % and 3.8 %, respectively. The levels of recovery and RSD values were found suitable for routine laboratory analysis. Limit of detection (LOD) and the limit of quantification (LOQ) were calculated by 10 blank solutions analysis results with the equation 𝑘𝑘 𝑠𝑠𝑏𝑏⁄ , where k is numerical factor 𝑚𝑚
(3 for LOD and 10 for LOQ), sb is standard deviation
of the blank signal and m is the slope of the
calibration graph. LOD and LOQ values were found as 0.24 µg g-1 and 0.82 µg g-1, respectively.
3.6. Sample analysis
The suggested procedure was applied to some edible oils samples including corn, canola, olive, sunflower, hazelnut and soy oil. In detail, raw and standard nickel spiked samples were analyzed and the data were summarized in Table 2. The spiked levels of nickel in real samples were determined accurately. The recoveries were in the acceptable range of 90-104 % for the nickel spiked oil samples. Additionally, accuracy was evaluated by comparison the theoretical values and experimental results of spiked samples by student t-test. The experimental t values were varied between 0.38 – 2.83 and lower than the critical t value (tcritical = 4.30). So, there was no
significant difference between theoretical value and experimental result at 95 % confidence level.
Table 2. Results for real sample analysis (n=3) Oil
Sample (mg/kg) Added (mg/kg) Found Recovery, % texperimental Sunflower 0.00 1.00 0.97±0.06 <LOD 97 - 0.71 - Olive 0.00 1.00 3.42±0.04 4.38±0.15 96 - 0.71 - Soybean 0.00 1.00 3.59±0.29 4.64±0.44 104 - 0.38 - Canola 0.00 1.00 0.94±0.03 <LOD 94 - 2.02 - Hazelnut 0.00 1.00 0.90±0.07 <LOD 90 - 1.62 - Corn 0.00 1.00 0.92±0.07 <LOD 92 - 2.83 -
4. Discussion and Conclusion
The suggested procedure based on complexation of nickel with a tetradentate Schiff base in oily media prior to UV-Vis spectrophotometric determination was demonstrated to be a reliable strategy for edible oil analysis. The proposed method had more advantages of being rapid and simpler without expensive apparatus over the published atomic spectroscopy methods for the determination of nickel in edible oil samples.
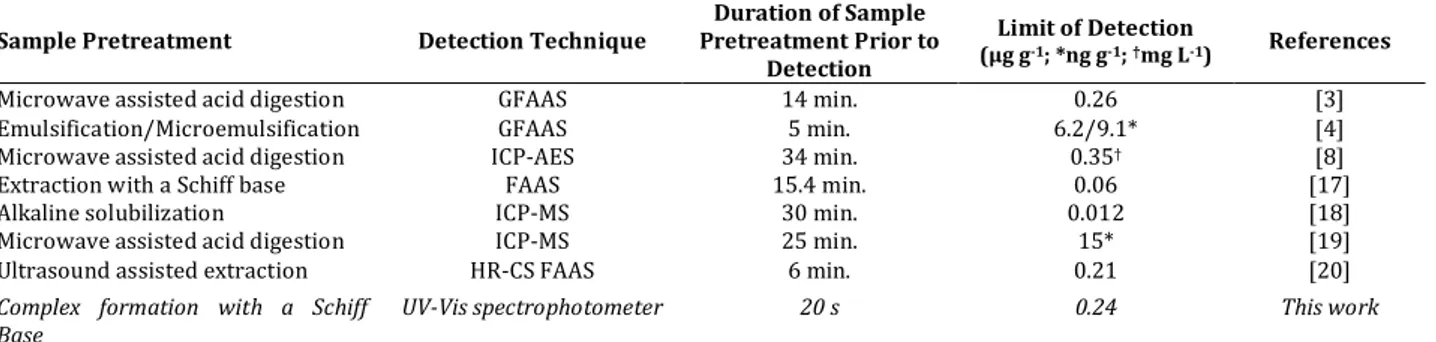
The developed nickel determination method was compared to other reported methods by sample pretreatment type, detection technique, duration of sample pretreatment and limits of detection in Table 3. According to the table, sample pretreatment step can be completed within the shortest time with proposed method. Furthermore, considering the techniques including graphite furnace atomic absorption spectrometry (GFAAS), inductively coupled optical mass spectrometry (ICP-MS), inductively coupled optical atomic emission spectrometry (ICP-AES), high resolution continuum source flame atomic absorption spectrometry (HR-CS FAAS), determination of the analyte can be achieved
y = 0,1027x + 0,1023 R² = 0,9995 0 0,05 0,1 0,15 0,2 0,25 0,3 0 0,25 0,5 0,75 1 1,25 1,5 Abs or ba nc e Concentration of Ni (mg L-1)
Table 3. Comparison of some properties of the suggested method with literature
Sample Pretreatment Detection Technique Pretreatment Prior to Duration of Sample Detection
Limit of Detection
(µg g-1; *ng g-1; †mg L-1) References
Microwave assisted acid digestion GFAAS 14 min. 0.26 [3]
Emulsification/Microemulsification GFAAS 5 min. 6.2/9.1* [4]
Microwave assisted acid digestion ICP-AES 34 min. 0.35† [8]
Extraction with a Schiff base FAAS 15.4 min. 0.06 [17]
Alkaline solubilization ICP-MS 30 min. 0.012 [18]
Microwave assisted acid digestion ICP-MS 25 min. 15* [19]
Ultrasound assisted extraction HR-CS FAAS 6 min. 0.21 [20]
Complex formation with a Schiff
Base UV-Vis spectrophotometer 20 s 0.24 This work
cheaper by this analytical procedure. The sensitivity of the suggested method can be found worse than some of the reports [4, 17, 18, 19]. However, considering dilution of the sample, time consuming sample preparation step and high cost instrument requirement in these procedures, the presented method comes to the forefront. Additionally, the LOD value of the recommended method is similar or better than the methods that were carried out with GFAAS, HR-CS FAAS and ICP-AES techniques [3, 8, 20]. Consequently, the presented technique is the basic and accessible among the compared instruments for nickel determination in edible oil samples.
The developed method avoids the usage of large volume of oxidizing reagents and time consuming experiments. The procedure was successfully applied on corn, canola, olive, sunflower, hazelnut and soy oil samples for nickel determination. The statistically indicated data shows that the method is rapid, simple, cheap and useful for quantification of nickel in edible oil samples.
Acknowledgment
The author wish to express his deep thanks to Dr. Sema BAĞDAT who provided insight and expertise that greatly assisted the research.
References
[1] Mirabi, A., Rad, A. S., Nourani, S. 2015. Application of modified magnetic nanoparticles as a sorbent for preconcentration and determination of nickel ions in food and environmental water samples. Trends in Analytical Chemistry, 74(2015), 146-151.
[2] Peeters, K., Zuliani, T., Zigon, D., Milacic, R., Scancar, J. 2017. Nickel speciation in cocoa infusions using monolithic chromatography – Post-column ID-ICP-MS and Q-TOF-MS. Food Chemistry, 230(2017), 327-335.
[3] Cindric, I. J., Zeiner, M., Steffan, I. 2007. Trace
elemental characterization of edible oils by ICP– AES and GFAAS. Microchemical Journal, 85(2007), 136-139.
[4] Gündüz, S., Akman, S. 2015. Investigation of trace element contents in edible oils sold in Turkey using microemulsion and emulsion procedures by graphite furnace atomic absorption spectrophotometry. LWT- Food Science and Technology, 64(2015), 1329-1333. [5] Robina, N. F., Brum, D. M., Cassella, R. J. 2012.
Application of the extraction induced by emulsion breaking for the determination of chromium and manganese in edible oils by electrothermal atomic absorption spectrometry. Talanta, 99(2012), 104-112.
[6] Anthemidis, A. N., Arvanitidis, V., Stratis, J. A. 2005. On-line emulsion formation and multi-element analysis of edible oils by inductively coupled plasma atomic emission spectrometry. Analytica Chimica Acta, 537(2005), 271-278. [7] Karimi, M., Dadfarnia, S., Shabani, A. M. H.,
Tamaddon, F., Azadi, D. 2015. Deep eutectic liquid organic salt as a new solvent for liquid-phase microextraction and its application in ligandless extraction and pre-concentraion of lead and cadmium in edible oils. Talanta, 144(2015), 648-654.
[8] Zhu, F., Fan, W., Wang, X., Qu, L., Yao, S. 2011. Health risk assessment of eight heavy metals in nine varieties of edible vegetable oils consumed in China. Food and Chemical Toxicology, 49(2011), 3081-3085.
[9] Baran, E. K., Bağdat Yaşar, S. 2010. Copper and Iron Determination with [N,N′-
Bis(salicylidene)-2,2′-dimethyl-1,3-propanediaminato] in Edible Oils Without Digestion. Journal of American Oil Chemists’ Society, 87(2010), 1389-1395.
[10] Lepri, F. G., Chaves, E. S., Vieira, M. A., Ribeiro, A. S., Curtius, A. J., De Oliveira, L. C. C., De Campos, R. C. 2011. Determination of Trace Elements in Vegetable Oils and Biodiesel by Atomic Spectrometric Techniques—A Review. Applied Spectroscopy Reviews, 46(2011), 175-206.
[11] Ni, Z., Tang, F., Liu, Y., Shen, D., Mo, R. 2015. Multielemental Analysis of Camellia Oil by Microwave Dry Ashing and Inductively Coupled
Plasma Mass Spectrometry. Analytical Letters, 48(2015), 1777-1786.
[12] Baran, E. K., Bağdat Yaşar, S. 2012. Zinc and nickel determination in liquid edible oils by FAAS after the extraction. European Journal of Lipid Science and Technology, 114(2012), 1320-1326.
[13] Tokay, F., Bağdat, S. 2015. Determination of Iron and Copper in Edible Oils by Flame Atomic Absorption Spectrometry After Liquid–Liquid Extraction. Journal of American Oil Chemists’ Society, 92(2015), 317-322.
[14] Baran, E. K., Bağdat Yaşar, S. 2013. Spectrometric Determination of Copper in Edible Oil Based on the Extraction with
N,N′- bis(5-methoxy-salicylidene)-2-hydroxy-1,3-propanediamine. Food Science and Technology Research, 19(2013), 647-653.
[15] Tokay, F., Bağdat, S. 2016. Novel and Validated Spectrophotometric Matrix Matching Method for Simple and Rapid Determination of Chromium in Oily Media. Spectroscopy and Spectral Analysis, 36(2016), 1634-1638.
[16] Tokay, F., Bağdat Yaşar, S. 2011. Yemeklik Yağlarda Çinko Tayini için Yeni Bir Analitik Yöntem. Dumlupınar Üniversitesi Fen Bilimleri Enstitüsü Dergisi, 26(2011), 57-68.
[17] Tokay, F., Bağdat, S. 2016. Extraction of nickel from edible oils with a complexing agent prior to determination by FAAS. Food Chemistry, 197(2016), 445-449.
[18] Savio, M., Ortiz, M. S., Almeida, C. A., Olsina, R. A., Martinez, L. D., Gil, R. A. 2014. Multielemental analysis in vegetable edible oils by inductively coupled plasma mass spectrometry after solubilisation with tetramethylammonium hydroxide. Food Chemistry, 159(2014), 433-438.
[19] Llorent-Martinez, E. J., Ortega-Barrales, P., Cordova, M. L. F., Dominguez-Vidal, A., Ruiz-Medina, A. 2011. Investigation by ICP-MS of trace element levels in vegetable edible oils produced in Spain. Food Chemistry, 127(2011), 1257-1262.
[20] Trindade, A. S. N., Dantas, A. F., Lima, D. C., Ferreira, S. L. C., Teixeira, L. S. G. 2015. Multivariate optimization of ultrasound-assisted extraction for determination of Cu, Fe, Ni and Zn in vegetable oils by high-resolution continuum source atomic absorption spectrometry. Food Chemistry, 185(2015), 145-150.