Contents lists available atSciVerse ScienceDirect
International Journal of Forecasting
journal homepage:www.elsevier.com/locate/ijforecast
Antecedents and effects of trust in forecasting advice
Paul Goodwin
a,∗,
M. Sinan Gönül
b,
Dilek Önkal
caUniversity of Bath, School of Management, Bath BA2 7AY, United Kingdom
bMiddle East Technical University, Department of Business Administration, Ankara, Turkey cBilkent University, Faculty of Business Administration, Ankara, Turkey
a r t i c l e i n f o Keywords: Judgmental forecasting Advice Stated trust Adjusting forecasts
a b s t r a c t
Forecasting support systems (FSSs) have little value if users distrust the information and advice that they offer. Two experiments were used to investigate: (i) factors that influence the levels of users’ stated trust in advice provided by an FSS, when this advice is provided in the form of interval forecasts, (ii) the extent to which stated trust is associated with users’ modifications of the provided forecasts, and (iii) the consequences of these modifications for the calibration of the interval forecasts. Stated trust was influenced by the levels of noise in time series and whether a trend was present but was unaffected by the presence or absence of point forecasts. It was also higher when the intervals were framed as ‘best-case/worst-case’ forecasts and when the FSS provided explanations. Absence of trust was associated with a tendency to narrow the provided prediction intervals, which reduced their calibration.
© 2012 International Institute of Forecasters. Published by Elsevier B.V. All rights reserved.
1. Introduction
Forecasting support systems (FSSs) can supply advice to users in a number of different ways. Statistical forecasts produced by the system can be regarded as one form of ad-vice (Önkal, Goodwin, Thomson, Gönül, & Pollock, 2009). These may take the form of point or interval forecasts, and the user is usually free to either (a) ignore this ad-vice and replace these forecasts, or (b) give some credence to the advice, either accepting these forecasts or adjust-ing them if they feel that this is necessary. More obvious forms of advice can take the form of written statements. These may merely be informative, in that they provide users with relevant information, or they may actively rec-ommend particular courses of action (Montazemi, Wang, Nainar, & Bart, 1996). Written explanations, which are designed to supply the user with the rationale that under-lies the statistical forecasts, fall between these extremes: supplying the user with reasons for leaving the statistical
∗Corresponding author. Tel.: +44 1225 383594.
E-mail address:[email protected](P. Goodwin).
forecasts unchanged but falling short of an explicit recom-mendation to do this.
It seems reasonable to assume that the extent to which users follow the advice of an FSS will be related to the level of trust that they attach to this advice. A recent field study (Fildes, Goodwin, Lawrence, & Nikolopoulos, 2009) found that forecasters in supply chain companies routinely override the advice that they receive from their forecasting systems, often to the detriment of forecast accuracy. In one company, over 90% of the system’s forecasts were changed. The absence of trust that this implies raises doubts about the extent to which FSSs can add value to the forecasting process. When the advice proffered by the FSS is of value, ignoring it due to a lack of trust is likely to be detrimental to the forecast accuracy.
This suggests that it is important to investigate what factors are likely to determine the level of trust placed in the advice provided by an FSS. In this paper, we report the results of two experiments that were designed to identify: (i) factors that influence the stated levels of users’ trust in the advice provided by an FSS, when this advice was provided in the form of interval forecasts, (ii) the association between the stated level of trust and
0169-2070/$ – see front matter©2012 International Institute of Forecasters. Published by Elsevier B.V. All rights reserved.
the users’ propensity to modify the interval forecasts, and (iii) the consequences of any modifications for the calibration of the interval forecasts. The first experiment investigated the extent to which the stated trust in interval forecasts depends on the nature of the time series of past observations, the language that is used to refer to the prediction intervals, and the presence and absence of point forecasts. Were noisier time series associated with lower levels of trust? Were the use of terminology that sounded more precise and the use of non-technical language conducive to higher levels of trust? Also, point forecasts represent forecasts in their most concise form, with no formal indication of the uncertainty associated with them. So did their presence add to the perception of the advice as being precise (i.e., exact and free from vagueness) and worthy of confidence? The second experiment used the most trusted form of advice that was identified in the first experiment to investigate whether levels of trust were enhanced when verbal explanations of the forecasts were provided. Also, because there is a possibility that asking for explicit assessments of trust will prime people to be more wary of the advice they receive, this experiment explored whether the act of eliciting a statement of trust itself had an effect on users’ tendency to modify the interval forecasts that were supplied.
2. Literature review
The concept of trust is multidimensional, and therefore, unsurprisingly, it has been examined by researchers from a wide range of disciplines. Although these researchers have brought different perspectives to the concept, it has been agreed that trust only applies when a situation is perceived to involve risk (Johnson-George & Swap, 1982). This means that there is an assumed probability of incurring a loss on the part of the truster who is considering placing trust in the trustee. Many definitions of trust can be found in the literature, but one byRousseau, Sitkin, Burt, and Camerer (1998) highlights the tension between the potential benefits and risks of placing trust in other human beings. These authors define trust as: ‘‘a psychological state comprising the intention to accept vulnerability based on positive expectations of the intentions or behaviors of another’’ (p. 395).
Other researchers have developed alternative, more specific, notions of trust, but many agree that the key factors that determine levels of trust are the perceived benevolence, integrity, and ability (or competence) of the trustee (Mayer, Davis, & Schoorman, 1995;Urban, Amyx, & Lorenzon, 2009).Mayer et al.(1995) define benevolence ‘‘as the extent to which a trustee is believed to want to do good to the trustor’’ (p. 718), while integrity relates to ‘‘the trustor’s perception that the trustee adheres to a set of principles that the trustor finds acceptable’’ (p. 719). Ability relates to factors like expertise, knowledge and competence within a particular domain. These authors emphasize that trust will be specific to a given domain. For example, statistical forecasters may be perceived to be highly competent in the extraction and extrapolation of trends from past data, but they may be seen as less competent as forecasters when unusual circumstances
suggest that a discontinuity will occur in these trends in the future.
A large number of potential antecedents of trust have also been investigated in the literature. It appears that benevolence and competence are more likely to be per-ceived when the potential truster believes that the trustee shares the same vision and purpose (Levin, Cross, & Abrams, 2002; Siegrist, Gutscher, & Earle, 2005), when the truster and trustee use the same jargon (Levin, 1999), when the goodwill or competence of the trustee can be verified, for example through past performance or reports from other trusters (Siegrist et al., 2005), and when any advice given by the potential trustee is underpinned by explanations (Gönül, Önkal, & Good-win, 2009; Gönül, Önkal, & Lawrence, 2006; Önkal, Gönül, & Lawrence, 2008). For example, research into user acceptance of the advice provided by expert sys-tems and recommendation agents for electronic com-merce has found that explanations enhance trust in the system (Wang & Benbasat, 2007;Ye & Johnson, 1995). The provision of explanations is thought to be helpful because: (i) it allows people to understand perceived anomalies in the advice they receive, (ii) it provides them with extra knowledge to assist them in the solution of a problem, and (iii) it facilitates learning (Gönül et al., 2006). Learning can enhance trust because it improves people’s performance, and hence improves the acceptance of the advisor who is assisting in this learning. However, this effect is likely to be relatively long-term, and requires feedback so that people can see evidence of an improved performance as a result of using the advice.
The advice literature also suggests that when uncer-tainty is being communicated by the potential trustee, for example through a prediction interval, indications of high uncertainty may lead to a reduced trust, even if the indi-cations are accurate. There may be two reasons for this. First, wide prediction intervals may be perceived as a sign of the trustee’s lack of competence and knowledge (Yaniv, 1997). Second, the perceived accuracy of the advice may not be the only determinant of trust. For example,Yaniv and Foster(1995) found that, when being supplied with a confidence interval, people preferred a narrow interval that excluded the true value to a wider interval that in-cluded it. This was because the wider interval (e.g., an esti-mate that the number of countries in the United Nations was between 50 and 300) was judged to uninformative. Thus, when judging the level of trust that they should place in advice in the form of prediction intervals, it appears that people make a trade-off between their desire for accuracy and their desire for informative advice. Wider intervals are more likely to include the true values, but will also be less informative. However,Du, Budescu, Shelly, and Omer
(2011) identify a third factor that is also likely to influence people’s trust in prediction intervals, which they refer to as congruence. In areas like financial forecasting, people ac-cept that there are high levels of uncertainty, and therefore a forecast which is credible will be expected to acknowl-edge this uncertainty. Thus, a prediction interval will be perceived to be more congruent with an uncertain situa-tion than a point forecast. Du et al.’s work suggests that, under conditions of uncertainty (e.g., in financial forecast-ing), there will be a non-monotonic relationship between
the width of a prediction interval and the trust associated with it. Congruence means that people will trust a forecast which is expressed as an interval up to a certain width; be-yond this, the concerns about the lack of informativeness (and possibly competence) will kick in, and trust will de-cline. In short, beyond an expected level of imprecision in the advice, the perceived vagueness of the advice is likely to be negatively associated with the level of trust placed in it.
Some researchers (e.g., Gefen, Karahanna, & Straub, 2003) draw a distinction between trust as a set of beliefs (e.g., in the benevolence, integrity and competence of the trustee) and the behavioral intentions of the trustee, which in turn will lead to actual behaviors. This distinction is consistent with the theory of reasoned action (Fishbein & Ajzen, 1975) and the well-known technology acceptance model (TAM) (Davis, 1989). In contrast, other researchers have regarded actual behaviour as providing an indication of trust (e.g. Gulati, 1995). In this paper we take the former perspective and regard stated trust as an expression of a set of beliefs, which is to be distinguished from people’s subsequent behavior. This is because factors other than trust may also result in particular behaviors, such as a failure to recall or pay attention to the advice at the point when actions are being determined. For example, the process of determining actions may cause one’s focus to be directed to additional information besides the advice, so that its salience is reduced. Actions may even invoke different cognitive processes to those used in the assessments of trust.Twyman, Harvey, and Harries
(2008) suggest that inconsistencies between the trust that people state that they have in advice and their subsequent actions might occur because intuitive processes are used to determine actions, while stated trust is determined though explicit and reflective reasoning. Expressions of stated trust may, therefore, suffer from a lack of insight into this intuitive processing.
Most research into trust has focused on trust in human beings. However, there is a growing body of literature on the antecedents of trust in the advice provided through machines or computers. Some of the early work in this field explored trust in expert systems. Bell (1985) suggested that expert systems that produce their recommendations without justification or explanations were unlikely to be trusted. However, he indicated that users would probably be tolerant of occasional mistakes on the part of the system if they can recognize the specific situations in which these mistakes occur. Indeed, he suggested that there is a danger that systems which provide rationalizations for their advice may attract too much trust. He therefore advocated mechanisms that force the users to do some of the work of the system, so that they think about its results and recognize exceptions where the advice is in error. More recent work has included research on trust in on-line advice systems (e.g.McKnight & Kacmar, 2006) and web-based decision support systems (e.g. Wang & Benbasat, 2005). Much of this work has suggested that people credit technology systems that offer advice with human qualities, such as responsibility, benevolence and credibility (Wang & Benbasat, 2005). This is not entirely irrational, as all computer systems have human designers,
and hence, the benevolence or competence associated with the advice from a system will depend on the motivations and competence of the designer. However, the extent to which people ascribe human characteristics to a system may depend on the type of system and its presentation. For example,Önkal et al.(2009) found that people did not have the same level of trust in a forecasting support system as in human advisers. In their study, advice on forecasting was more trusted when it was thought to emanate from human experts rather than from a statistical algorithm embedded in a computer system. Consistent with this, Wang and Benbasat(2005) argue that the anthropomorphization of computer systems may not be a characteristic of trust when systems are not deliberately presented as if they have human qualities. They suggest that future research should explore whether other dimensions of trust, which are specific to this type of technology, may prevail (see also
Vance, 2009).
3. Formulation of hypotheses
The literature suggests that, once a forecast has acknowledged the presence of uncertainty (to ensure congruence), increased levels of vagueness or imprecision in the forecast will lead to reduced trust. Prediction intervals will be wider when a time series contains more noise. This leads to the following hypothesis:
H1: Stated trust in the advice of an FSS will be lower for series with high levels of noise.
In the experiment that follows we also manipulated vagueness in the way that the advice was provided using two devices. First, we examined the effect of framing a 90% prediction interval as a ‘best-case/worst-case forecast’. This terminology creates an idea of absolute upper and lower bounds, yielding a greater sense of precision and certainty than a 90% prediction interval. It also involves language that is ‘jargon-free’, and hence is more likely to be familiar to potential trusters (Levin, 1999). According to the literature, these two attributes should increase the level of trust in the advice. Second, we examined the effect of providing interval forecasts, but with a point forecast omitted. When there are high levels of uncertainty, a point forecast should carry little weight in a decision, since it is likely that the outcome will have a large deviation from the forecast. However, including a point forecast is likely to increase the sense of precision, and hence the level of trust in the advice. Thus, we hypothesise:
H2: The stated trust in a forecast will be increased if an interval forecast is framed as a ‘best-case/worst-case forecast’, rather than a 90% prediction interval.
H3: The stated trust in a forecast will be increased if a point forecast is provided with an interval forecast.
In addition to the level of noise, the nature of the underlying trend in a series may also influence levels of trust. People’s experience of real time series may suggest that upward or downward trends in series are often damped or subject to reversal (O’Connor, Remus, & Griggs, 1997). For example, series with downward trends may have an absolute lower limit of zero, in which case their rate of decline may level out as this limit is approached. Also, when the downward trend is undesirable, people
Fig. 1. Hypotheses for experiment 1.
may expect action to be taken to reverse this trend. Thus, prediction intervals which are based on linear extrapolations of upward or downward trends may be trusted less than those presented for untrended series. This suggests the following hypothesis:
H4: The stated trust in the advice of an FSS will be higher for untrended series than for trended series.
Finally, the stated trust is only of practical interest if it is linked with the user’s actions. It seems reasonable to assume that higher stated levels of trust will be associated with smaller changes to the forecasts provided by the FSS. Hence, we hypothesize:
H5: Higher levels of stated trust will be negatively correlated with the sizes of changes made to the FSS forecasts.
Fig. 1 summarizes the hypotheses. These hypotheses were tested in the first experiment which we now describe. The experiment was also used to examine the relationship between stated trust and the users’ actions, and the consequences of this relationship for the calibration of the interval forecasts.
4. First experiment
4.1. Design
The experiment employed a 2
×
2×
2×
6 mixed factorial design. The first factor was the framing of the forecasting interval (90% interval forecasts or best-case/worst-case forecasts). The second was the presence or absence of point forecasts accompanying the prediction intervals. These two factors were manipulated as between-subject variables, leading to four groups of participants. The third and fourth factors were within-subject, and represented two levels of noise associated with the time series and three types of trend, as indicated below.Group 1 (90% interval forecasts with point forecasts): The participants in this group received forecasting advice in the form of ‘‘90% interval forecasts’’ that were complemented with point predictions. For the experimental task, they were required to convey their final forecasts in the form of
a ‘‘90% interval forecast upper bound’’, a ‘‘point forecast’’ and a ‘‘90% interval forecast lower bound’’.
Group 2 (Best-case/worst-case forecasts with point fore-casts): The participants in this group received forecasting advice in the form of ‘‘best-case/worst-case forecasts’’ that were accompanied with point predictions. For the experi-mental task, they were required to convey their final fore-casts in the form of a ‘‘best-case forecast’’, a ‘‘point forecast’’ and a ‘‘worst-case forecast’’.
Group 3 (90% interval forecasts only): This group received forecasting advice in the form of ‘‘90% interval forecasts’’ only. No point predictions were given. The participants were asked to convey their final forecasts in the form of a ‘‘90% interval forecast upper bound’’ and a ‘‘90% interval forecast lower bound’’.
Group 4 (Best-case/worst-case forecasts only): This group received forecasting advice in the form of ‘‘best-case/worst-case forecasts’’ only. No point predictions were given. The participants were asked to convey their final forecasts in the form of a ‘‘best-case forecast’’ and a ‘‘worst-case fore-cast’’.
Note that the prediction intervals provided were in fact the same for every group. The only difference lay in the way they were framed to the participants.
In order to be able to control the trend and variability levels, the time series used in this study were constructed artificially using a procedure very similar to those used in previous studies (Gönül et al., 2006; Önkal et al.,
2008). Two levels of variability (low and high noise) and three levels of trend (positive, negative and no trend) were employed to generate six combinations. With two iterations from each combination, a total of 12 series were obtained. The formula used to generate the series was: y
(
t) =
3.
5+
β
t+
error(
t)
t=
0,
1, . . . ,
25.
For the positively trended series, the trend coefficient
β
had a value of 0.07, and for the negatively trended ones its value was−
0.07. The error has a normal distribution with zero mean and a standard deviation of either 5% of the initial underlying level (i.e., 0.
05×
3.
5) for series with low noise or 15% (i.e., 0.
15×
3.
5) for those with high noise.All of the parameters (the initial level, trend and standard deviation) were set so that the series constructed would bear a close resemblance to typical stock series traded on the Istanbul Stock Exchange. There is some evidence that stock prices in emerging markets, such as the Turkish market, follow trend-stationary processes, rather than random walks (Chaudhuri & Wu, 2003), and the underlying trends are occasionally subject to structural breaks that result in a change in the slope of the trend function. For each series, 26 periods of data were generated. Of these, the first 25 periods of data were presented to the participants as the time series, and the last value was withheld in order to use it as the realized stock price of the 26th week.
Based on these time series data, statistical forecasts were generated using double exponential smoothing, with the forecasts being designed to minimize the mean squared error of the point forecasts in the fitted periods. Although the series generated did not contain any structural breaks during the short period of time that was simulated, double exponential smoothing was selected because, in practice, it would have the capability to adapt to any resulting changes in the trend. In addition to point forecasts, the smoothing model also produced 90% prediction intervals, which constituted the forecasting advice in the form of ‘‘90% interval forecasts’’ or ‘‘best-case/worst-case forecasts’’. The differences between the prediction intervals generated by the double exponential smoothing process and those obtained from a global linear regression model were only slight: across the series, the mean difference between the upper limits was only 2.6% of the starting level of the series, while for the lower limits it was 2.7%.
4.2. Participants and procedure
A total of 92 students who were taking the Business Forecasting course in the Faculty of Business Administra-tion at Bilkent University participated in the study, and received course credit for their participation. The partici-pants were assigned to the experimental groups randomly so that there were 23 participants in each group. Each par-ticipant was provided with a booklet consisting of instruc-tions, 12 time series sheets (each containing a time series plot of the previous 25 values, as well as forecast advice for the next period), and an exit questionnaire. The par-ticipants were told that these series were stock prices, but that the names of the stocks and the time periods remained undisclosed so as to prevent any potential biases or extra-neous information effects.
In the experimental procedure, the participants were first requested to examine each time series and the corre-sponding forecasting advice carefully. This was followed by questions which were designed to elicit the participants’ trust and risk assessments. In particular, the first question requested an assessment of the trust placed by the subjects in the advice given when using it for buy/sell decisions for the particular stock, while the second question asked the participants to evaluate their perceptions of the risk in us-ing the given advice as is (i.e., without any adjustments). This was followed by a request for the participants to pro-vide their own forecasts (i.e., their final predictions includ-ing any judgmental adjustments which were made to the
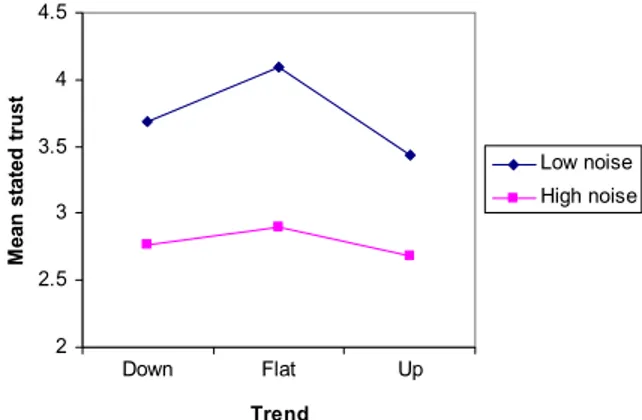
Fig. 2. Stated trust for the different series types.
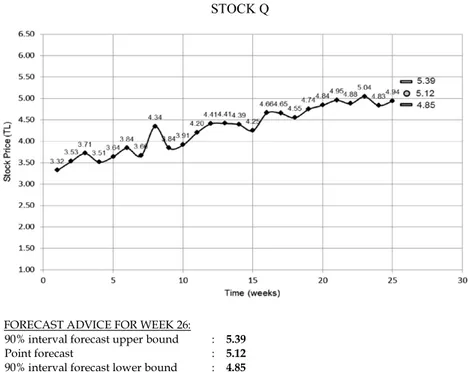
given forecast advice), after which they were asked to des-ignate their assessments of the risk if their final/adjusted forecasts were to be used in buy/sell decisions (seeFig. 3
for a sample of the time series forms given to Group 1 par-ticipants, with details given below). This process was re-peated for all 12 of the series, after which the participants completed the study by filling out an exit questionnaire. 4.3. Results
4.3.1. Determinants of stated trust
The stated trust was elicited by asking participants to rate the extent of their trust in the given forecast advice on a 5-point scale (where 1
=
‘‘Don’t trust at all’’; 5=
‘‘Trust completely’’) via explicit ratings. Overall, the mean level of trust was 3.26 (SD
=
1.
10). A trust rating of 1 was given in only 6.4% of cases, while a rating of 5 was given in 11.1% of cases. ANOVA was used to investigate the determinants of trust (H1–H4). This indicated significant main effects for noise (F1,88=
140.
0, p<
0.
001), intervalframing (F1,88
=
4.
2, p=
0.
044) and trend (F2,88=
20.
4,p
<
0.
001).For interval framing, mean levels of trust were higher where the interval was described in the best-case/worst-case format. The mean levels for this format were 3.36 (SD
=
1.
06), as opposed to 3.17 (SD=
1.
14) for the ‘‘90% prediction interval’’ format, so the effect was quite small. Nevertheless, this provided support for H2. There was also a significant interaction between trend and noise (F2,88=
7
.
3, p=
0.
001). This is shown in Fig. 2, and indicates that the stated trust was highest for the untrended series and the low noise series, a finding which supports H1 and H4. Only H3 remained unsupported: the main effect for the presence of a point forecast was not significant (F1,88=
0.
28 p=
0.
6), and there were no significantinteractions involving this variable. In summary, the stated trust was highest where the series were untrended and had a low level of noise, and where the prediction interval was framed as a best-case/worst-case forecast.
4.3.2. Relationship between stated trust and users’ actions The users had an opportunity to modify the prediction intervals supplied, and, overall, 96.6% of the intervals were adjusted. The extent of the adjustments was measured
Fig. 3. Sample time series for study 1 (for participants in group 1).
by calculating the sum of the absolute adjustments to the boundaries of the supplied interval (SAA).
SAA
= |
adjustment to low
er boundary|
+ |
adjustment to upper boundary|
.
As all of the series were displayed on graphs with the same vertical scale, the adjustments for the different series were directly comparable.
For each participant, the correlation between their stated trust and their SAA was calculated across the twelve series. The mean correlation for the 91 participants for
whom correlations could be calculated was
−
0.46 (one participant indicated the same level of trust for all series so the correlation was undefined). A test of means revealed that this mean correlation was significantly below zero (t90= −
14.
1, p<
10−6, one tail).1 Also, 82 of the 91correlations were negative, and there was little difference between the mean correlations of the four groups (they
1 Note that our sampling units are the correlations themselves, not the individual pairs of observations. Fisher’s transformation is designed to be applied to the latter, and hence was not used here.
Table 1
Types of adjustments to interval forecasts.
Trend Noise Upper limit Lowered Lowered Raised Raised At least 1 limit Lower Limit Lowered Raised Lowered Raised Unchanged
Down Low 17 29 12 34 9 High 16 47 8 25 3 Flat Low 21 38 17 11 13 High 17 38 17 20 9 Up Low 42 21 18 8 10 High 55 26 7 7 5
Mean stated trust 3.1 3.3 3.2 3.2 3.7
All percentages are rounded to whole numbers. Percentages over 30% are given in bold.
ranged from
−
0.53 to−
0.41). This suggests that the stated trust was negatively associated with the sizes of the modifications that users made to the FSS’s interval forecasts, thereby providing support for H5. However, the stated trust typically only explained 21% (i.e., 100×
0.
462) of the variation in these modifications.To investigate what might account for the unexplained variation, an analysis of the different types of modification the participants performed on the provided interval forecasts was carried out. This was to establish whether some types of modification were associated with larger adjustments, even when the stated level of trust in the original interval was the same. Nine types of adjustment are possible: the upper limit can be raised, left unchanged or lowered, and this can be combined with similar changes on the lower limit.Table 1shows the percentage of changes of each type by trend type and noise level (changes where at least one limit was left unchanged were relatively rare, so the percentages for these have been combined). This suggests a tendency to lower both limits for upward trended series, which would be consistent with damping the trend, to narrow the limits for flat series, and to raise the lower limit for downward trended series (again suggesting damping). The mean level of trust stated for each adjustment type is also shown. There are only small differences between these means, except where at least one limit was left unchanged, in which case the mean trust was higher.
To examine the effect of trust and adjustment type on the SAA, a linear model was fitted to the data using the method of generalized estimating equations to take into account the repeated measures associated with each participant. The model was:
SAA
=
0.
763−
0.
164 Stated trust+
0.
356A+
0.
289B+
0.
089C+
0.
224D where:A
=
1 if the adjustment type was upper and lower limits both lowered, 0 otherwiseB
=
1 if the adjustment type was upper limit lowered and lower limit raised, 0 otherwiseC
=
1 if the adjustment type was upper limit raised and lower limit lowered, 0 otherwiseD
=
1 if the adjustment type was upper and lower limits both raised, 0 otherwise.The p-values for the constant and coefficients were all less than 0.003, except for the coefficient for C , where the p-value was 0.214. This model suggests that the extent to
Table 2
Mean ‘‘hit rate’’ scores for the adjusted interval forecasts. Point forecast present Point forecast absent 90% interval forecasts 74.64% 61.59% (11.09%) (21.58%) Best-case/worst-case forecasts 69.93% 60.51% (15.84%) (16.71%)
There were 23 participants in each of the four groups. Standard deviations are shown in brackets.
which users adjust the forecasts of an FSS will not depend simply on the level of stated trust in the forecasts, but also on the type of adjustment, which may itself depend on the nature of the time series.
4.3.3. Performance of adjusted forecasts
Did the participants’ adjustments of the interval forecasts improve their calibration? Table 2 shows the ‘‘hit rates’’ for the adjusted forecasts (i.e., the percentage of occasions when the realized value falls in the given interval). The 90% intervals provided resulted in a hit rate of 91.67%, which meant that they were well calibrated (this was not surprising, given the stability of the generated time series). In contrast, the adjusted forecasts in each of the four groups achieved much lower hit rates. In every group, the mean interval calibration was significantly worse than that of the intervals provided (t-tests applied to each group all had p-values below 0.001). This was because the participants tended to narrow the provided intervals, demonstrating overconfidence. Clearly, the participants would have been better off if they had trusted the advice completely and not made any adjustments.
Given that participants expressed greater trust when the interval forecasts were expressed in the best-case/ worst-case format, it is useful to investigate how they interpreted the terms ‘best case’ and ‘worst case’. In order to explore this, two items were included in the exit questionnaire asking for the participants’ judgments as to ‘‘the percentage of times the actual value is expected to be lower than the best-case forecast’’ and ‘‘the percentage of times the actual value is expected to be higher than the worst-case forecast’’. Taken together, the results imply that, on average, participants expected the realized value to be within their best-case/worst-case interval only 48.4% of the time. Although this is similar to the actual hit rates of intervals in financial forecasting (Du et al., 2011), it provides an interesting insight into the way in which
people interpret a best-case/worst case range. Of course, this result may reflect the difficulty that participants may have had in responding to the questions. For example, asking for the percentage of times that they expected the actual value to be better than the best-case forecast or worse than the worst-case forecast may have led to a different result. Nevertheless, as it stands, the result suggests that, in reality, the benefits of the gains in stated trust achieved by using apparently more precise terminology may be undermined by ambiguities in the way in which the terms are interpreted.
5. Second experiment
One potentially important device for influencing trust that was not explored in Experiment 1 is the provision of explanations which underpin the advice. The literature review indicated that these have been found to enhance the stated trust in computer-based advice systems such as expert systems or systems that provided shopping ad-vice for on-line purchasers. Previous research on forecast-ing support systems has shown that presentforecast-ing explana-tions along with forecasts is closely tied to advice accep-tance (Gönül et al.,2006;Önkal et al.,2008). However, this finding is not universal, and no such effect was found in a study byGoodwin and Fildes(1999). The form of expla-nations provided by systems can vary, but in an FSS they will typically be justification/automatic/text explanations (Gönül et al., 2006). Justification explanations provide the rationale underlying the system’s recommendations. Auto-matic explanations are provided whether the user requests them or not, and text explanations are presented in the form of a few sentences, as opposed to (say) a multi-media presentation. This is the type of explanation we used in the experiment. We hypothesise:
H6: The provision of explanations will increase the stated trust in the advice provided by an FSS.
Experiment 1 revealed that there was an association between stated levels of trust and the extent to which users adjusted the forecasts provided. The results suggested that stated trust can make a useful contribution to predictions of the way an FSS will be used. However, it is important to ask whether the act of asking people to explicitly state their level of trust in the advice provided by a system will have had an effect on their subsequent actions. One possibility is that asking for an expression of trust might have a priming effect, evoking concerns that the forecasts may be untrustworthy, which would not have been present otherwise. Also, people may want to appear consistent in their responses, particularly when these are being monitored. If providing a stated trust score has a ‘carry over’ effect and systematically affects the use of the system, then the levels of forecast adjustment reported in Experiment 1 may not apply in situations where users are not required to report their levels of trust explicitly. We hypothesize:
H7: The requirement to state one’s level of trust in an FSS has an effect on the size of adjustments made to the provided forecasts.
5.1. Design
Experiment 2 was used to test these hypotheses using a 2 [forecast explanation: present vs. not present]
×
2 [trust in advice: explicitly assessed vs. not assessed] full factorial design. As in Experiment 1, each participant was provided with an instruction booklet. This time, the participants were provided with 18 time series sheets, including forecast advice for each stock’s one-period-ahead forecast, and an exit questionnaire. As before, the participants were told that these series were stock prices with undisclosed names and time periods. In each group, the advice provided was in the form of best-case/worst-case forecasts, accompanied by a point prediction. The best-case/worst-case format was used because Experiment 1 suggested that this led to the highest levels of stated trust. Although Experiment 1 indicated that the provision of point forecasts had no effect on trust, they were included in this experiment because they are always provided in the FSSs employed by organizations. The tasks carried out by the four groups are described below.Group 1 (Forecast explanations—explicit assessments of trust in advice): The participants in this group received explanations along with the time series and the forecasting advice. For each time series, subjects were requested to (1) examine the given material (time series
+
forecast advice+
explanation) carefully; (2) provide an assessment of the trust they placed in the given advice when using it to make buy/sell decisions for the particular stock; (3) evaluate their perceptions of the risk in using the given advice as is (i.e., without any adjustments) in buy/sell decisions for this stock; (4) provide their own forecasts (i.e., their final predictions, including any judgmental adjustments made to the given forecast advice) in the form of a ‘‘best-case forecast’’, ‘‘point forecast’’ and ‘‘worst-case forecast’’ (seeFig. 4for a sample form given to Group 1 subjects, with details given below); and (5) designate their assessments of the risk if their final/adjusted forecasts were to be used in buy/sell decisions.Group 2 (Forecast explanations only): The participants in this group received explanations along with the time series and the forecasting advice (and no explicit assessments of trust were requested). For each time series, subjects were requested to carry out only (1) and (4) above.
Group 3 (Explicit assessments of trust in advice only): The participants in this group received only the time series and the pertinent forecasting advice (i.e., no explanations were provided). For each time series, the subjects were requested to carry out (1)–(5) above.
Group 4 (None): The participants in this group received only the time series and the pertinent forecasting ad-vice (i.e., no explanations were given and no explicit as-sessments of trust were asked for). For each time series, the subjects were only requested to carry out (1) and (4) above.
Both the function used to generate the series and its parameters and the statistical forecasting method were the same as in Experiment 1. The only difference was that three additional samples from each trend and variability combination (three trend levels
×
two variability levels) were constructed, resulting in 18 new series being used inFig. 4. Sample time series for study 2 (for participants in group 1).
the second study. The explanations supplied to Groups 1 and 2 were very similar in wording and content to those used in the study byGönül et al.(2006).
The participants were 93 business forecasting students in the Faculty of Business Administration at Bilkent University, and they were allocated to the experimental groups randomly. They received course credit for their participation. The numbers in each group were: group 1: 23 participants, group 2: 23, group 3: 25, and group 4: 22. After making their forecasts for all 18 series, the
participants completed the study by filling out an exit questionnaire.
5.2. Results
5.2.1. Effect of explanations on stated trust
Explicit assessments of trust were only required from the participants in Groups 1 and 3.
Group 1 received explanations along with the forecast advice, while Group 3 participants only received the
Table 3
Responses on the value of explanations.
Mean agreement rating Significantly different to ‘‘3’’=‘‘neither agree or disagree’’? ‘‘I have carefully read the provided explanations’’ 4.39 t45=13.83
(0.68) p<0.0001 ‘‘I believe the explanations are very clear to understand’’ 4.41 t45=14.69
(0.65) p<0.0001 ‘‘I believe the provided explanations are very informative’’ 3.89 t45=6.54
(0.92) p<0.0001 ‘‘The explanations increased my understanding of the
time series plots’’
3.94 t45=7.92
(0.80) p<0.0001 ‘‘The explanations increased my understanding of the
provided advice’’
3.72 t45=6.03
(0.81) p<0.0001 ‘‘The explanations helped me considerably in
constructing my forecasts’’
3.83 t45=7.03
(0.80) p<0.0001
The ratings represent levels of agreement on a 5-point scale (where 1=‘‘strongly disagree’’ and 5=‘‘strongly agree’’). The standard deviations are provided in parentheses.
forecast advice (with no explanations). The mean trust ratings expressed by the participants who received the explanations (i.e., Group 1) was 3.42 (SD
=
0.
99), while the mean trust rating of those who did not receive any explanations (i.e., Group 3) was 3.19 (SD=
1.
03). The mean trust rating of the first group is significantly greater than that of the second (t45=
1.
86, p=
0.
035, one tail), sothe provision of explanations led to higher levels of stated trust, providing support for H6.
In fact, the participants appeared to value receiving explanations as part of the forecasting advice. This is reflected in their answers in the exit questionnaire, as summarized in Table 3. As may be observed from this table, the participants indicated that the explanations they received were easy to understand and informative, improving their understanding of both the time series and the provided advice, as well as aiding them considerably in obtaining their final adjusted forecasts. This is interesting, as many of the explanations (e.g., see Fig. 4) did not provide a substantive account of the basis for the forecasts. Instead, they simply referred to past patterns and the (unsupported) expectation that these would continue. This suggests that the mere act of presenting an apparently coherent verbal rationalization of the forecast may be sufficient to encourage trust, even when the forecast is not underpinned by any real supporting arguments and evidence.
5.2.2. Effect of explicit trust assessment on forecast adjust-ments
As in Experiment 1, the participants adjusted a large percentage of the forecasts provided to them (95.7% of point forecasts and 97.6% of interval forecasts were adjusted). The modifications that the participants made to the point and interval forecasts provided were measured using the absolute adjustment to point forecasts (AAP) and sum of absolute adjustments to the limits of the prediction interval (SAA), respectively. The SAA was introduced earlier. The AAP was calculated as follows:
AAP
= |
Adjusted point forecast−
Provided point forecast|
.
Because all of the series were plotted on the same scales, the absolute adjustments for the different series were directly comparable.
The mean AAP for all participants was 0.145 units (the graphs inFigs. 3and4show the relevant scale). An ANOVA was applied to the AAPs with trust elicited/not elicited and explanations provided/not provided as between-subject factors, and trend and noise as within-between-subject factors. Neither the elicitation of a trust rating nor the provision of explanations had any significant effect on the adjustments to the point forecasts; there were no significant main or interaction effects involving these factors (minimum p-value
=
0.
118). Thus, while people indicated that they trusted forecasts more when they received explanations, this did not appear to be reflected in their actions in relation to the point forecasts.When an analogous ANOVA was applied to the SAAs, similar results were obtained, except that there was also a significant main effect for the elicitation of trust (F1,89
=
4
.
31, p<
0.
041). The mean SAA when trust was elicited was 0.38, while it was 0.30 otherwise (see the graphs in the appendices for the relevant scales), so larger adjustments tended to be made to the prediction intervals when levels of trust had been elicited. It is unclear why this was the case. Possibly the act of asking for a trust rating alerted the participants to the possibility that the forecasts might not be trustworthy, causing them to make larger adjustments. However, this does not explain why the same tendency was not observed for point forecasts. It also suggests that the prediction interval adjustments in Experiment 1 would have been smaller if trust ratings had not been elicited.In summary, providing explanations increased the stated trust, so H6 was supported. Eliciting trust ratings did affect the size of adjustments to prediction intervals, but not that of adjustments to point forecasts, so there was some support for H7.
5.2.3. Consequences of the experiment manipulations for forecast performance
As in Experiment 1, when considering the prediction intervals, the participants would have been better off if they had followed the advice offered. While the forecast
advice offered a hit rate of 83.33% for the best-case/worst-case intervals, the participants in all groups ended up with significantly lower mean hit rates for their adjusted intervals (t-tests applied to each group all had p-values below 0.0016). Again, the poorer performance of the adjusted intervals was a result of a tendency to narrow them. The mean interval widths for groups 1–4 were found to be 1.17, 1.11, 1.17 and 1.24, respectively. These widths were significantly narrower than the mean width of the intervals provided (i.e., 1.31) for the first three groups (all p-values
<
0.0001). The last group, who received no explanations and were not required to make an assessment of trust, had an average width that was the closest to that of the provided intervals. There was also evidence that the adjusted point forecasts were less accurate than those that were provided. The mean absolute percentage errors of all four groups were significantly higher than that of the forecast advice (17.71%) (p<
0.
001 for all groups). Overall, the MAPE of the adjusted forecasts was 20.37%.6. Discussion and conclusions
The results of the two experiments suggest that there are two issues that merit further discussion: (i) partici-pants’ lack of trust in the reliable advice provided, and (ii) the relationship between stated trust and subsequent actions.
Forecasting support systems have little value if their outputs are not trusted. In both experiments, people’s trust ratings and their subsequent actions revealed that they rarely placed total trust in the system, a finding which is consistent with previous research which has been carried out in the field (e.g., Fildes et al., 2009, and Franses & Legerstee, 2010). This was the case despite the fact that the forecasts provided were generally more accurate than the users’ revised forecasts. It is interesting to reflect on how people may make their assessments of trust in a system. In many situations, perceived benevolence, shared values and competence may lead to ‘blind’ trust in an advisor, in the sense that the advice is accepted without the advisee making an independent assessment of the situation. Indeed, the trustee may have no understanding of the basis for the advice but accept it, given the perceived positive attributes of the advisor. In our experiments, there was little or no basis on which the users could form perceptions of these attributes. For example, there was no data on the past accuracy of the system to support assessments of competence, and no features that may have been associated with benevolence and shared values. This absence is likely to motivate people to make an independent assessment of what the forecasts should be, and then to compare these with the forecast advice provided. Given the prevalence of heuristics in judgmental time series forecasting (Bolger & Harvey, 1993) and people’s preference for informativeness over accuracy (Yaniv & Foster, 1995), these independent forecasts are unlikely to correspond to the forecasts provided. Because people have a greater access to the rationale for their own forecasts, as opposed to the system’s, they are likely to stick to these independent forecasts, and hence have a lack of complete trust in the system (Yaniv, 2004).
This suggests that fostering trust in an FSS and an acceptance of its forecasts requires devices for promoting a sense of benevolence and competence. Benevolence can arise when the trustee believes that the system has been designed with the same vision and purpose that they bring to the task. This is most likely to be perceived when the FSS is well-aligned to the task in hand, which is ultimately to support specific decisions. In many circumstances, it may be unclear to the user as to the way in which the advice provided by the FSS should be used in the decision process. For example, the link between the provision of 90% prediction intervals and the decisions they are designed to support is not always obvious (Goodwin, Önkal, & Thomson, 2010), so people may simply resort to assessing these intervals on the basis of their perceived informativeness. Indeed, it is a feature of FSSs, as opposed to ‘full’ decision support systems, that they usually only supply advice relating to one part of the decision; by definition, their advice is confined to the forecasting element of the decision task. The opportunity losses of alternative courses of action are rarely considered in such systems. Future research could usefully focus on the trust that is placed in forecasts when they are embedded as part of a decision support system.
Competence may be more difficult to establish in FSSs, even when data on the past forecast accuracy is provided. Users may have a tendency to perceive each new period as a special case, and hence, to consider it as unrelated to the base-rates provided (Lim & O’Connor, 1995). As a consequence, they discount the perceived value of the forecasts provided, and replace them with their own judgments. Users also often have a poor understanding of the reasons why point forecasts filter out the noise in time series. They may falsely see systematic patterns in noise (Goodwin & Fildes, 1999), and hence regard the failure of the forecasts to represent this noise as an indication of the system’s lack of competence.
The experiments also showed that the stated level of trust in the forecasts only partly explained variations in the extent to which the provided forecasts were adjusted. For a given level of trust, the characteristics of the time series had an additional influence on the type of the adjustment that was made, and hence, on the size of the adjustment. Also, when explanations were provided, people indicated that they had a greater trust in the system, but apparently without changing their behavior. It is perhaps significant that some studies which have found explanations to enhance people’s trust in computer-based advice (e.g.Ye & Johnson, 1995, andWang & Benbasat, 2007) have only elicited the stated trust from users. Our study has the advantage that it was able to assess the extent to which this stated trust was reflected in the users’ subsequent actions. The lack of a close relationship between the stated trust and subsequent actions may be a result of the different processes that apply to the assessment of trust and the judgment as to the extent to which the forecasts should be modified. The initial assessment of trust may require less involvement in the forecasting process than the assessment of what adjustments are required. As was argued earlier, the latter task may therefore cause greater attention to be paid to information, such as the time series
cues, which competes with the information contained in the advice, thereby reducing the salience of the advice. For given levels of stated trust, the variation in these cues will lead to different levels of adjustment, as is indicated by the regression equation presented in Section4.3. For example, these variations may influence the extent to which people tend to anchor on the provided forecasts.
Significantly, the explanations that were provided in experiment 2 focused on the underlying trend in the series and said nothing to justify the width of the prediction in-tervals. In fact, their emphasis on supporting the trend pre-dictions could have been expected to have increased the participants’ overconfidence, causing them to narrow the prediction intervals further. The fact that this did not hap-pen is evidence that the explanations were simply ignored, or at least heavily discounted, when the participants made their own forecasts. When explanations are likely to ben-efit forecasts, asking for the documentation of reasons for adjustments might raise their salience at the stage when the forecasts are being made. A study byGoodwin(2000) found that this device reduced unnecessary and damaging judgmental adjustments to the statistical point forecasts produced by an FSS.
It should be noted that, although the advice provided in the form of the forecasts was of a high quality, it was not the best that was possible. The provided series were generated using a global trend model, while the advice was based on double exponential smoothing, which is designed for series that manifest local trends. Hence, the forecasts provided placed greater weight on more recent observations than the optimum OLS regression model would have done. The relationships between the stated trust in advice and subsequent actions might have been different if the best possible advice had been available, or if the advice had been of a low quality. Nevertheless, there is no guarantee that people would have followed the advice even if they were assured that it was the best possible advice available, asGardner and Berry(1995) found when people had the option of following optimal advice as they performed a simulated intensive care control task.
Our study has a number of other potential limitations. Simulated time series were used and the provided pre-diction intervals were always extremely well calibrated, which would not be the case in practice. The context of the study – stock market forecasting – may have led to particular expectations about the reliability of the fore-casts provided that would not apply in other contexts, so extending this type of study to other areas of forecast-ing would be a useful future research activity. Also, the participants were students who were making judgments relating to hypothetical decisions. Nevertheless, students have been shown to be excellent proxies for managers in previous forecasting and decision making studies (e.g., see
Remus, 1986). Of course, the participants may have felt that adjustments to the provided forecasts were expected, or why were they being asked to take part in the exer-cise? However, these conditions may also apply in organi-zational contexts, where forecasters feel an obligation to adjust forecasts merely to justify their role (Fildes et al.,
2009;Önkal, Lawrence, & Sayım, 2011), and they would not account for the differences in the sizes of adjustments between the experimental treatments.
References
Bell, M. Z. (1985). Why expert systems fail. Journal of the Operational
Research Society, 36, 613–619.
Bolger, F., & Harvey, N. (1993). Context-sensitive heuristics in statistical reasoning. The Quarterly Journal of Experimental Psychology Section A,
46, 779–811.
Chaudhuri, K., & Wu, Y. (2003). Random walk versus breaking trend in stock prices: evidence from emerging markets. Journal of Banking and
Finance, 27, 575–592.
Davis, F. D. (1989). Perceived usefulness, perceived ease of use and user acceptance of information technology. MIS Quarterly, 13, 319–340. Du, N., Budescu, D. V., Shelly, M. K., & Omer, T. C. (2011). The appeal of
vague financial forecasts. Organizational Behavior and Human Decision
Processes, 114, 179–189.
Fildes, R., Goodwin, P., Lawrence, M., & Nikolopoulos, K. (2009). Effective forecasting and judgmental adjustments: an empirical evaluation and strategies for improvement in supply-chain planning. International
Journal of Forecasting, 25, 3–23.
Fishbein, M., & Ajzen, I. (1975). Belief, attitude, intention and behavior:
an introduction to theory and research. Reading, MA: Addison-Wesley
Publishing Company.
Franses, P. H., & Legerstee, R. (2010). Do experts’ adjustments on model-based SKU-level forecasts improve forecast quality? Journal of
Forecasting, 29, 331–340.
Gardner, P. H., & Berry, D. C. (1995). The effects of different forms of advice on the control of a simulated complex system. Applied Cognitive
Psychology, 9, S55–S79.
Gefen, D., Karahanna, E., & Straub, D. W. (2003). Trust and TAM in online shopping: an integrated model. MIS Quarterly, 27, 51–90.
Gönül, M. S., Önkal, D., & Goodwin, P. (2009). Expectations, use and judgmental adjustment of external financial and economic forecasts: an empirical investigation. Journal of Forecasting, 28, 19–37. Gönül, M. S., Önkal, D., & Lawrence, M. (2006). The effects of structural
characteristics of explanations on use of a DSS. Decision Support
Systems, 42, 1481–1493.
Goodwin, P. (2000). Improving the voluntary integration of statistical forecasts and judgment. International Journal of Forecasting, 16, 85–99. Goodwin, P., & Fildes, R. (1999). Judgmental forecasts of time series affected by special events: does providing a statistical forecast improve accuracy? Journal of Behavioral Decision Making, 12, 37–53. Goodwin, P., Önkal, D., & Thomson, M. (2010). Do forecasts expressed
as prediction intervals improve production planning decisions?
European Journal of Operational Research, 205, 195–201.
Gulati, R. (1995). Does familiarity breed trust? The implications of re-peated ties for contractual choice in alliances. Academy of
Manage-ment Journal, 38, 85–112.
Johnson-George, C., & Swap, W. (1982). Measure of specific interpersonal trust: construction and validation of a scale to assess trust in a specific other. Journal of Personal and Social Psychology, 43, 1306–1317. Levin, D. Z. (1999). Transferring knowledge within the organization in the
R&D arena. Ph.D. Northwestern University.
Levin, D. Z., Cross, R., & Abrams, L.C. (2002). Why should I trust you?
Predictors of interpersonal trust in a knowledge transfer context. Paper
presented at 2002 Academy of Management meetings, Denver. Lim, J. S., & O’Connor, M. (1995). Judgemental adjustment of initial
forecasts: its effectiveness and biases. Journal of Behavioral Decision
Making, 8, 149–168.
Mayer, R. C., Davis, J. H., & Schoorman, F. D. (1995). An integration model of organizational trust. Academy of Management Review, 20, 709–734. McKnight, H., & Kacmar, C. (2006). Factors of information credibility for an internet advice site. In Proceedings of the 39th Hawaii International
Conference on System Sciences.
Montazemi, A. R., Wang, F., Nainar, S. M. K., & Bart, C. K. (1996). On the effectiveness of decisional guidance. Decision Support Systems, 18, 181–198.
O’Connor, M., Remus, W., & Griggs, K. (1997). Going up going down: how good are people at forecasting trends and changes in trends? Journal
of Forecasting, 16, 165–176.
Önkal, D., Gönül, M. S., & Lawrence, M. (2008). Judgmental adjustments of previously-adjusted forecasts. Decision Sciences, 39, 213–238. Önkal, D., Goodwin, P., Thomson, M., Gönül, M. S., & Pollock, A. (2009).
The relative influence of advice from human experts and statistical methods on forecast adjustments. Journal of Behavioral Decision
Making, 22, 390–409.
Önkal, D., Lawrence, M., & Sayım, K. Z. (2011). Influence of differentiated roles on group forecasting accuracy. International Journal of
Remus, W. (1986). Graduate students as surrogates for managers in experiments on business decision making. Journal of Business
Research, 14, 19–25.
Rousseau, D. M., Sitkin, S. B., Burt, R. S., & Camerer, C. (1998). Not so different after all: a cross-discipline view of trust. Academy of
Management Review, 23, 393–404.
Siegrist, M., Gutscher, H., & Earle, T. C. (2005). Perception of risk: the influence of general trust, and general confidence. Journal of Risk
Research, 8, 145–156.
Twyman, M., Harvey, N., & Harries, H. (2008). Trust in motives, trust in competence: separate factors determining the effectiveness of risk communication. Judgment and Decision Making, 3, 111–120. Urban, G. L., Amyx, C., & Lorenzon, A. (2009). Online trust: state of the art,
new frontiers, and research potential. Journal of Interactive Marketing,
23, 179–190.
Vance, A.O. (2009). Trusting IT artifacts: how trust affects our use of
technology. CIS Dissertations. Paper 31. http://digitalarchive.gsu.edu/cis_diss/31.
Wang, W., & Benbasat, I. (2007). Recommendation agents for electronic commerce: effects of explanation facilities on trusting beliefs. Journal
of Management Information Systems, 23, 217–246.
Wang, W., & Benbasat, I. (2005). Trust and adoption of online recom-mendation agents. Journal of the Association for Information Systems,
6, 72–101.
Yaniv, I. (1997). Weighting and trimming: heuristics for aggregating judgments under uncertainty. Organizational Behavior and Human
Decision Processes, 69, 237–249.
Yaniv, I. (2004). Receiving other people’s advice: influence and benefit.
Organizational Behavior and Human Decision Processes, 93, 1–13.
Yaniv, I., & Foster, D. P. (1995). Graininess of judgment under uncertainty: an accuracy-informativeness trade-off. Journal of Experimental
Psy-chology: General, 124, 424–432.
Ye, L. R., & Johnson, P. E. (1995). The impact of explanation facilities on user acceptance of expert systems. MIS Quarterly, 19, 157–172.
Paul Goodwin is Professor of Management Science at the University of
Bath, UK. His research aims to enhance the integration of management judgment and statistical methods in forecasting. He is an Editor of the
International Journal of Forecasting and also edits a column for Foresight: The International Journal of Applied Forecasting.
M. Sinan Gönül is an Associate Professor in the Department of Business
Administration at Middle East Technical University in Ankara, Turkey. He has carried out research into factors that influence judgmental adjustments to statistical forecasts and ways in which the design of forecasting support systems can improve the role of adjustments. He has published in the Journal of Behavioral Decision Making, Decision Sciences,
Decision Support Systems and the Journal of Forecasting.
Dilek Önkal is Dean of the Faculty of Economics, Administrative and
Social Sciences at Bilkent University, Turkey, and is a member of the Board of Directors of the International Institute of Forecasters. Her research focuses on judgmental forecasting, forecasting support systems, probabilistic financial forecasting, risk perception, and risk communication. Her work has appeared in several book chapters, as well as in journals such as Organizational Behavior and Human Decision
Processes, Decision Sciences Journal, Risk Analysis, Decision Support Systems, International Journal of Forecasting, Journal of Behavioral Decision Making, Journal of Forecasting, Omega: The International Journal of Management Science and the European Journal of Operational Research.