PREPARATION, CHARACTERIZATION, AND INVESTIGATION OF
H
2STORAGE CAPACITIES OF PRUSSIAN BLUE ANALOGUES
A THESIS SUBMITTED TO
THE GRADUATE SCHOOL OF ENGINEERING AND SCIENCE OF BILKENT UNIVERSITY
IN PARTIAL FULFILLMENT OF THE REQUIREMENTS FOR THE DEGREE OF MASTER OF SCIENCE IN CHEMISTRY By Büşra Altınsoy July, 2015
ii
PREPARATION, CHARACTERIZATION, AND INVESTIGATION OF H2 STORAGE
CAPACITIES OF PRUSSIAN BLUE ANALOGUES By Büşra Altınsoy,
July, 2015
We certify that we have read this thesis and have found that it is fully adequate, in scope and in quality, as a thesis for the degree of Master of Science.
Assist. Prof. Dr. Ferdi Karadaş (Advisor)
Prof. Dr. Ömer Dağ
Prof. Dr. Şadan Özcan
Approved for the Graduate School of Engineering and Science:
_______________________ Prof. Dr. Levent Onural Director of the Graduate School
iii ABSTRACT
PREPARATION, CHARACTERIZATION, AND INVESTIGATION OF H2 STORAGE
CAPACITIES OF PRUSSIAN BLUE ANALOGUES
Büşra Altınsoy
M.S. in Chemistry
Advisor: Assist. Prof. Dr. Ferdi Karadaş
July, 2015
A convenient and efficient hydrogen storage system is a research challenge since hydrogen storage is one of the most critical steps in hydrogen economy. The media where hydrogen molecule is stored is important not only because of safety but also to generate maximum energy and consume minimum energy during the adsorption-desorption process. Porous coordination polymers have been considered as convenient hydrogen sorbents among other hydrogen storage systems due to their structural properties. Research in this field focused also on porous Prussian Blue Analogues incorporating [Fe(CN)6]3-and [Fe(CN)5NO]3- building blocks due to their
iv easy preparation, and versatilities.
The project discussed herein focuses on the preparation of five new Prussian Blue analogues incorporating [Fe(CN)5NH3]3-and [Fe(CN)5pyrazine]
3-building blocks. It is aimed to improve the porosity and increase the number of polar functional groups on the pore surfaces by substituting one of the cyanide groups with nitrogen donor ammonia or pyrazine group.
M3[Fe(CN)5NH3]2 and M3[Fe(CN)5pz]2 type of Prussian Blue analogues with
M= Cu2+, Ni2+, Co2+ were prepared and characterized by FTTR, XRD and TGA
techniques. The effects of the ligands bound to central cation(Fe2+) and the
type of the outer cation in the framework on the CN- stretching mode in IR
spectrum have been studied. Cu3[Fe(CN)5NH3]2 , Ni3[Fe(CN)5NH3]2,and
Co3[Fe(CN)5NH3]2 compounds have been shown to adopt Fm3mtype structure
similar to classic Prussian Blue analogues. Cu3[Fe(CN)5pz]2 compound has
exhibited four diffraction angles which belong to Fm3m space group and two additional peaks when Ni3[Fe(CN)5pz]2 has exhibited relatively weak diffraction
pattern belonging to Fm3m space group. Thermal stabilities have been discussed and framework changes were observed with increasing temperature. TGA, IR, and XRD techniques have been performed to investigate the structural changes in target materials at different degassing temperatures.
The adsorption profiles of nitrogen and hydrogen have been investigated at two different temperatures based on TGA results. Surface areas and hydrogen uptake capacities of five new Prussian Blue analogues have been
v
studied. Co3[Fe(CN)5NH3]2 showed the highest surface area(243.2 m2/g) while
Ni3[Fe(CN)5NH3]2 showed the highest hydrogen uptake capacity(1.79 wt % H2)
at 95°C among the studied materials. Cu3[Fe(CN)5pz]2 and Ni3[Fe(CN)5pz]2
compounds were observed to exhibit no hydrogen uptake.
It is also observed that surface areas of Co3[Fe(CN)5NH3]2 and
Ni3[Fe(CN)5NH3]2 compounds increased, surface areas of other three
compounds decreased when they are degassed at 225°C. Hydrogen storage capacity is also increased from 1.07 wt % to 1.85 wt % significantly for Co3[Fe(CN)5NH3]2 by increasing the degassing temperature.
vi ÖZET
PRUSYA MAVİSİ BENZERİ YAPILARIN HAZIRLANMASI,
KARAKTERİZASYONU VE HİDROJEN DEPOLAMA KAPASİTELERİNİN ARAŞTIRILMASI
Büşra Altınsoy
Kimya Bölümü, Yüksek Lisans Tezi
Tez Yöneticisi: Assist. Prof. Dr. Ferdi Karadaş
Temmuz, 2015
Hidrojen depolama hidrojenin enerji kaynağı olarak gerekli uygulamalarda kullanılabilmesi için kritik bir basamak. Bu yüzden verimli ve kullanışlı alternatif depolama yöntemlerinin geliştirilmesi ilgi gören bir araştırma konusu. Hidrojenin depolandığı ortam güvenli olmanın yanı sıra depolama ve kullanma sırasında maksimum enerji tasarrufu sağlamalı.
Birçok değerlendirilmiş yöntem içerisinde gözenekli yapılar hidrojen depolama için iyi bir aday olarak görülüyor. Geçiş metallerinin [Fe(CN)6]3-ve
[Fe(CN)5NO]3-gibi yapıtaşları ile tepkimeleri sonucu sentezlenen gözenekli
vii
dayanıklı oldukları, kolay hazırlandıkları ve çok amaçlı oldukları için bunların hidrojen depolamaları ile ilgili birçok araştırma yapıldı.
Bu tez çalışmasında, yapıdaki gözenekleri ve gözeneklerde fonksiyonel polar grupları arttırmak amacıyla önceden çalışılmış yapıtaşlarındaki siyanürün başka bir grupla değitirilerek, M3[Fe(CN)5NH3]2 ve M3[Fe(CN)5pz]2 tipi beş farklı
Prusya mavisi benzeri yapının sentezine odaklanıldı.
Metalin Cu2+, Ni2+ veya Co2+ olduğu, Prusya Mavisi benzeri yapılar
sentezlendi ve ATR, XRD, TGA spektroskopileri ile karakterizasyonları yapıldı. Yapının iç tarafındaki metale(Fe2+) bağlı ligandların ve dış taraftaki metalin
çeşidinin IR spektroskopi sonuçlarına etkisi tartışıldı. Cu3[Fe(CN)5NH3]2 ,
Ni3[Fe(CN)5NH3]2 ve Co3[Fe(CN)5NH3]2 bileşiklerinde Prusya Mavisi benzeri
yapılarda genelde görülen Fm3m tipi yapı gözlemlendi. Cu3[Fe(CN)5pz]2
bileşiğinde Fm3m tipi yapıyı işaret eden dört kırılma açısı gözlemlenirken Ni3[Fe(CN)5pz]2 bileşiği Fm3m tipi yapıyı gösteren ama daha zayıf bir kırılma
paterni gösterdi. Ölçümlerde sıcaklık değiştirilerek malzemelerin sıcaklığa dayanıklıkları ve bazı iskelet değişiklikleri gözlemlendi. Sıcaklığa bağlı yapı değişiklikleri de XRD, FTIR ve TGA spektroskopi sonuçları kullanılarak tartışıldı.
Yapıların iki farklı sıcaklıkta nitrojen ve hidrojen gazlarını yüzeylerinde tutma kapasiteleri araştırıldı. Beş yeni Prusya mavisi benzeri yapının yüzey alanları ve hidrojen tutma kapasiteleri çalışıldı. 95°C sıcaklıkta vakumlanan örnekler arasında Co3[Fe(CN)5NH3]2 bileşiği en yüksek yüzey alanına(243.2 m2/g)
viii
sahipti. Cu3[Fe(CN)5pz]2 ve Ni3[Fe(CN)5pz]2 örnekleri için hidrojen tutma
ix
Acknowledgements
The completion of this work would not be possible without help and support of many people who deserve to be thanked here.
Firstly, I would like to express my gratitude to my supervisor Assist. Prof. Dr. Ferdi Karadaş who gave me the opportunity to work in his group. I am thankful for his excellent supervision demonstrating belief in the topic, guidance, unrelenting support and patience during my M.S. studies.
I appreciate that Prof. Dr. Ömer Dağ and Prof. Dr. Şadan Özcan accepted to be my thesis committee members. I certainly had dealt with many problems thanks to useful conversations and prompt feedbacks of Prof. Dr. Ömer Dağ in this work.
I want to express my special thanks to Vijay for his contributions to the work and his partnership in my research. I will not forget how he has been a great help for me to take care of the points that I was struggling desperately to represent during my research.
I want to thank our group members and enjoyable friends; Aysun Tekin, Merve Demirkıran, Hazal Tiryaki, Pınar Alsaç and Seray Bulak.
In addition to my colleagues, I want to thank my sincere friends Hafsa, Hale, Arzu, Alexandra Zehra, Elif, Ayşe Nur, Zeynep, Merve for their encouragements and supports during my research and every time I need.
x
Last, and forever I owe my thanks to my beloved parents, Hayri and Hanife Altınsoy, their precious children for their endless love, supports and encouragements.
xi
Contents
Chapter 1:Introduction ... 1
Chapter 2: Background and Related Works ... 3
2.1. Hydrogen Storage ... 3
2.2. Hydrogen Storage Techniques ... 5
2.2.1. Chemisorption ... 7
2.2.2. Physiosorption ... 10
2.2.2.1. Metal-Organic Frameworks (MOFs) ... 10
2.2.3. Prussian Blue Analogues (PBAs)... 12
2.2.4. Metal Nitroprussides (MPCMs) ... 20
Chapter 3:Experimental ... 24
3.1. Sample Preparation ... 24
3.1.1. Syntheses of Prussian Blue Analogues Constructed from [Fe(CN)5NH3]3– Building Blocks ... 24
3.1.1.1. Synthesis of Na3[Fe(CN)5NH3] Compound ... 24
3.1.1.2. Synthesis of M3[Fe(CN)5NH3]2 Complexes ... 25
3.1.2. Syntheses of Prussian Blue Analogues Constructed from [Fe(CN)5pz]3– Building Blocks ... 26
xii
3.1.2.1. Preparation of Pentacyano Pyrazine Ferrate Salt ... 26
3.1.2.2. Synthesis of M3[Fe(CN)5pz]2.nH2O Complexes ... 27
3.2. Instrumentation... 28
3.2.1. FTIR Spectroscopy: The Attenuated Total Reflectance (ATR) ... 28
3.2.2. Powder X-ray Diffraction (PXRD) ... 28
3.2.3. Thermogravimetric Analysis (TGA) ... 29
3.2.4. N2-sorption measurements ... 29
Chapter 4: Characterization and Gas Sorption Properties of Prussian Blue Analogues Constructed from [Fe(CN)5NH3]3– Building Blocks ... 30
4.1. Fourier Infrared Spectra Transform ... 30
4.2. XRD Patterns of pentacyanoamminoferrate(II) metallates ... 34
4.3. Thermo-gravimetric analysis ... 35
4.3.1 Cu3[Fe(CN)5NH3] 2 .nH2O ... 35
4.3.2. Ni3[Fe(CN)5NH3] 2 .nH2O ... 37
4.3.3. Co3[Fe(CN)5NH3] 2 .nH2O ... 38
4.4. Thermal stabilities and dehydration degrees ... 39
4.4.1. Cu3[Fe(CN)5NH3] 2 .nH2O ... 40
4.4.2. Ni3[Fe(CN)5NH3] 2 .nH2O ... 42
4.4.3. Co3[Fe(CN)5NH3] 2.nH2O ... 45
xiii
4.5.1. N2 isotherm of complexes degassed at 95oC ... 48
4.5.2. N2 isotherm of complexes degassed at 250oC ... 50
4.6. H2 adsorption analysis ... 53
4.6.1. H2 isotherm of complexes degassed at 95oC ... 53
4.6.2. H2 isotherm of complexes degassed at 250oC ... 54
Chapter 5:Prussian Blue Analogues Incorporating [Fe(CN)5pz]3– (pz= pyrazine) Building Blocks ... 56
5.1. Synthesis of [Fe(CN)5L]3 – complexes ... 56
5.2. Characterization and Gas Sorption Properties of Prussian Blue Analogues Constructed from [Fe(CN)5pz]3– (pz= pyrazine) Building Blocks ... 57
5.2.1. Infrared Spectroscopy Studies ... 57
5.2.2. X-Ray Diffraction Studies ... 62
5.2.3. Thermal Stabilities and dehydration degrees ... 64
5.2.4. BET Surface Area Analysis ... 69
Chapter 6:Conclusion ... 72
Bibliography ... 75
Appendix A: Infrared Spectral Trends In Cyanide Compounds ... 78
xiv
List of Figures
Figure 1. A general review of hydrogen storage techniques that are in process
by gravimetric and volumetric capacities.. ... 5
Figure 2. a. The MOF-5 extended framework; ZnO4 tetrahedra (blue polyhedra) connected by benzene dicarboxylate linkers (O, red and C, black). Yellow sphere represents the pore present inside the network. b. The topology of the structure; a primitive cubic network shown with a ball-and-stick model……….11
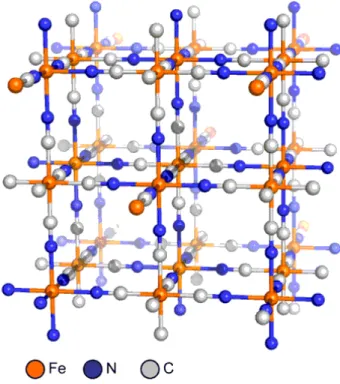
Figure 3. 3D structure of Prussian Blue. ... 13
Figure 4. X-ray powder diffraction data for M3[Co(CN)6]2 .15H2O.The broad peak at 13° is due to scattering from the sample holder………...…………...15
Figure 5. Structure of M[Fe(CN)5NO] compounds showing the porous nature of the framework. Two types of pores available are created due to the absence of M2+ ions (upper right cube) and [Fe(CN) 5NO] ions (lower left cube). Key: Fe (yellow), C(violet), N (gray), O (red), M (blue). ... 22
Figure 6. FTIR spectra of CN stretching region(left) and full spectrum(right) for M3[Fe(CN)5NH3]2• nH2O complexes...32
Figure 7. X-ray diffraction data for M3Fe2 complexes……… …… 34
Figure 8. Thermogravimetric curve of Cu3Fe2 complex………..……..36
xv
Figure 10. Thermogravimetric curve of Co3Fe2 complex. ... 38
Figure 11. FTIR spectra of Cu3Fe2 complex (a)as synthesized, and degassed
(b)95°C, (c) 150°C, (d) 200°C (e) 225°C for 3 hours under
vacuum……….………..40 Figure 12. XRD patterns of Cu3Fe2 compound a as synthesized b after heat
treatment at 95………..42 Figure 13. FTIR spectra of Ni3Fe2complex (a) as synthesized, and degassed (b)
95°C, (c) 150°C, (d) 200°C (e) 225°C for 3 hours under
vacuum………...43
Figure 14. XRD patterns of Ni3Fe2 compound a as synthesized b after heat
treatment at 95°C………...45
Figure 15. FTIR spectra of Co3Fe2complex (a) as synthesized complex, and
degassed (b) 95°C, (c) 150°C, (d) 200°C (e) 225°C for 3 hours under
vacuum………...46
Figure 16. XRD patterns of Co3Fe2 compound a. as synthesized
b. after heat treatment at 95°C……….47 Figure 17. Nitrogen adsorption and desorption isotherms for PB analogues at 77 K after heat treatment at 95°C. ... 49 Figure 18. Nitrogen adsorption and desorption isotherms for PB analogues at 77 K after heat treatment at 250°C ... 51 Figure 19. Hydrogen adsorption isotherms for PB analogues at 77 K after heat treatment at 95°C………...53
xvi
Figure 20. Hydrogen adsorption isotherms for PB analogues at 77 K after heat treatment at 250°C………...54 Figure 21. Structure of Na3[Fe(CN)5pz]….. ……….57
Figure 22. ATR full spectrum of a)Na3[Fe(CN)5Pz].nH2O b)[NiFe-pz] and c)
[CuFe-pz] compounds. ... 58 Figure 23. . X-ray powder diffraction pattern for a) [CuFe-pz],b)[CuFe-pz] after being vacuumed at 95 °C for 24 hours and gas sorption studies, and c)[CuFe-pz]
after being vacuumed at 250°C for 24 hours and gas sorption studies. ... 62
Figure 24. -ray powder diffraction data for a) [NiFe-pz] complex, b) [NiFe-pz]
after vacuumed at 95 °C for 24 hours and gas sorption studies, and c) [NiFe-pz]
after vacuumed at 250°C for 24 hours and gas sorption studies………..…63
Figure 25. Thermogravimetric curve of cluster [CuFe-pz]….. ... 64 Figure 26. ATR full spectrum of a) [CuFe-pz], b) [CuFe-pz] after heat treatment at
95°C c) [CuFe-pz] after heat treatment at
250°C………...65
Figure 27. Thermogravimetric curve of Ni3[Fe(CN)5pz]2·xH2O complex. ... 67
Figure 28. ATR full spectrum of a) [NiFe-pz], b) [NiFe-pz] after heat treatment at
95°C, and c)[NiFe-pz] after heat treatment at
250°C………...…… 68 Figure 29. Nitrogen adsorption-desorption isotherms at 77 K for M3[Fe(CN)5pz]2·xH2O ..………69
xvii
Figure 30. Nitrogen adsorption-desorption isotherms at 77 K for Cu3[Fe(CN)5pz]2·2.5H2O compound after degassed at
95°C………71
Figure 31. Representation of π-back bonding from a d π orbital to the p π* of C………...….. 78
xviii
List of Tables
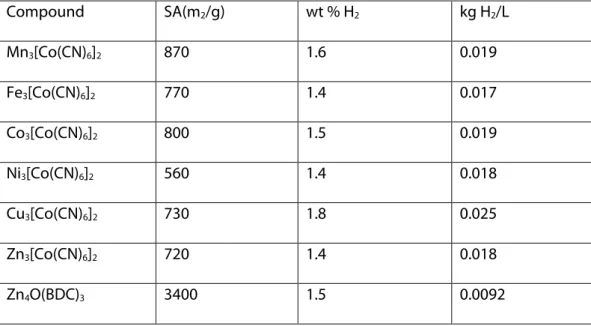
Table 1. Sorption Properties of Dehydrated Prussian Blue Analogues and Zn4O(BDC). ... 16
Table 2. Results Derived from the H2 Adsorption Isotherms Fitted According to
the Langmuir Freundlich Model………..……..23 Table 3. Colors of the synthesized complexes ... 26 Table 4. FTIR Stretching and Bending Bands for M3[Fe(CN)5NH3]2• nH2O
complexes. ... 33 Table 5. Calculated surface area, pore volume and pore width values for the M3Fe2 samples degassed at 95°C. ... 50
Table 6. Calculated surface area, pore volume and pore width values for the M3Fe2 samples degassed at 250°C. ... 52
Table 7. ATR bands of copper and nickel containing PB analogues. ... 59 Table 8. Calculated surface area, pore volume and pore width values for the M3Fe2-pz samples degassed at 95°C ... 70
Table 9. Calculated surface area, pore volume and pore width values for the M3Fe2-pz samples degassed at 250°C. ... 71
Table 10. IR adsorptions (cm-1) of previously studied materials in
1
Chapter 1:
Introduction
H2 storage has seen a significant research and commercial thrust
particularly over the past two decades due to rise in global energy needs and environmental concerns. Solid adsorbents have received intense interest because of the potential they have demonstrated in hydrogen storage field since no regeneration energy is required to remove H2 and they are robust
even at extreme conditions. Even though promising developments have been made with the means of both theoretical and experimental research groups, the field continues to lag because of a missing link between current research and near future commercialization of an efficient porous material that exhibits high H2 storage capacities at ambient conditions. Thus, new systems should be
designed, prepared, and studied systematically to achieve this goal. Herein this project, this issue will be addressed by introducing extended networks incorporating cyanide (CN–) bridging groups.
One of the well-known examples of cyanide clusters is Prussian Blue analogues (PBAs) that represent a large family of compounds based on a cubic M’[M(CN)6] (M’= Cr3+, Mn2+,Fe2+/3+, Co2+/3+, Ni2+, Cu2+, Zn2+, and M= Fe2+/3+, Co2+/3+,
Cr3+, Mn2+) framework, in which metal ions are connected through cyanide
2
reasons; a) the framework provides its charge balance by creating vacancies, which improves the porosity of network, b) exposed metal centers are generated that could interact with adsorbed H2 molecule.
Contrary to the previously applied synthetic methods that include the reaction of hexacyanometalate complexes with transition metal ions, pentacyanometalate ions with ammonia and pyrazine ligands have been used to prepare novel extended networks. It is aimed to use this rich chemistry to prepare extended porous networks. Similar to the synthesis of PBAs, pentacyanometalate complexes have been reacted with divalent transition metal ions to prepare porous extended networks. The general objective of this study is to improve the porosity of PBAs by introducing extra vacancies inside the framework due to the ability of ammine ligand to connect only one metal center. Complexes have been characterized with XRD, FTIR, and TGA techniques.
Pore analysis as well as the H2 adsorption measurements has been
performed. N2 adsorption is used to determine the surface areas(m2/g) and
pore volumes(cm3/g) of the complexes by using BET analysis method.
Adsorption measurements have been performed in the 0 to 1 bar range at 77 K to compare H2 storage capacities of family of compounds with those that have
3
Chapter 2:
Background and Related Works
2.1. Hydrogen Storage
While energy demand increases with the increase of the world population, supply of fossil fuels (natural gas, oil and coal which are currently primary energy sources) are limited. In addition, usage of fossil fuels (like in transportation industry as burning gasoline in vehicles) increases emissions of greenhouse gases that pollute the environment [1].Therefore cleaner, more renewable and sustainable energy sources are significantly demanded.
Although hydrogen has the highest energy density (143.0 MJ/kg) of common fuels by weight (three times larger than that of the other kind of fuel) gaseous hydrogen has the lowest energy density by volume (0.0108 MJ/L). The energy density of hydrogen is 4.4 MJ/L at 10000 psi while the energy density of gasoline is 31.6 MJ/L. Hydrogen is currently stored by mechanical means (compression and liquefaction) that are expensive and not suitable for mobile applications. Therefore, safe, inexpensive, and energy efficient alternative hydrogen storage methods should be developed other than conventional methods including compression and cooling [2, 3].
Hydrogen energy can be used for stationary or portable power, transportation, and industrial applications. Each application has specific
4
market-driven requirements. Different mechanisms are being researched to find an appropriate method for hydrogen storage. In July 2013 the US Department of Energy (DOE), updated key challenges for hydrogen storage systems. The requirements and goals for the performance of the storage system are noted as:
2.0 wt % hydrogen and 0.030 kg hydrogen/L by 2015, 5.5 wt % and 0.040kg/L by 2017,
3.0 wt % hydrogen and 0.040 kg hydrogen/L at a lower cost by 2020, 7.5 wt % hydrogen and 0.070 kg hydrogen /L as the ultimate target.
An ideal hydrogen storage system, which is projected for onboard storage systems that can supply 5.6 kg of usable hydrogen, must have an operating temperature between -40 and 60 ºC with a maximum delivery pressure of 100 bar in addition to shortened refueling time, faster operational rate(like 5kg within 3 min.), reversibility of hydrogen storage systems with a 1500 operational cycle life, and low cost(which is currently too high). Also safety, public acceptance, standardized hardware, and operating procedures are required.
Each storage mechanism has own limits and no hydrogen storage method presently meets all DOE standards and technical challenges which must be resolved for specific applications (“Multi-Year Research, Development and Demonstration Plan”)[4]. The current performance metrics of various
5
hydrogen storage systems under development is shown below (“Status of Hydrogen Storage Technologies”)[5].
Figure 1. A general review of hydrogen storage techniques that are in process by
gravimetric and volumetric capacities.
2.2. Hydrogen Storage Techniques
Hydrogen can be physically stored as either compressed gas or cryogenic liquid. Vehicles that would have traditional compressed gas hydrogen tanks can’t travel enough distance because physical storage systems have low volumetric and gravimetric capacities. Compressed gas storage requires high pressure tanks (up to 700 bars) to achieve greater driving range by increasing hydrogen volumetric and gravimetric densities but they would
6
be too heavy to use in mobile applications and they would not be cost effective. Current research focuses on reducing the weight and volume of compressed gas systems.
Higher hydrogen densities are possible for cryogenic liquid storage in insulated (to prevent hydrogen loss) tanks but it requires energy to achieve cryogenic temperatures (cooled to -253°C, at pressures of 6-350 bar) due to low boiling point of hydrogen [6].
Besides traditional physical storage methods, hydrogen can be stored alternatively in materials, which include chemical hydrides and solid adsorbents. Although hydrogen storage via solid materials makes it possible to have greater gravimetric and volumetric densities than mechanical storage systems by binding tightly hydrogen with other elements in a compound, the accessibility of hydrogen is low.
The interaction of hydrogen with matter and storage mechanisms in materials should be studied to be able to perform requirements of promising hydrogen storage systems. Hydrogen can be stored in solids by absorption or on the surfaces of solids by adsorption. In absorption dissociated H-atoms are incorporated into solid. In adsorption, there are mainly two ways that hydrogen interacts with the surface of a material either as hydrogen molecules (physisorption) or hydrogen atoms (chemisorption). Physiosorption process is a result of Van der Waals forces between H2 molecules and surface while
7
chemisorption process involves the disassociation of H2 molecule to bind
chemically to the material surface. Given that H2 storage technology requires a
regeneration energy in the 0.1 - 1 eV range to work at ambient temperatures and pressures, both of these processes are not suitable for H2 storage
applications since the binding energy of the former process is very small (in the meV range) and that of the latter is high (in the 2 - 4 eV range). Thus, current research in this field focuses either on decreasing binding energy for chemisorption process or improving the binding in physiosorption process [7].
2.2.1. Chemisorption
In the case of chemisorption, atomic hydrogen binds strongly adsorbents surfaces with a chemical bond which has 2-4 eV energy, which results in high regeneration temperatures that are needed to break chemical bond. Thus, one of the main challenges in this field is to decrease the regeneration temperature by using metal hydrides that could decompose relatively at lower temperatures [3].
Chemical hydrides have higher energy density than mechanical storage systems since they have considerable amount of hydrogen in their chemical composition. Metal borohydrides and aluminohydrides are common examples of chemical hydrides.
Energy cost of metal hydride formation and release of hydrogen should be low to use metal hydride effectively for hydrogen storage. Although some level of instability is necessary for hydrogen storage materials to be able to
8
release hydrogen without a large energy input, enthalpies of formation is very high when they are unstable. Loading or releasing hydrogen depend on temperature and pressure. As a result the materials having greater hydrogen uptake capacity at relatively close to room temperature and atmosphere are desirable.
One of the main criteria for metallic hydrides is that they should be lightweight to have greater gravimetric density. It is, however, more difficult to store hydrogen in lightweight materials. Nearly 9 wt % gravimetric capacity could be achieved by lithium, boron, and aluminum based hydrides.
Many binary metal-hydrides that are available in the literature could not be used as solid adsorbents in this field since they have low gravimetric capacities. Thus, recent research focuses on the investigation of adsorption/desorption kinetics of different metal hydrides while keeping high gravimetric and volumetric storage capacities. Alane (aluminiumhydride, AlH3)
is the most promising chemical hydride with 10.1 wt% hydrogen density.
One of the classes of chemical hydrides is intermetallic hydrides where there are at least two different metal ions in the structure. One of the metals in intermetallic hydrides binds strongly to hydrogen while interaction between other metals and hydrogen is weak. Intermetallic hydrides have low gravimetric densities and high costs. They can adsorb and desorb hydrogen at low pressure and temperatures close to room temperature, which is unusual for conventional metal hydrides. Intermetallic hydrides including an alane group,
9
have been intensively studied. Sodium analate with 3.7 wt% hydrogen capacity at 1atm and 306K is one of the common examples of them[2].
Another class of hydrides that received much attention in this field are complex metal hydrides, in which polyatomic(complex) anion containing hydrogen atoms is bound to cationic metal generally by ionic bonds and covalently bound to other metal(s). It results in the formation of hydrides with intermediate stability. They generally possess higher gravimetric densities than simple hydrides. Well-known examples of complex hydrides include nitrogen-containing (amides or imides), boron-nitrogen-containing (borohydrides), and aluminum-containing (alanates) hydrides. They are generally bound to light atoms such as lithium, sodium, or magnesium metals. It is foreseen that NaAlH4and LiBH4can show high theoretical hydrogen gravimetric capacity of
5.5wt% and 18.0 wt%, respectively [2].These hydrides are, however, currently not considered as suitable hydrogen storage materials. The system volumetric capacity is quite low for NaAlH4 and dehydrogenation takes place in two steps
at high temperatures (539K and 674K). In the case of LiBH4, temperatures
greater than 673 K are required for dehydrogenation. Researchers seek to overcome poor thermodynamics, kinetics, and reversibility of the materials. For example, it has been found that the addition of Ti compounds can catalyze rehydrogenation by bringing down the first dehydrogenation temperature to 424 K [2].
10 2.2.2. Physiosorption
Hydrogen binds as molecule to the substrate surface by weak van der Waals interactions with energy in meV range so desorption takes place reversibly at very low temperatures in the case of physiosorption.
Sorbent materials includes carbon-based materials, metal-organic frameworks (MOFs), isoreticular metal-organic frameworks(IRMOFs), covalent-organic frameworks (COFs), zeolites, porous aromatic frameworks (PAFs) , mesoporous silica and clathrates [3].
Current research focuses on investigating and modifying(e.g. increasing pore volume and surface area) sorbent materials, in which interactions between hydrogen atoms and substrate surfaces are stronger since the interaction strength is weak in physiosorbed materials[3].Some of these solid adsorbents are briefly explained herein.
2.2.2.1. Metal-Organic Frameworks (MOFs)
Metal organic frameworks (MOFs) are composed of three dimensional clusters of the first-row transition metal ions bridged by simple organic moieties, in which the linking functionality is generally cyanide, pyridyl, phosphate, or carboxylate groups. The number of available sites on the metal, metal clusters, ligands, and relative orientations of these binding sites affect characteristics of the materials such as porosity and gas sorption nature.
11
MOF-2 and MOF-5were the first successful designs of rigid frames constructed by reacting metal ions with dicarboxylate bridging ligands.
Complicated structures can also be targeted by using different secondary building units (SBUs) and appropriate linkers in addition to simple, high-symmetry default structures. Large size of SBUs lead to porous (mainly microporous) frameworks in which gas particles are reversibly adsorbed, between metal centers. For example, MOF-5 (Zn4O(BDC)3) possesses SBUs and
benzene links are relatively large and rigid entities with exceptional porosity(Figure 2) [8].
.
Figure 2. a. The MOF-5 extended framework; ZnO4 tetrahedra (blue polyhedra) connected by benzene dicarboxylate linkers (O, red and C, black). Yellow sphere represents the pore present inside the network. b. The topology of the structure; a primitive cubic network shown with a ball-and-stick model.
12
MOFs could be designed to be crystalline materials with high stability and permanent porosity. These coordination polymers have large internal surface areas, typically around 3000m2/g and pore volumes (1-2 cm3/g). The
fact that free volumes obtained in MOF series generally exceed that found in zeolites make them ideal candidates in the field of gas adsorption[8].
MOFs were considered as potential candidates for hydrogen storage based on their stability and porosity, hence, well defined hydrogen occupation sites. Remarkable hydrogen storage capacities have been observed as expected for different MOFs at 77 K depending on surface area and pore volume. For example, a gravimetric hydrogen uptake value of 7.5 wt% was obtained for MOF-177 that has 3000m2/g BET surface area has been measured at
70 bar.Different adjustments to networks have also been performed to enhance the hydrogen storage capacity of MOFs [9].
2.2.3. Prussian Blue Analogues (PBAs)
The introduction of first synthetic coordination compound dates back to the early 18th century. Transition metal cyanides are well-known type of porous coordination polymers where metals are bridged through linear cyanide groups. PBAs could easily be obtained by reacting hexacyanometal complexes with transition metal ions.
Prussian Blue has a startling blue color, which is originated from cooperative interaction of the iron ions in Prussian blue( [Fe4[Fe(CN)6]3].x H2O )
13
because it absorbs light in a spectral region which is different than the colors of Fe3+(aq) or [Fe(CN)6]4−(the reactants of Prussian blue formation).
There coexists four Fe(III) and three Fe(II) valances in Prussian Blue structure and it is known as a mixed valence compound. Because of the 4:3 ratio of valances, 25% of its [Fe(CN)6]4−sites are vacant. This provides positions
for water molecules to complete octahedral coordination spheres. Prussian Blue is a semiconductor and below 5.5 K it becomes a ferromagnetic mainly due to partial delocalization of the valance electrons [10].
Its structure was determined by X-ray diffraction first in 1977 to reveal a cubic lattice, a mixed-valent Fe(II)/Fe(III) network with Fe(II)−carbon distances of 1.92 Å and Fe(III)−nitrogen distances of 2.03 Å (Figure 3) [11].
14
PBAs exhibit M4[M’(CN)6]3 ,M3[M’(CN)6]2 or M2[M’(CN)6]type structures
based upon the cubic M[M’(CN)6] structure(as Prussian Blue itself) wherein
charge balance of the metals create vacancies at octahedral([M’(CN)6]n−) sites
that can be completed with water molecules [12].
Prussian Blue analogues are promising materials in gas storage due to their microporous structure. Reversible H2 uptake has been studied in Prussian
Blue analogues having grater surface, volumetric and gravimetric densities, and lower enthalpies of adsorption than those which are reported for MOF 5.
Kaye and Long reported dehydrated Prussian Blue analogues with the formula, M3[Co(CN)6]2,wherein open metal (M(II)) coordination sites increase
hydrogen affinities of porous framework. Divalent metal ions (M(II) = Mn, Fe, Co, Ni, Cu, Zn) have been reacted with [Co(CN)6]3−complex because of its
greater stability than [Cr(CN)6]3−, [Mn(CN)6]3−, and [Fe(CN)6]3−complexes.
The X-ray diffraction patterns of all products show similar crystal structure and revealed that they crystallize in Fm3m space group as in usual Prussian Blue(Figure 4)[13] however Ni3[Co(CN)6]2 .15H2O displays broaden diffraction
15
Figure 4.X-ray powder diffraction data for M3[Co(CN)6]2 .15H2O.The broad peak at 13° is due to scattering from the sample holder[13]
The BET surface areas for Ni3[Co(CN)6]2 has lowest and that
ofMn3[Co(CN)6]2 has the highest surface area ranging from 560 m2/g to 870
m2/g. Small differences in surface area are claimed to be as a result of
differences in unit cell volumes. PBAs mentioned above show significant hydrogen sorption at 77 K and 1 bar varying from 1.4 wt% in Zn3[Co(CN)6]2 to as
16
Table 1. Sorption Properties of Dehydrated Prussian Blue Analogues and Zn4O(BDC)3
Compound SA(m2/g) wt % H2 kg H2/L Mn3[Co(CN)6]2 870 1.6 0.019 Fe3[Co(CN)6]2 770 1.4 0.017 Co3[Co(CN)6]2 800 1.5 0.019 Ni3[Co(CN)6]2 560 1.4 0.018 Cu3[Co(CN)6]2 730 1.8 0.025 Zn3[Co(CN)6]2 720 1.4 0.018 Zn4O(BDC)3 3400 1.5 0.0092
Karena W. Chapman and her co-workers reported reversible sorption of hydrogen gas in dehydrated Prussian Blue analogous of the type M3[Co(CN)6]2similar to Kaye’s work, where M(II) is Mn, Fe, Co, Ni, Cu, Zn, Cd.
Their sorption isotherms also exhibits reversible behavior expected for a microporous material while their hydrogen storage capacity trend was different than Kaye’s work.
At 20.5 K and 1 atm hydrogen uptake of phase A of the Prussian Blue analogues: ACd.4.8{H2} > AZn.3.5{H2},ANi.3.3{H2} > AMn.3.0{H2}, ACo.3.1{H2}
> AFe.2.1{H} > ACu.1.1{H2}[15] None of the aforementioned groups noted a
correlation between hydrogen storage capacity and surface area. It was already believed that the total hydrogen uptake depends not only on surface area but also on binding enthalpy.
17
Unsaturated metal centers were hypothesized to lead greater hydrogen adsorption by modification of the framework particularly creating vacancies. Therefore, Kaye and Long et al. measured porosity and hydrogen storage capacities of new Prussian Blue analogues with varying concentrations of framework vacancies [12]. While M3[M’(CN)6]2 type analogues have 33%
vacancies,M2[M’(CN)6]type may even contain 50% vacancies at octahedral sites.
Ga[Co(CN)6], Fe4[Fe(CN)6]3 ,M2[Fe(CN)6] (M = Mn, Co, Ni, Cu), and Co3[Co(CN)5]2
have also been compared with those previously studied. The XRD patterns and elemental analysis confirmed the composition and structure of Prussian Blue analogues. Hydrogen adsorption studies were performed for Ga[Co(CN)6].Although it has no open coordination sites it exhibits similar
enthalpy of adsorption with that of Cu3[Co(CN)6]2,which indicates that open
coordination sites do not affect the strength of the interaction between hydrogen and the framework. On the other hand, variations observed in hydrogen uptake behavior of PBAs studied can be interpreted as a function of vacancies at octahedral sites upon dehydration. Variations in enthalpy of adsorption of PBAs also demonstrate the dependence of the strength of the interaction on the type of metal centers. It could, therefore, be concluded that materials containing metal sites that have higher affinities for hydrogen due to their electronic character can enhance the enthalpy of adsorption.
In 2006 both of the aforementioned groups continued to study the nature of the hydrogen adsorption in more detail for the development of more efficient Prussian Blue analogues. Adsorption behavior in Cu3[Co(CN)6]2 was
18
studied by Kaye’s and Hartman’s groups using high-resolution neutron powder diffraction with varying amounts of adsorbed hydrogen and neutron vibrational spectroscopy to follow changes in the local binding environment of the adsorbed hydrogen. Hydrogen adsorption was observed at two sites within the framework. The most favored adsorption site, accounting for ∼75% of the hydrogen adsorbed at the loading, was crystallographic site (1/4, 1/4, 1/4) that is an interstitial location and second adsorption site was coordinatively unsaturated metal sites where hydrogen molecules prefer to be adsorbed at higher defect levels [16]. The interactions between the framework and hydrogen in Mn3[Co(CN)6]2 was investigated by Chapman and co-workers
using a differential pair distribution function (PDF) analysis of high energy X-ray that probes molecular scale interactions arising from hydrogen-framework or hydrogen-hydrogen interactions and neutron scattering data. They, however, suggested that hydrogen molecule is adsorbed at the same crystallographic site, (1/4, 1/4, 1/4), which van der Waals interaction is strong within pore surfaces without an evidence for preferred binding at accessible metal sites. They concluded that different sorption enthalpies of isostructural analogues having varying vacancies can be due to sample microstructure [17].
Hydrogen adsorption is studied for different copper samples (Cu3[Ir(CN)6]2, Cu3[Fe(CN)6]2, Cu2[Fe(CN)6], Cu[Pt(CN)6], and Cu3xMnx[Co(CN)6]2)
since adsorption of hydrogen is higher for Prussian Blue analogues incorporating copper sites. Hydrogen uptake capacity is found to be higher for the compounds where hydrogen and copper atoms have more interactions.
19
They suggest that the difference can be explained by coordination bond of hydrogen molecule with the copper atom [18].
The capability of guest alkali metal cations to increase hydrogen adsorption enthalpy by interacting hydrogen within microporous coordination solids is studied by Kaye and Long [19]. They reported the hydrogen storage properties for zinc-ferrocyanide compounds of type A2.Zn3[Fe(CN)6]2.xH2O (A =
H, Li, Na, K, Rb) upon dehydration. They observed decomposition for compounds, in which A = H and Li and maximum adsorption enthalpy was observed as 9.0 kJ.mol-1 for A = K. Is has also been observed that adsorption
enthalpy depend on the type of cation, A. Furthermore binding enthalpies of PBAs studied were reported to be higher than those studied previously even though surface areas are lower.
They drew a conclusion that guest alkali metal cations increase the strength of H2 interactions based on the hydrogen adsorption isotherms by
comparing them with the results obtained for PB analogues reported before. Cations enhance enthalpy directly or by providing hydrogen molecule to have more interactions with the walls of framework [19].
The hydrogen binding affinity to framework for the family of KM[Cr(CN)6]·H2O (M = Zn, Mn, Fe), porous compounds with K+ located within
the cavities of frameworks has also been studied. Hydrogen sorption profile of PBAs where metal center is replaced with another has been reported. Hydrogen uptake was moderate in the case of M = Fe even though surface area
20
is just 289 m2/g at 77 K. They demonstrated that metal cation in the voids can
enhance hydrogen interactions within the framework [20].
2.2.4. Metal Nitroprussides (MPCMs)
Nitroprussides, which are a class of microporous metal cyanides, are one of the most common nitrosyl complexes. They contain [Fe(CN)5NO]2- anion
complex as well as transition metal cations.
Nitroprussides have less pores, thus more selective than hexacyanometalates since they have no vacancies. The system, however, has additional small pores due to unlinked NO ligand or dehydration of water molecules that completes octahedral coordination sphere of cation [21].
They can be obtained as single crystals or as poly-crystalline powders with different hydration degrees depending on the preparation method [22].
Crystal structure of powder materials have been characterized by powder XRD to have cubic (Co2+, Ni2+) or face-centered cubic (Mn2+, Fe2+, Co2+,
Ni2+ and Zn2+) unit cells. Cadmium derivative has been characterized as
orthorhombic and the Copper derivative as tetragonal unit cell. Single crystals have different structures: monoclinic for Mn2+, Fe2+, Cd2+; fcc for Co2+;
orthorhombic for Cu2+; and hexagonal for Zn2+.
When nitroprussides are aged, they get dehydrated at different degrees and their crystal structures change. Change in structure of metal nitroprussides are studied intensively in course of time by Gomez and Reguera[21,23,24,25];
21
orthorhombic (Pnma) dihydrates for Mn2+, Fe2+, Cu2+, Cd2+, and Zn 2+ and
face-centered cubic (Fm3m) tetrahydrates for Co2+ and Ni2+are the stable phases [23].
Nitroprussides show divergent crystalline structures and adsorption sites similar to those found in hexacyanocobaltates. Therefore, they can be studied to understand the effect of topology on hydrogen adsorption. Cobalt and nickel nitroprussides have channel topologies (cubic crystal structure) and, thus have high hydrogen uptake capacity.M2+ vacancies induce small pores
while [Fe(CN)5NO]2- vacancies that are created to provide charge balance
induce larger cubic pores to the framework which is illustrated in Figure 5[26]. Pores are filled by water, which can be removed by dehydration. The pores present in nickel and cobalt nitroprussides have potential for hydrogen storage. The N2-sorption BET surface areas are 634 m2/g for Ni and 523 m2/g for
Co derivative. Hydrogen uptake capacities have been reported as 1.68 wt % and 1.61 wt % for nickel and cobalt derivatives, respectively at 77K. It is smaller at 87 K; 1.43 wt % and 1.33 wt %, respectively.
22
Figure 5.Structure of M[Fe(CN)5NO] compounds showing the porous nature of the framework. Two types of pores available are created due to the absence of M2+ ions (upper right cube) and [Fe(CN)5NO] ions (lower left cube). Key: Fe (yellow), C(violet), N (gray), O (red), M (blue).
Heat of adsorption data differ for nitroprussides than Prussian Blue analogues compared to hydrogen loading. Hydrogen adsorption environment must be differentiated for nitroprussides from some degree of coverage, which indicates that M[Fe(CN)5NO] have additional hydrogen storage sites[26].
The hydrogen uptake capacities were reported in a family of transition metals nitroprussides; M[Fe(CN)5NO] with M = Mn, Fe, Co, Ni, Cu, Zn, Cd . The
mixed compositions of transition metals nitroprussides; Co1-xMx[Fe(CN)5NO]
with M= Mn, Fe, Ni, Zn, and Cd, and Cu0.55Ni0.45[Fe(CN)5NO] are studied
simultaneously to understand the effect of the metal at the pore surface to hydrogen adsorption[28].
This study shows that adsorption depends on the types of metal ions not only because the structures are determined by combination of the metals but
23
also because they are found at the cavity surface; the electrostatic interaction between the hydrogen molecule quadrupole moment and the electric field gradient at pore surface can be thought of main driving force even though there is not a strong and localized interaction between the hydrogen molecule and the metal every time [28].
Hydrogen adsorption was not observed for Cu that are only samples with vacancies. The highest adsorptions were found for cubic phases (nickel and cobalt) where they have also larger available free volume. The largest hydrogen storage capacity was for Ni[Fe(CN)5NO], 2.54 mol/mol (1.85 wt %) at 75 K and
850 Torr. Maximum estimated adsorptions are tabulated for the compounds in Table 2[28].
Table 2. Results Derived from the H2 Adsorption Isotherms Fitted According to the Langmuir Freundlich Modela [28]
compound temp[K] H2/cavity wt % H2
Ni[Fe(CN)5NO] 75 12.8+0.2 3.11+0.02 Co[Fe(CN)5NO] 75 10.5+0.2 2.54+0.02 Fe[Fe(CN)5NO] 75 3.8+0.01 0.93+0.01 Co0.93Mn0,07[Fe(CN)5NO] 75 11.7+0.1 2.83+0.01 Co0,41Ni0.59[Fe(CN)5NO] 75 9.9+0.09 2.39+0.09 Co0.86Zn0.14[Fe(CN)5NO] 75 7.0+0.02 1.69+0.02 Co0.89Cd0.11[Fe(CN)5NO] 75 5.3+0.08 1.37+0.4 Cu0,45Ni0.55[Fe(CN)5NO] 75 2.8+0.01 0.67+0.01
A np is the limit capacity of micropores, g is the osmotic coefficient, H
2/cavity is the estimated limit amount of H2 molecules per cavity, and wt % is the maximum
24
Chapter 3:
Experimental
3.1. Sample Preparation
3.1.1. Syntheses of Prussian Blue Analogues Constructed from [Fe(CN)5NH3]3– Building Blocks
3.1.1.1. Synthesis of Na3[Fe(CN)5NH3] Compound
The compound was synthesized based on the published procedure with slight modifications [29]: 30 g of Na2[Fe(CN)5NO] • 2H2O was dissolved in 150
ml.water. 4 g of NaOH was added to the solution and mixture was placed into an ice bath to cool down. Ammonia addition was started at +10°C until saturation (approximately 50 ml); the temperature of solution was kept below 20°C during this addition. The product was then re-crystallized at 0°C by adding methanol to increase saturation and purification. The yellow crystals were collected by filtration and dried in a vacuum desicator. The yield was 20 g (66.7%)
25
3.1.1.2. Synthesis of M3[Fe(CN)5NH3]2 Complexes
500 mg of sodium pentacyanoamminoferrate(II) compound was dissolved in 8 different flasks containing 125 ml of deionized water. Appropriate amount of metal nitrate solutions (being 920 mg of Cr(NO3)2.9H2O,
586 mg of Co(NO3)2.6H2O, 578 mg of Mn(NO3)2, 575 mg of Cu(NO3)2.6H2O, 684.5
mg of Zn(NO3)2.6H2O, Mg(NO3)2.6H2O, 671.748 mg of Ni(NO3)2.6H2O) in 125 ml
deionized water were added dropwise to pentacyanoamminoferrate(II) solutions one by one under constant stirring.The formed precipitates were aged under stirring at room temperature; filtered off, washed with deionized water and allowed to dry.
The different colors exhibited by synthesized compounds(see Table 3) Transition metal complexes, especially 3d series, absorb light in the visible range of spectrum often tend to be colored because energies of bonding and anti-bonding orbitals separation tends to be small in these complexes. Different colors are consistent with interaction between iron and different metal centers [30].
26
Table 3.Colors of the synthesized complexes
Compounds M(NO3)x M(NO3)x+ [Fe(CN)5NH3]3- After
filtration
Cr3[Fe(CN)5NH3] 2 Navy blue Greenish Black
Co3[Fe(CN)5NH3]2 Pinkish red Dark green Bright green
Mn3[Fe(CN)5NH3]2 Light pink Brownish yellow Grass green
Zn3[Fe(CN)5NH3]2 Colorless Yellow Yellowish
brown
Cu3[Fe(CN)5NH3]2 Bright blue Claret Very dark
brown Ni3[Fe(CN)5NH3]2 Green Darker green Brownish
green
3.1.2. Syntheses of Prussian Blue Analogues Constructed from [Fe(CN)5pz]3– Building Blocks
3.1.2.1. Preparation of Pentacyano Pyrazine Ferrate Salt
Pentacyano pyrazine ferrate salt was prepared by replacing the relatively labile ammine ligand which is coordinated to the cation with pyrazine. After dissolving 550 mg Na3[Fe(CN)5(NH3)].nH2O in 5 ml deionized water pyrazine
solution(340 mg in 5 ml of distilled water) was added. Color change was observed from yellow to dark red instantaneously. 100ml ethanol was then
27
added to the reaction mixture. The solution was kept under a loose cover overnight for the yield to precipitate, after stirring for a couple of hours. The orange crystals were collected by filtration and dried in a vacuum desicator.
3.1.2.2. Synthesis of M3[Fe(CN)5pz]2.nH2O Complexes
400 mg of Na3[Fe(CN)5pz].nH2O was dissolved in 10 ml deionized water
and 295 mg of Ni(NO3)2.6H2O was added to the stirred
pentacyanopyrazineferrate(II) solution. Color change is observed orange to bordeaux wine color.
Likewise 371.86 mg of Na3[Fe(CN)5pz]and 270 mg of Cu(NO3)2 were
dissolved in 10 ml deionized water. Orange color of Na3[Fe(CN)5pz] solution
changed to brown upon addition of Cu(NO3)2.5H2O.
The resulting solutions were left for aging under a loose cover overnight and acetone was added just before filtrations. The formed precipitates were filtered and dried in a vacuum desicator. Yields were more than 50%.
28 3.2. Instrumentation
Qualitative characterizations of the PB analogues were obtained by XRD, TGA and FTIR techniques.
3.2.1. FTIR Spectroscopy: The Attenuated Total Reflectance (ATR)
IR spectra were collected as powder samples on PLATINIUM AT-IR Spectrometer (Brauker Model Alpha) in the mid-IR range 4000–400 cm–1 at
room temperature for all samples.
3.2.2. Powder X-ray Diffraction (PXRD)
X-ray diffraction patterns of powder samples were collected using Miniflex Model Rigakudifractometer with a Cu Kα x-ray source to check the
crystallinity. Preliminary evaluation of results was carried out by Rigaku software.
X-ray diffraction (XRD) patterns were collected for 2θ in the range of 5-65 with a step size of 0.01 and a rate of 1°min-1.
29
3.2.3. Thermogravimetric Analysis (TGA)
TG curves were obtained using a TA TGA Q500 model operated in the high resolution mode for thermal gravimetric analysis using 3-8 mg of the samples.
3.2.4. N2-sorption measurements
N2-sorption data were collected using a Micromeritics TriStar Brunaurer-Emmett-Teller Analysis (BET) analyzer at 77 K. Further hydrogen adsorption studies were also performed to see the selective adsorption of the PB analogues.
30
Chapter 4:
Characterization and Gas Sorption
Properties of Prussian Blue
Analogues Constructed from
[Fe(CN)
5
NH
3
]
3–
Building Blocks
M3[Fe(CN)5NH3]2 • nH2O type materials (they are signified as M3Fe2
throughout the text) have been synthesized and structurally characterized to observe the effects of NH3 ligand inclusion to building blocks of Prussian Blue
analogues on the structures and H2 binding performances of the PB analogues.
4.1. Fourier Infrared Spectra Transform
FTIR spectra of all the Prussian blue analogues were studied with emphasis on the CN stretching vibrations, as introduction of secondary metal leads to shift in the stretching due to N-ligation. Fe-CN groups result in strong, sharp and intense bands in the wavenumber range of 2200 - 2000 cm-1. When
N-ligation takes place due to a secondary metal (electropositive group) a blue shift is observed by 50 - 100 cm-1, higher frequency & wavenumbers[31].
Oxidation state of the secondary metal also influences the CN stretching. Metals with lower oxidation states leads in σ-bonding adding electrons to the
31
anti-bonding 2π* orbital, resulting in lower CN stretching frequencies. Metals with higher oxidation states reduces the possibility of addition of electrons to the 2π* orbital [32].
Hexacyano ferrate anion exhibits octahedral geometry. Prussian blue exhibit cubic lattice with octahedral metal ligation [32]. Octahedral symmetry of the hexacyanoferrate ion is lowered by cyanide substitution. The [Fe(CN)5NH3]3- species has local symmetry of C4v[31, 33]. Therefore [Fe(CN)5L]
ions display a 2A1 + Ε set of infrared active normal modes[33].
The order of ν(CN) stretching frequencies in pentacyanoamminoferratemetallates shown in Figure 6 were found to be similar with those in nitroprusside analogues reported in the literature[28]:
32 500 1000 1500 2000 2500 3000 3500 4000 0,0 0,5 1,0 1,5 2,0 2,5 3,0 3,5 4,0 4,5 5,0 5,5 6,0 6,5 A bs or banc e( a. u. ) Na3Fe2 Cr3Fe2 Mn3Fe2 Zn3Fe2 Ni3Fe2 Cu3Fe2 Co3Fe2 wavenumber(cm-1)
Figure 6.FTIR spectra of CN stretching region(left) and full spectrum(right) for
M3[Fe(CN)5NH3]2• nH2O complexes.
The noticeable stretching and bending vibrations from the spectra (Figure 6) were consolidated in Table 4.
1950 2000 2050 2100 2150 2200 0,0 0,5 1,0 1,5 2,0 2,5 3,0 3,5 4,0 4,5 5,0 5,5 6,0 6,5 A bs or banc e( a. u. ) wavenumber(cm-1)
33
Table 4.FTIR Stretching and Bending Bands for M3[Fe(CN)5NH3]2• nH2O complexes
SAMPLE O-H Stretch (cm-1) CN Stretch (cm-1) H-O-H Bending (cm-1) N-H Bending (cm-1) Fe-CN stretch (cm-1) Na3[Fe(CN)5NH3] .nH2O 3287 2033 1625 1262 566 Cr3[Fe(CN)5NH3]2 .nH2O 2877 2061 1613 1340 490 Co3[Fe(CN)5NH3]2 .nH2O 3300 2082 1613 1272 467 Mn3[Fe(CN)5NH3]2 .nH2O 3287 2072 1613 1272 520 Zn3[Fe(CN)5NH3]2 .nH2O 3353 2080 1602 1247 475 Cu3[Fe(CN)5NH3]2 .nH2O 3300 2092 1615 1244 467 Ni3[Fe(CN)5NH3]2 .nH2O 3250 2090 1614 1271 436
34
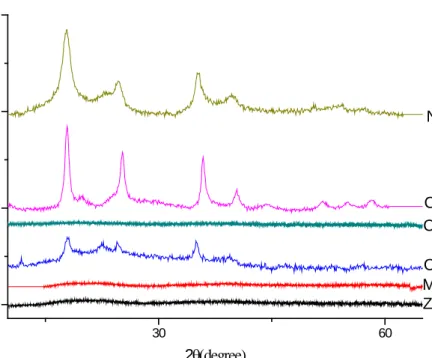
4.2. XRD Patterns of pentacyanoamminoferrate(II) metallates
X-ray diffraction pattern shown in Figure 7 implied that three Prussian blue analogues M3(Fe(CN)5NH3)2• nH2O (M = Co, Ni, Cu, Mg) have crystal
structures. 30 60 0 7000 14000 21000 Zn3Fe2 Mn3Fe2 Co3Fe2 Cr3Fe2 Cu3Fe2 C ount s 2θ(degree) Ni3Fe2
Figure 7.X-ray diffraction data for M3Fe2 complexes
Cu3Fe2, Ni3Fe2, Co3Fe2PBs were crystallized with a face centered cubic
unit cell. The analogues have highly symmetric Fm3m structure type having diffraction lines of varying intensities, corresponding to different PB analogues 2θ ~ 17° (200), 24° (220), 35° (400), 39°(420) and 43°[13, 18, 20, 23, 26, 28].
35
The other compounds (Zn, Mn& Cr analogues) shown in Figure 7 were amorphous even though these transition metals crystallized when they reacted with other type of building blocks.
4.3. Thermo-gravimetric analysis
Water molecules found in cavities of the compounds can be removed by heating. While it sometimes only ensures more open sites for guest molecules it also can cause destruction of the framework.
TG curves (Figures 8, 9 and 10 ) were obtained in the temperature range of 25 to 600 °C, treated at a ramp rate of 10°C/min, under nitrogen atmosphere using~5 mg sample. Cu, Ni & Co analogues were used to study the thermal degradation or decomposition and water content of the compounds.
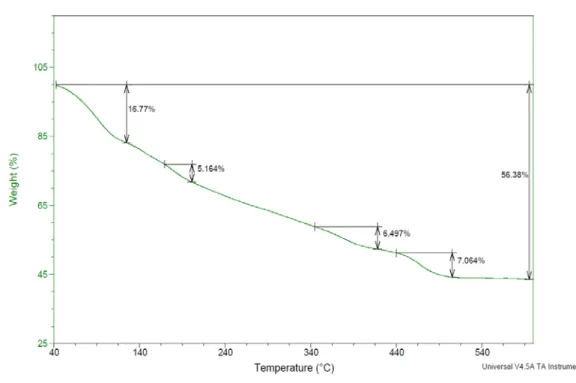
4.3.1 Cu3[Fe(CN)5NH3] 2 .nH2O
Figure 8 gives the degradation of Cu3Fe2, studied by TGA. The sample
shows a gradual loss in weight starting at around 50oC and stabilizes at around
125oC, with a total loss of around 16.8% of the sample in weight. This can be
corresponding to the loss of water molecules from the complex.
A secondary loss of weight was observed in between 150 – 225oC, which
36
ammonia vapors. Amino, being a labile ligand can be removed from the complex without affecting the crystal structure.
Figure 8. Thermogravimetric curve of Cu3Fe2 complex
It was also noted that above 400oC, there was a major loss in the weight
of the complex, above 56%. This can be due to the thermal decomposition of the complex. At temperature above 400oC, the cyano(CN) group decomposes.
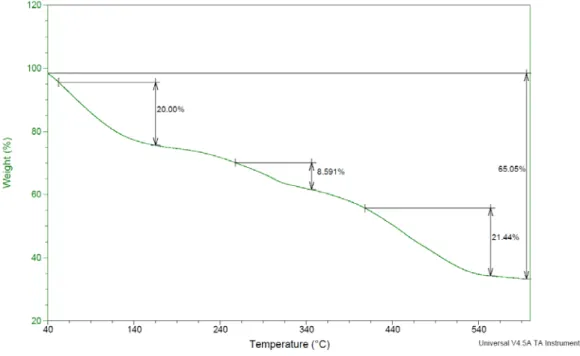
37 4.3.2. Ni3[Fe(CN)5NH3] 2 .nH2O
Figure 9 gives the degradation of the Ni analogue, studied by TGA. The sample shows a significant loss in weight in between 45 - 120oC, with a total
loss of around 20.00 % from the sample. This can be due to the removal of water molecules from the complex. It was observed that the Ni analogue holds relatively more water molecules compared to Cu analogue.
Figure 9.Thermogravimetric curve of Ni3Fe2 complex
As the temperature increases, a secondary loss of weight was observed in between 200 – 300oC, which can be corresponded to the loss of the labile
amino group from the complex as Ammonia vapors. But, it was noted that the amino group holds good till a relatively higher temperature compared to that of the Cu analogue.
38
It was also noted that above 380oC, there was a major loss in the weight,
of about 65 % of the complex. This can be due to the thermal decomposition of the complex. At temperature around 400oC, the cyano (CN) group decomposes.
4.3.3. Co3[Fe(CN)5NH3] 2 .nH2O
Figure 10 gives the degradation of the Co analogue, studied by TGA. The sample shows a significant loss in weight in between 40 - 115oC, with a total
loss of around 22 % from the sample. This can be due to the removal of water molecules from the complex. It was observed that the Co analogue holds almost equal quantity of water molecules with respect to Ni analogue and relatively more water molecules compared to Cu analogue.
39
As the temperature increases, a secondary loss of weight was observed in between 200 – 300oC, which can be corresponded to the loss of the labile
amino group from the complex as Ammonia vapors. But, it was noted that the amino group holds good till a relatively higher temperature compared to that of the Cu analogue, but slightly lower temperature compared to Ni analogue.
It was also noted that above 325oC, there was a major loss in the weight
of the complex. This can be due to the thermal decomposition of the complex. At temperature around 350oC, the cyano (CN) group decomposes.
4.4. Thermal stabilities and dehydration degrees
The effect of treatment temperature on the Cu, Ni & Co analogues was further studied by degassing the complexes at specific temperature of 95oC,
150oC, 200oC & 225oC. Known quantities of the complexes were degassed at the
mentioned temperatures for 3 hours, under a constant vacuum. The samples were then characterized using FTIR to study the change in the chemical composition and with XRD to study the change in crystallinity, if any.
40 4.4.1. Cu3[Fe(CN)5NH3] 2 .nH2O
Figure 11 gives the FTIR spectra of the Cu analogue treated at the above mentioned temperatures.Much emphasis was given to the CN stretch at 2092 cm-1, which implies the change in the geometry of the complex.
1950 2000 2050 2100 2150 2200 0,0 0,5 1,0 1,5 2,0 A bs or banc e( a. u) wavenumber(cm-1 ) a b c d e 500 1000 1500 2000 2500 3000 3500 4000 0,0 0,5 1,0 1,5 2,0 A bs or banc e( a. u) wavenumber(cm-1 ) a b c d e
Figure 11. FTIR spectra of Cu3Fe2 complex (a)as synthesized, and degassed (b)95°C, (c) 150°C, (d) 200°C (e) 225°C for 3 hours under vacuum
The spectrum of the sample treated at 95oC shows a drastic loss in the
transmittance signal in the range of 3650 – 3100 cm-1 which corresponds to the
H2O stretching vibrations and at 1650 – 1580 cm-1 which corresponds to the
H-O-H bending vibrations. But there was no noticeable change in the CN stretching, indicating that the loss of water has had no effect on the complex.
41
Upon treatment at 150oC, the signals corresponding to O-H stretching
and H-O-H bending vibrations were absent, implying the complete removal of water from the sample. But the sharp, single stretch at 2088 cm-1 implies that
the complex holds good, with no noticeable changes in the geometry.
From the spectrum of the sample treated at 200oC, it was observed that
there is a significant change in the signal in the range 1480 – 1410 cm-1
corresponding to the H-N-H bending vibrations. This can be attributed to the beginning of the removal of amino group from the complex. Also the CN stretching vibrations at 2092 cm-1 turns from a single, sharp, strong stretch to a
broad, split stretch indicates the change in the geometry.
In the spectrum of the sample treated at 225oC, there was no signal
corresponding to H-N-H bending or N-H stretching vibrations, indicating the complete removal of the amino group from the complex. The CN stretch at 2088 cm-1 becomes significantly weak and broad; indicating that loss of amino
group altered the geometry of the complex to a great extent.
Figure 12 shows the XRD pattern of the as synthesized complex and the complex degassed at 95oC. Copper pentacyanoammonia ferrate complex
42 10 15 20 25 30 35 40 45 50 55 60 65 0 1500 3000 4500 6000 7500 9000 C ount s 2θ(degree) a b
Figure 12. XRD patterns of Cu3Fe2 compound a as synthesized b after heat treatment at 95°C
The XRD pattern suggests the cell symmetry reduction by water removal from the crystal when heated at 95°C, the number of peaks observed increases and intensities of peaks decreased. Pattern still remains to be face-centered cubic (fcc) structure after evacuation at 95°C. However the broadenings on the peaks indicating partial decompositions while some new peaks (at 2θ ~ 20°, 30°, 33°) were generated, indicating possibility of other structure of lower crystalline order.
4.4.2. Ni3[Fe(CN)5NH3] 2 .nH2O
Figure 13 gives the FTIR spectra of the Ni analogue treated at the above mentioned temperatures. Much emphasis was given to the CN stretching
43
vibration at 2090 cm-1, which implies the change in the geometry of the
complex. 1950 2000 2050 2100 2150 2200 0,0 0,2 0,4 0,6 0,8 1,0 1,2 1,4 1,6 1,8 2,0 2,2 wavenumber(cm-1) A bs or banc e( a. u. ) a b c d e 500 1000 1500 2000 2500 3000 3500 4000 0,0 0,2 0,4 0,6 0,8 1,0 1,2 1,4 1,6 1,8 2,0 2,2 wavenumber(cm-1) A bs or banc e( a. u. ) a b c d e
Figure 13.FTIR spectra of Ni3Fe2complex (a) as synthesized, and degassed (b) 95°C, (c) 150°C, (d) 200°C (e) 225°C for 3 hours under vacuum
The spectrum of the sample treated at 95oC shows a drastic loss in the
transmittance signal in the range of 3650 – 3100 cm-1 which corresponds to the
O-H stretching vibrations and at 1650 – 1580 cm-1 which corresponds to the
H-O-H bending vibrations. But there was no change in the CN stretching, indicating that the loss of water has had no effect on the complex.
Upon treatment at 150oC the signals corresponding to O-H stretching and
44
water from the complex. But the sharp, single stretch at 2090 cm-1 implies that
the complex holds good, with no noticeable changes in the geometry.
From the spectrum of the sample treated at 200oC, it was observed that
there is a significant change in the signal in the range 1480 – 1410 cm-1
corresponding to the H-N-H bending vibrations. This can be attributed to the beginning of the removal of amino group from the complex. Also the CN stretching vibrations at 2090 cm-1 turns from a single, sharp, strong stretch to a
broad, split stretch indicates the change in the geometry. But, Ni analogue shows better retention of amino group compared to Cu analogue.
In the spectrum of the sample treated at 225oC, there was no signal
corresponding to H-N-H bending or N-H stretching vibrations, indicating the complete removal of the amino group from the complex. The CN stretch at 2090 cm-1 becomes significantly weak and broad; indicating that loss of amino
45 30 60 0 4000 8000 C ount s 2Θ(degree) a b
Figure 14.XRD patterns of Ni3Fe2 compound a as synthesized b after heat treatment at 95°C
The XRD pattern suggests that the sample holds the structure by water removal from the crystal when heated at 95°C, pattern still remains to be face-centered cubic (fcc) structure after evacuation at 95°C as supported by the FTIR spectrum of the sample.
4.4.3. Co3[Fe(CN)5NH3] 2.nH2O
Figure 15 gives the FTIR spectra of the Ni analogue treated at the above mentioned temperatures. Much emphasis was given to the CN stretching vibration at 2082 cm-1, which implies the change in the geometry of the
46 1950 2000 2050 2100 2150 2200 0,0 0,5 1,0 1,5 A bs or banc e( a. u. ) wavenumber(cm-1) a b c d e 500 1000 1500 2000 2500 3000 3500 4000 0,0 0,5 1,0 1,5 A bs or banc e( a. u. ) wavenumber(cm-1) a b c d e
Figure 15.FTIR spectra of Co3Fe2complex (a) as synthesized complex, and degassed (b) 95°C, (c) 150°C, (d) 200°C (e) 225°C for 3 hours under vacuum
The spectrum of the sample treated at 95oC shows a drastic loss in the
transmittance signal in the range of 3650 – 3100 cm-1 which corresponds to the
O-H stretching vibrations and at 1650 – 1580 cm-1 which corresponds to the
H-O-H bending vibrations. But there was no change in the CN stretching, indicating that the loss of water has had no effect on the complex.
Upon treatment at 150oC the signals corresponding to O-H stretching and
H-O-H bending vibrations were absent, implying the complete removal of water from the complex. But the sharp, single stretch at 2082 cm-1 implies that
47
From the spectrum of the sample treated at 200oC, it was observed that
there is a significant change in the signal in the range 1480 – 1410 cm-1
corresponding to the H-N-H bending vibrations. This can be attributed to the removal of amino group from the complex. Also the CN stretching vibrations at 2082 cm-1 turns from a single, sharp, strong stretch to a broad, split stretch
indicates the distortion in the geometry.
In the spectrum of the sample treated at 225oC, there was no signal
corresponding to H-N-H bending or N-H stretching vibrations, indicating the complete removal of the amino group from the complex. The CN stretch at 2082 cm-1 becomes significantly weak and broad; indicating that loss of amino
group distorted the geometry of the complex.
30 60 0 2000 4000 C ount s 2θ a b
Figure 16.XRD patterns of Co3Fe2 compound a. as synthesized b. after heat treatment at 95°C

![Figure 4.X-ray powder diffraction data for M 3 [Co(CN) 6 ] 2 .15H 2 O.The broad peak at 13°](https://thumb-eu.123doks.com/thumbv2/9libnet/5959472.124492/33.892.236.688.115.450/figure-ray-powder-diffraction-data-cn-broad-peak.webp)
![Figure 5.Structure of M[Fe(CN) 5 NO] compounds showing the porous nature of the framework](https://thumb-eu.123doks.com/thumbv2/9libnet/5959472.124492/40.892.302.623.141.431/figure-structure-fe-compounds-showing-porous-nature-framework.webp)
![Table 2. Results Derived from the H 2 Adsorption Isotherms Fitted According to the Langmuir Freundlich Model a [28]](https://thumb-eu.123doks.com/thumbv2/9libnet/5959472.124492/41.892.170.772.679.1039/results-derived-adsorption-isotherms-fitted-according-langmuir-freundlich.webp)
![Figure 6.FTIR spectra of CN stretching region(left) and full spectrum(right) for M 3 [Fe(CN) 5 NH 3 ] 2 • nH 2 O complexes.](https://thumb-eu.123doks.com/thumbv2/9libnet/5959472.124492/50.892.195.739.165.547/figure-ftir-spectra-stretching-region-spectrum-right-complexes.webp)