Ш
POUCIS
il
îlüitsi
ШІІІГ
AGÎ-ea
KWSIiY
Kj*jk II a Hî İ5 Г- - ^ * « Í » · f*
'îiMtsüJîlissife'ïü iÿy ϊΰ ΰο '*· 4öaüwä:;:_■ »i-**
^Şâfi i&?^ïir!;ïa53^5i Μ· iÎiiiîİ ІГ üHe Ііі10іё il ¿ i i ЗЙУ i f £W i ¿ 4 *w^i) . J »áñ®.: ■ *Ífífr/¿^· t"lp*iC!í ^ Ψ J. li:. iíi üía Î! '‘İSİ'**l¿’ ?Í ' . t;p Ş іГгТ?ь‘-Г5 ri'X'"; «ä4y » ^ · · M >r
/‘
)j’
9
' j|^ . S b' ”.:"4·\3 Ü¿'EXPOST psonm»:;
policiesIN TOKEISS tf&KDFACrQRIHG HDÜSIKT. 1980-1986
A Thesis
Submitted to Ttie Department of Management and Graduate School of Business Administration
of Bilkent University
In Partial Fullfillment of The Requirements for The Degree of
MASTER OF BUSINESS ADMINISTRATION
By
Süheyla Özyildirim July, 1989
H о
‘Э 7 2 s
I certify that I have read this thesis and in my opinion it is fully adequate, in scope and in quality, as a thesis for the degree of Master of Business Administration.
Assist. Prof. Gökhan Çapogiu
I certify that I have read this thesis and in my opinion it is fully adequate, in scope and in quality, as a thesis for the degree of Master of Business Administration.
I certify that I have read this thesis and in my opinion it is fully adequate, in scope and in quality, as a thesis for the degree of Master of Business Administration.
Assist. Prof. Kürşat Aydoÿan
ABSTRACT
EXPORT PROnOTING POLICIES
IN TURKISH MANUFACTURING INDUSTRY, 1980-1986
Süheyla ÖSYILDIRIM ИВА in Hanagement
Supervisor: Assist. Prof. Gökhan Çapoğlu July 1989, 76 Pages
This study basically aims at estimating the significance of export promoting policies for the expansion of Turkish manufacturing exports in the period 1980-86. The price responsiveness of export is also analyzed by evaluating the effects of a decline in labor wages on manufactured exports.
In this study, export promoting policies are grouped as export subsidies (tax rebates, export credits and foreign currency allocations) and flexible exchange rate policy ( d e v a l m t i o n of Turkish lira since January 1980). As there is several years of data on a number of manufacturing subsectors, the cross-sectional time series models are used to test the significance of these policies.
The tax rebates and forcing currency allocations are the most significant promoting policies affecting exports of manufacturing ii^ustry according to the study’s fii:dings. The devaluation of Turkish lira against dollar and mark has also an encouraging effect on the manufactured exports.
Key words ;Tax rebates, export credits, foreign currency allocation, trade weighted real effective exchange rate, capacity utilization, wages, pooled data, cross-sectional time series, fixed effect, OLS.
ÖZET
TÜRK İMÂLAT SAİİAYİNDE,
İHRACAT TEŞVİK POLİTİKALARI, 1980-1986
Süheyla ÖZYILDIRIM
Yüksek Lisans Tezi, İşletme Enstitüsü Tez Yöneticisi: Yrd. Doç. Gökhan Çapoğlu
Temmuz 1989, 76 Sayfa
Bu çalışmanın asıl amacı, ihracatı teşvik edici politikaların, 1980-86 yılları arasinda Türk imalat sanayi ihracatının gelişmesindeki önemini tahmin etmektir. Ayrıca, ihracatın fiyat duyarlılığı da, düşen işçi ücretlerinin ihracat üzerindeki etkilerini değerlendirerek incelenmiştir.
Bu çalışmada ihracatı teşvik politikaları iki grupta toplanmıştır: teşvikler (vergi iadesi, ihracat kredileri, döviz tahsisleri) ve esnek kur politikası (Türk lirasının. Ocak 1980‘den itibaren değer kaybı). İmalat sanayinin alt sektörlerine ait veri olması nedeniyle, bu politikaların önemini test etmek için çapraz-kesimli zaman serileri modeli kullanılmıştır.
Vergi iadesi ve döviz tahsislerinin, imalat sanayinin ihracatını geliştirici en önemli teşvik politikaları olduğu buluımuştur. Ayrıca, Türk lirasının, dolar ve mark karşısında değer kaybetmesi de ihracatı geliştirici etkendir.
Anahtar Sözcükler: Vergi iadesi, ihracat kredisi, döviz tahsisi, tartılı (ticaret ağırlıklı) efektif reel kur, kapasite kullanımı, ücretler, birleştirilmiş veri, çapraz kesimli zama.n serisi, belirli etki, AKK.
¿CE0YLEDGEQE3ITS
I would like to thank to my supervisor Assist. Prof. Dr. Gökhan Çapoglu for his support , encouragement and guidance for the preparation of this thesis.
I would also like to thank to Dr. Faik Koray and Assist. Prof. Dr. Kürşat Aydoğan for their comments and suggestions.
I also have many thanks to my friend Güney Erdemci to her valviable criticisms.
Finally, I would like to express my appreciation to my parents for providing an environment and encouragement necessary to prepare this thesis.
COKTEHTS
ABSTRACT ÖZET ACKNOVLEDGEÎIEOTS LIST OF TABLES LIST OF FIGURES Page iii iv V viii X 1. INTRODUCTION1.1. The Problem Statement
1.2. The Methodology of The Study 1.3. Some Considerations About Data
1.3.1. Time Period Covered 1.3.2. Export Subsidies
1.3.3. Foreign Excharjge Rates 1.3.4. Capacity Utilization 1.3.5. Labor Wages
1
1
4 4 4 5 56
72. CURRENT KNOWLEDGE AND PRACTICE 9
2.1. Theoretical Framework 9
2.1.1. Export Subsidies 9
2.1.1.1. Export Tax Rebates 10 2.1.1.2. Preferential Export Credit 12 2.1.1.3. Foreign Exchange Allocation
And Duty Free Imports 13
2.1.2. Exchange Rate Regime 2.1.3. Capacity Utilization 2.1.4. Labor Wages 2.2. Related Research 15 16 17 18 3. RESEARCH METHODOLOGY 3.1. Hypothesis
3.2. The Methodology of Estimation 3.3. Findings of The Study
3.3.1. Model 1 3. 3. 2. Model 2 3.3.3. Model 3 23 23 24 28 28 33 39 4. CONCLUSION 5. APPENDIX 4. REFERENCES 45 49 64
V I1
LIST OF TABLES
T^ble
1 Model 1: Explanation of with TRit' ^*“it-rCAit- CUit, Wit
Page
29
2 Model 1; Explanation of X^^ with TR^^., EC^^,
FCAit, Vit 30
3 F-Tests 34
4 Model 2; Explanation of X^^ with TR^^^, ^*-it' ^^^it' ^^it' ^it
5 Model 2: Explanation of X^^ with ^*^it'
FCAit, Wit 37
6 Model 2; Explanation of X^^ with TR^^, ^''^it' ^i^ 38
7 Model 3; Explanation of X^^^ with TR^|., EC^^.
FCAit. CUit. Wit 40
8 Model 3; Explanation of Xit with TRit,
^^it-i-CAit^ ^it 41
9 Model 2: Explanation of Xit with TRit, ^*^it. Wit
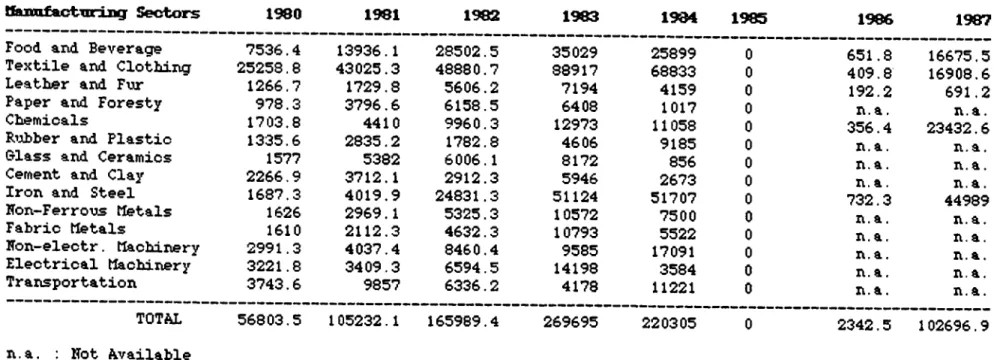
10 Export Values By Manufacturing Industry 50
13 Average Capacity Utilization in Manufacturing
Industry
54
14 Annual Nominal and Real ¥ages in Manufacturing
Industry 55
15 Percentage Change in Real Vages 56
16 Export Tax Rebate Lists And Rebate Rates 57
17 Export Tax Rebate in The Manufacturing Industry 56
18 Imports of Commodity Groups 62
19 Foreign Currency Allocations in Ifenufacturing
Industry 63
LIST OF FIGOKES
Figure P&ge
1. nrHÎODUCTrOH
1 .1 .
Hie ProbleK Stateaeat
Exporting can be simply defined as selling some of vhat a country is producing to foreign markets. The country M v i n g a market potential for its goods and services in foreign coimtries is said to be competitive. Being competitive in world markets implies an efficient and reliable domestic industry.
In order to develop their domestic industries, countries follow mainly two types of development strategies: (i) import-substitution, (ii) export-oriented. For the development of the export-oriented industries, certain policies are followed. These policies are mainly to subsidize manufacturing exports and also to increase production in manufacturing industry by efficient usage of capitals. However, subsidies’ function is to support the industry for a certain period. The subsidies should continue until domestic firms become competitive and find new international markets.
In Turkey’s development strategy, the manufacturing industry has been central. In the 1950s, the industrialization activities started with import substitution in consumer goods, intermediate and capacity goods. By the early 1960s, the domestic production of previously imported non-durable consumer goods has been domestically produced. However, this was not the case with the intermediate and capacity goods. In the period 1963-1970 annual average growth of manufacturing sector was almost 10 percent (World Bank, 1982:204; Yağcı, 1984:7).
Until January 1980, high protectionism policy in imports were followed. In the early seventies alorjg with other
developing countries, Turkey was affected considerably from the increase in oil prices. Instead of adjusting herself to the world recession, the Turkish government continued to emphasize on economic growth of import-substitution industries by borrowing externally and this caused a high leakage of foreign exchange. In order to lower the import costs, exchange rates were overvalued (World Bank, 1982:1; Yagci, 1984:5). However, the artificial appreciation of the exchange rates prevented the development of export-oriented industries and the savings of foreign exchange in the country. By the end of 1979, Turkey lost its creditworthiness and accordingly imports, production and investments declined drastically.
The deterioration of the industry and creditworthiness of Turkey, led the authorities to change their development strategies to export-oriented way of industrialization. In the early 1980s, a new economic recovery program was announced. The philosophy of this program relies on the liberalization of the domestic market, and the export orientation in foreign trade (Milanovic, 1986:1).
The export ability of the manufacturing industry was the focus of the new development strategy. Although, high devaluation and flexible exchange rates took place in January 1980, their immediate impact had not been realized in exports of manufacturing sectors. After September 1980, the manufactured exports had started to rise, and a twenty six percent increase in exports over 1979 had been realized
(World Bank, 1984:214).
Thus, the change in the development strategy and the incentive policies on exports caused the manufacturing industry to expand after the 1980s. The increase in exports in the manufacturing sector from $1047.4 million (36 percent of total exports) in 1980 to $8065.2 million (79.1 percent of
total exports) in 1987 (Table 10). As compared to manufacturing sector, agricultural sector lost almost 40 percent of its share in exports and mining sector settled at almost 3 percent of its share along the seven years after the new policies have been established.
The increase in exports may be considered mostly as a result of the export sutisidies granted to certain sectors and daily adjustments of exchange rates starting with 60 percent devaluation in January, 1980.
This study basically focuses on measuring the significance of export subsidies, the change in real exchange rates and some other indicators to promote laanufacturing exports.
In eight years since January 1980, these subsidies and/or incentives have lost their initial effect but excliange rates being adjusted daily has been devalued continuously. Although the share of manufacturing industry’s in export was 79.1 percent in 1987, the change in this figure was only seven percent after 1984. So, manufacturing sector's share in the overall exports and its dependence on export subsidies are to be studied in this paper.
As a second objective, price responsiveness of exports is analyzed. The production of exportable goods depends on the price elasticities of domestic production (Johnson, 1987:24). The effects of a decline in real wages on manufacturing
exports are evaluated considering the effects of devaluation on imported input goods.
In brief, the effects of export policies on the manufacturing sector will be discussed.
In this study, several export expansion policies are evaluated regarding the manufacturing industry in Turkey. Hypotheses cover the items affecting exports and how sensitive the value of exports in manufacturing iiidustry to changes in development policies.
There are three important subsidy schemes used by the policy makers. These are tax rebate, export credits, foreign exchange allocation that are mostly utilized in manufacturing sector. Since January 1980 devaluation, the real exchange rate of the Turkish Lira also has become a policy instrument to stimulate exports. In addition to these policies, changes in the utilization of capacity in manufacturing sector and real wages need to be considered. So,the three subsidy schemes, real exchange rates, capital utilization and the real wages are used in the test of hypotheses.
The study entails regression analysis using pooled cross-section and time-series data (panel data) for 14 sub-sectors of manufacturing industry for the time period 1980-86.
1.3 The Hethodology of The Study
1. 4. Soime Ccxosideiatiozis Jkbout Data
1.4.1. Time Period Covered
The hypotheses are tested for the time period between 1980-1986. The period before 1980 will not be included in the study. The selection of this time period is based on the fact that by the end of 1979, an announcement of a new economic program has been made and accordingly a passage of a new development stategy of export-orientation in foreign trade has been opened. Inclusion of earlier years may
deteriorate the sole effect of export incentive policies and foreign exchange regime on measurement of the variables.
1.4.2. Export Subsidies
In January 1985, the preferential export financing was entirely eliminated but put again into regulation in November 1986. As a result, for the year 1985, all the sub-sectors had the value of zero credits (Table 11) and for 1986, only December values were taken into account. While evaluating the effects of export credits, these outlier values are taken into consideration.
1.4.3. Foreign Ezcbange Kates
A general depreciation or appreciation of a currency vis-a-vis other curriencies is considered as a simultaneous depreciation with respect to some currencies or appreciation with respect to others. So, according to Batiz and Batiz (1985:133) "In order to develop effective exchange rate index, the most important trade partners are defined and weighted average of the effective exchange rates of those partners are used to calculate this index".
The Central Bank of the Republic of Turkey calculates and putilishes trade-weighted real effective exchange rate each month by using monthly average of daily exchange rates of US dollar and Deutsche mark and the industrial product price irjdex of US ai:kd Federal Republic of Germany:
[0. 75. $/TL(t)]+[0. 25.DM/TL(t). $/DM(5.1981)J TERK(t)=P(t)*
where P(t) is the average wholesale price ii^ex in Turkey and PUS(t) and PGE(t) are the industrial product index of US and Gerioany respectively (CBRT, Monthly Statistical and Evaluation Bulletin,4).
As the data are given montly, the annual average of the rate are calculated and used in the model (Table 12). Also, as the exchange rates are same for all industries, the same rates are used for each sub-sector in certain year.
1.4.4. Capacity Utilizatian
Capacity utilization data are collected only by Istanbul Chamber of Industry (Table 13). The data are taken from a survey conducted by this organization including only private sectors of manufacturing industry. As there is no other survey about the capacity utilization in manufacturing industry including the public sector, these data are used in the study.
The private manufacturing sector has a share of almost over sixty percent of total production of the manufacturing industry. So, using only private sector data may not cause less generality while measuring the effects of capacity utilization on export expansion. However, as the data supplied by ICI only covers capacity utilization index of 900 largest private manufacturirjg firms, while evaluating the effects of the capacity changes on manufacturing exports, the fewness of firms covered in the survey should be taken into consideration.
Also, in calculating the capacity utilization, ICI has used the two-digit coded industrial classifications. However, the manufacturing sub-sectors in this study cover the
three-digit coded sectors that the sub-sectors in the two-digit coded are taken as the same rate of capacity utilization.
1.4.5. Labor Vages
The data about labor wages are obtained from "General Censuses of Industry and Business Establishments", conducted by State Institute of Statistics (Table 14) This publication covers the data related to the establishments with 10-24 persons engaged in private sector as summary; the data related to the establishments with 25 or more persons engaged in private sector and all manufacturing establishments in public sector in detail. So. the data about the labor wages can be considered as the most reliable figures published in Turkey.
In the publication of State Institute of Statistics (SIS), annual average labor wages are not given but can be computed by dividing total ann\aal wages and salaries paid to enployees to average annual number of persons engaged. Average number of persons engaged covers average nijmber of employees, owners of the establishments and unpaid family workers. As in this study, mostly establishments with 25 or more persons engaged are taken into consideration, number of persons engaged other then employees are neglegible.
The wages used in this study covers overtime payments, bonuses, indemnities and payments in kind.
Generally, the term wages refers to average hourly earnings exclusive of overtime payments. However, as the data used in this study includes overtime payments, the values associatirig labor wages are not reflecting the average payments made to workers within a work day. So, the values of
wages given by State Institute of Statistics may distort the findings by overestimating these results.
2. CaRKENT ENOfLEDGE AND PRACTICE
2.1. Hieoretical Framevork
2.1.1. Export Subsidies
The relative prices determine the composition of domestic spending between imports and domestic goods at given level of income. The relative prices also affect the world demand for the domestic goods. The relative price of domestic goods in terms of importables can be defined as
p = eP*/P, where eP* is the import price in home
currency and P is the domestic goods price.
According to Dornbusch (1980:66) "An export subsidy leaves the domestic relative price of goods unchanged but it lowers the real cost of our exportables to the rest of the world. The price faced by foreigners can be written as p*=p/(l-s)^ where s is the subsidy rate." Thus the export subsidy lowers the price of domestic goods and leads to export expansion.
In Turkey for the last two decades, various types of incentives were utilized for manufacturing exports in the form of indirect tax rebates, preferential export credits, foreign exchange allocation and retention schemes (¥orld Bank, 1982:5). However until January 1980, these incentives were limited and the overvalued exchange rates affected the exports unfavorably.
^ p*=eP*/P(l-s) foreigners decline.
Export tax rebates can be defined as the repayment of previously paid taxes to the manufacturers of exports. These paid-back taxes are generally for indirect taxes. Indirect taxes are: (1) production tax paid on raw material and intermediate goods (2) taxes on labor (3) taxes on direct expense (4) taxes on indirect expenses. Tax rebates provide competitiveness to the production cost of the industrial goods in foreign markets by lowering price of exportable goods. The price decline can be evaluated in partial equilibrium analysis in below diagram (Karluk, 1984:22).
2.1.1.1. E:q)ort *tex Rebates
D and S lines are the domestic demand and supply of good X respectively. As the world market is perfectly competitive, the demand for good X in the world market is a horizantal line along the price P2- The domestic producers are producing
units of X at price which is the equilibrium price. As the world price of X is lower than the domestic price, the domestic producers couldn't export their goods.
Assuming that the government repays the price difference (P2-P1) to the exporter as a tax rebate. This will cause the
supply curve to shift right (S') and increase the utilization of unused capacity. Tlius, by export subsidy manufacturers totally produce Q2 units of X and sell units to domestic
consumers at price Pj^ and sell Q1Q2 units to foreign
consumers at price P2. The rectangular area ABCD is the tax
rebate paid back by government. This amount is the loss from the tax revenue of government budget.
In Turkey, export tax rebate regime is the characteristic of giving financial aid to the manufacturer-exporters. All or partial of the taxes especially indirect taxes and custom duties are paid by government during the production and/or exporting period. These taxes are completely paid from the treasury and a burden to the government budget.
In the early stages of the recovery program, especially large firms can be considered as completely exempt from indirect taxes (95-97 percent of the taxes were paid back) (Milanovic, 1986:6). The basic idea in determining the rate of tax rebates paid back is to increase the competitiveness of exportable goods by loweririg financial burdens that are directly affecting the production costs. So, for the simplification of tax rebate calculations, export items are grouped into lists having different indirect taxes. As the calculation of the indirect taxes paid by the firms is difficult to determine, the firms reaching to the export limit (certain million dollars) at certain list, are capitalized on tax rebate at upper rate (rebate rate) and the others at lower rate (Table 16).
By the end of 1983 the Turkish government has reduced the rate of tax rebate by a considerable amount (Table 17). According to nilanovic (1986:11), this gradual decline was
motivated by mainly two factors. Firstly, the authorities thovight that instead of emphasizing direct subsidies of tax rebates, indirect tools of subsidies such as exchange rate regimes should be emphasized. Secondly, the high rates of tax rebates were thought to be encouraging the fictitious exports.
Beginning with 1984, the gradual reduction on tax rebates were scheduled and finally by the beginning of 1989 the export tax rebate policy has been completely abondoned.
2-1.1.2. Preferential Export Credit
Export credits are credits which are given by the Central Bank to the exporters and manufacturer-exporters in order to finance them between the time period of exportable goods are bought or produced and the time period of foreign currency value of exportable goods are paid for. These credits lower the export price of exportable goods and capacity goods by making credit available to the purchasers at rates lower than they could obtain credits at general rate.
¥ith the persistent inflation, the external financing needs of firms increases, although interest rates are too high. In general, preferential export credit seems to be adapted as a means to encourage especially manufacturers to produce exportable goods with less cost of external financing.
Starting with 1968 and most preferentially since 1980, goverrment has been subsidizing medium and long term credits to finance export-oriented investments (Yağcı, 1984:29).Yağcı analyzed that "There are four types of subsidy elements in the short term credits. These are: (1) a lower basic rate (2) exemption from the transaction tax (3) lower contribution to
interest rate rebate fund (IRRF) (4) a subsidy from IRRF (35 percent of basic rate)". The rate of export credit can be simply calculated as :
The Rate=(Basic Rate + Contribution to IRRF + Commision) - Rebate from IRRF
and, total subsidy of credit granted is calculated as :
Total Subsidy = A Basic Rates + Net Subsidy of IRRF
Although in 1981, the difference between nominal effective interest rates on export credits and general short term credits was almost 30 percent (Milanovic, 1986:29), high rates of inflation over this rate during the period 1980-84, caused a negative real rate of interest. Because of the negative rate of return earned from export credits, the utilization of that credit as a subsidy^, costs too much to the goverment that in January 1985 preferential export financing was entirely eliminated. In December 1986 export credits are rearrangened and put into regulation again.
2-1.1.3. Foreign Exf^iaiige Allocation And Duty-Free Imports
In many semi-industrial countries, imported raw materials and capital goods are substantial element of the cost of production (Table 18). Thus, the volume of imports can affect the volume of exports through the production process (Johnson, 1987:24). However in Turkey, certain subsidy policies such as foreign currency allocations are followed to
^ Subsidy as percentage of exports was decline from 15.9 precent in 1980 to 1.1 percent in 1984.
lower the adverse effects of imported input goods on production costs.
According to Yağcı (1984:32-33), foreign exchange allocation scheme was firstly introduced in 1965. The aim was to grant the priority to access foreign excliange to industrial exporters in order to import their raw materials and machineries that are used in the export-oriented production. These imported resources were generally duty-free. Until 1983, industries exporters were allowed to allocate their foreign exchange normally at 60 percent of the pledged export values (Milanovic,1986:42) (Table 19).
The incentive value of the foreign exchange allocation was dependent on the amount given to duty-free imports of raw materials and machineries used in production. This way of importing lowers the cost of export-oriented productions thus increasing the competitiveness of Turkish exports.
2.1.1.4. Retention Regimes
Since 1960 industrial exporters retained certain percentage of their foreign exchange earnings to import their
intermediate inputs arid equipments that are used in the export-oriented production with relevant custom duties (World Bank, 1982:78).
The aim of this regime was to compensate the negative effect of the overvaluation of the official exchange rate (Yağcı, 1984:35) against industrial exports. By retaining exchange rate earnings for further usage, the manufacturers lower their production costs. The imported inputs become more cheaper as compared to its values after devaluation of currency. This policy was more effective in the 1960s, and 1970s because of the scarcity of foreign
exchanges in Turkey at that time.
Since 1980, industrial exporters were given the right to deliver certain percentage of the net foreign earnings to their suppliers and to any other industrial user. Thus the exporters who retained and transfered their earnings to other users, gained additional revenues over their export earnings.
2.1.2. Foreign Exchange Kate Kegine
Instead of following export subsidy policy for encouraging exports, increasing reliance on the exchange rates can be used as another policy instrument (World Bank, 1982;ii).
Before 1980, according to Ya$ci (1984:20) "Turkey has pursued a fixed exchange rate policy with infrequent, irregular and vuipredictable of official exchange rate adjustments". In those years the most significant policy on exchange rates was the overvaluation of Turkish lira against foreign currencies. This type of exchange rate policy was followed for the sake of import-substitution development strategy. However, this policy has negative effects on export sectors and also it increases the balance of payment deficit. So, this policy in Turkey having a huge balance of payments deficit and continuing overvaluation of domestic currency have created more severe problems. By the end of 1979, the Turkish Central Bank lost almost all its international reserves because of the fixed exhange rate policy.
In the 1970s, inflation was increasing. "As long as inflation is more rapid in Turkey than in its major trade partners, continued adjustments in exchange rates necessary to maintain competitiveness of Turkish export"(World Bank,
1 9 8 2 :ii). As domestic prices increased by inflation, to maintain competitiveness^, exchange rate should be increased (devaluated) at given world prices. So, in January 1980, with announcement of new economic program, the real exchange rate of Turkish lira was devaluated in real terms to promote exports. In May 1981, the daily adjustment of TL by Central Bank was started. Since then, foreign exchange rates were used to promote exports by daily adjustments.
2.1. 3. Capacity ütili::ation
Before the recovery program in Turkey, the rate of capacity utilization was quite low due to foreign currency and energy bottlenecks in those days (Economic Report, 1986:91). According to the results of the survey of Istanbul Chamber of Industry, almost fifty percent average capacity utilization of 1980 was raised to seventy five percent in 1987 (Table 13).
According to Balassa (1978:40) "The exports of manufacturing goods provide advantages over import substitution in as much as they contribute to resourse allocation according to comparative advantage, increased capacity utilization, the exploitation by economies of scale and improvements in technology stimulated by competition in foreign markets ". Thus, the increasing amoimt of outputs because of export expansion lead to utilization of unused capacity. Moreover, if capacity is available, then the response to the export incentives will be large and rapid.
^ Competitiveness = eP 7 P where e is exchange rate, and P and P are foreign and domestic prices respectively.
Wages are an important component in manufacturing cost. As real wages fall, the relative price of exportable goods and their competitiveness increases. In Turkey, the authorities introduced an income policy in September 1980. Thus, the wages are determined centrally on the basis of yearly inflation targets. These rates are guidelines for both putilic and private sectors (Kopits, 1987:9).
Although the wages are tried to be adjusted according to the inflation rate, the real wages deflated by consumer price index declined by 14 percent between the 1980 to 1986 (Table 14). Thus, fall in real wages causes decline on the production costs and consumption demand that under both fixed and variable output, exports will rise (Taylor, 1983:27).
2.1.4. Labor fages
2.2. Related Research
Most studies related to the export incentives and their effect on export expansion are started in 1984. The empirical studies of export incentives in manufacturing sector are summarized in this section.
Yağcı (1984) constructed an econometric model indicating that manufacturing exports were indeed sensitive to the changes in the export policies for the time period 1970-81. He took the average combined subsidy rate for manufacturing exports as one of the independent variables to explain the changes in the value of manufactured exports. The average combined subsidy rate (S) was taken in the form of a payment of a certain proportion of the value of the goods exported. Payment of such a subsidy increases the internal price of exports to (1+S)(PMW*ER)^. While estimating the effect of
subsidies on manufactured exports (constant $), he deflated the internal price of exports by price index of manufacturing value added (PM). In his study he also used variables such as manufacturing value added (constant TL), and a dummy variable to represent the economic relations with the Muslim countries. His study depends on the data which are gathered from 123 manufacturing firms tliat are obtained through a sample survey. He concluded that export expansion in manufacturing sector is sensitive to sustained real devaluation and various export incentives that were issued in the period between 1970-81.
Nishimizu and Robinson (1984:177-206) constructed a single equation model to estimate the sensitivity of export and import substitution on total factor productivity (TFP) growth. This model was used for four semi-industrialized countries: Japan, Korea, Turkey and Yugoslavia from late 1950s to early/late 1970s. Total factor productivity is generally defined as the ratio of output to both capacity and labor inputs used in production (Dilwoth,1983:557). Nishimizu and Robinson took gross output and labor, capacity and material inputs as data for calculating the total factor productivity. They also classified manufacturing sector into four groups : (1) consumer groups (2) light intermediates (3) heavy intermediates (4) investment goods^. In their findings overall substantial portions of TFP growth rate were explained by output growth allocated to export expansion and
^ In this study, PMW is the dollar price index of manufactured exports, and ER is the exchange rate (TL/$).
^ In previous studies, manufacturirig sector is classified in to three groups, consumer, intermediate and capacity goods.
import sutititution in Korea, Turkey and Yugoslavia. The most interesting conclusion is that in Turkey, ” in all industries except for paper products, the elasticities with respect to export expansion are greater than those with respect to import substitution" (Nishimizu and Robinson,1984;196). Finally, they claimed that the export expansion leads to a growth in total factor productivity through competitive incentives.
Milanovic (1986) argued that "The policy should be concentrated on industries where the export svibsidy can make a difference between an export failure and should deemphasize support to industries which are either very competitive (as to be able to sell internationally on their own) or very inefficient so that almost no amount of subsidy is likely to help them move towards the more competitive range" (1986:57). He analyzed the combined effect of three incentive schemes
(tax rebates, preferential credit, and foreign exchange allocation for duty-free imports) on the value of exports. The combined export subsidies of between twenty three (in 1983) and fifteen (in 1984) percent of the value of exports were provided^. Also he analyzed that in the period between 1980-1984, the consumer goods had a share of fifty three and sixty three percent of total manufacturing exports with an average of fourty five percent subsidy. The capacity goods' share in manufacturing exports was calculated as less than 10 percent with an average of 20 percent total subsidy.
In this study, the aim of Milanovic is to differentiate between industries which have potential to exports and to
^ Total Subsidy Rate (%) is the ratio of Total Subsidy (TL Bill.) to Total Exports (TL Bill.). Three subsidies utilized by manufacturing sector are summed up to firid Total Subsidy.
enter foreign markets. So, he found the shares of each industries in both total manufacturing exports and total subsidies in order to evalviate the calibration of direct export subsidies (i.e. excluding exchange rate depreciation) for each industry.
In the same research, ililanovic constructed a simple regression model with real effective exctiange rate as the deperident variable and the volume of exports as an explained variable. He defined real effective exchange rate as a combination of real exchange rate and direct subsidies. Real depreciation of the Turkish Lira is considered to cause an increase in real exchange rate and as an indirect subsidy to exports. Accordingly, a distinction was made between the incentives as direct and indirect subsidies on export expansion. He concluded that responsiveness of manufacturing exports to incentives is higher in consumer goods as compared to the intermediate and capacity goods.
Danışman (1986) made a regression analysis to test the hypotheses of the effects of government trade policies on the expansion of export revenues. He used time series model with an estimation method of ordinary least squares. The aim was to test the statistical significance of export expansion in the period between 1981 and 1982. He constructed five equations for investigating export performance of Turkey both in nominal and real values. To deflate the nominal values he used export price index and he concluded that the expansion (boom) of exports in 1981 and 1982 depends on the export subsidies and increase in real exche.i:ige rates after January 1980, the new economic programs. He also tested the effects of trade policies on the major sectors^ of Turkey by using
^ He groups the main sectors as agriculture, mining and manufacturiiig sectors.
time-series model (1986:69-70). By these models he found the same argument with being the most particular expansion on manufacturing industries.
All the models he used, had an explanatory variable of time and a dummy variable of year 1981 and 1982^. So all the equations of the study had a high correlation of more than ninety percent meaning that the time and dummy variables explain growth of export revenues almost completely. However this may not support validity of the model constructed. In general, time series models have high correlation and provide clues about the past and current patterns of change but they do not signify the effectiveness of policies followed within these periods.
Fiğ lalı (1988) analyzed the effects of sxibsidies on export expansion for five sub-sectors of manufacturing iridustry. These five sub-sectors: food, leather, textile, chemicals and iron-steel; constitute the seventy percent of manufacturing exports. The study covers the period between January 1984 and December 1987.
The models constructed in that study were aimed to test the rate of change on exports by the utilization of certain subsidies and by the effects of world prices. She used export tax rebate lagged b y two months, payments from fund of support and price stability^, interest gain on preferential export credits and export price index as explanatory variables.
^ For year 1981 and 1982, dummy t r i a b l e equals to 1, otherwise 0.
^ Destekleme ve Fiyat İstikrar Fonu
She concluded that for all five sub-sectors, the export sxrbsidies except export credits had negative effect on export expansion. Her model explained 35 percent (r^) of the variations on export for sectors:food, leather and iron and steel and explained almost 70 percent (r^) of the variations for other two sectors.
She stated that these results were unexpected. In her model, all the variables were used in the reduced form that the different regulations utilized for different sxib-sectors may cause the unexpected results of this study.
3. SESEiSCH HETHODOLOGT
3.1. ^ p o t h e s e s
In this study, the importance of three subsidy policies and other incentives of export-oriented development strategy will be tested for the expansion of manufacturing exports.
Hypothesis states that export expansion in manufacturing industry can be explained by export subsidies, real effective exchange rate, labor wages and capacity utilization. Export subsidies included in the study are tax rebates, export credits and foreign exchange allocations. The hypothesis stated below is tested by regressing exports on these
)
multiple variables:
Xit=bj^i+b2TRit+b2ECit+b^FCAit+b0Ti7ERit+bgCUit+b?iFit+eit
(i=l,2.. N; t=l,2.. T) where
^li - Intercept for the i th individual - Manufacturing exports
- Exports receiving tax rebates at time t ECit - Export credits used at time t
FCAj^^ - Foreign exchange allocated at time t
TWER^^.- Trade weighted real effective exchange rate CUit - Capacity utilization index at time t
- Real wages paid at time t
H t - Disturbance term
As the data for each variable have different lenght of time period, the first model stated is regressed only for
five sectors of manufacturing industry; food and beverages, textile, iron and steel, leather and chemical (these five sectors have an average of seventy percent of the manufacturing exports) for the time period 1980-86.
The second model discussed in the study covers 14 sub-sectors and includes all variables for the time period 1980-85. Finally a model excluding export credits is regressed for 14 sub-sectors of the manufacturing industry between the time period 1980-1986.
3. 2. Hue Hethodology of Estimation
In this study, because the time period covered is short, cross-sectional data are used to estimate the effects of export subsidies and other policies related to exports of manufacturing industry. Estimation of the relationships that combine time series and cross-sectional data is a problem frequently encouiitered in econometrics (Hausman, 1978:1261) so, to handle this type of pooled cross-sectional and time series data, special econometric techniques are used.
According to Judge et al. (1985:515) "The problem when using these data to estimate a relationship, is to specify a model that will adequately allow for differences in behavior over cross-sectional units as well as any differences in behavior over time for a given cross-sectional units." In general, the models considered can be stated as
yit=^lit+ ^2it^2it+· ■ · * ^ K i A i t ®it ( 3 - 1 1 ) where.
i=l,2,...,N refers to cross sectional units t=l,2.. T refers to a given time period
In cross-sectional tine series, the following five cases are considered;
1. All coefficients are constant.
2. Slope coefficients are constant and intercept varies over individuals.
3. Slope coefficients are constant and intercept varies over individuals and tine.
4. All coefficients vary over individuals.
5. All coefficients vary over individuals and tine.
In this study, various export incentive policies are tested to derive their effects on overall manufacturing industry. The slope coefficients assumed to he constant in order to analyze the overall effects of incentives not the sectorial effects. It is also assumed that each sector has a different intercept relating with exports independent of the applied incentives. So, the model used in this study he.ve a varying intercept term over sectors and constant slope coefficients.
The model can be specified as
yit=l»^t+^it+eit (i=l,N;t=l,T) (3.1.2) where.
^it is the vector of individual (sectorial) effects and b is the vector of slope coefficients.
The appropriate estimation procedure for (3.1.2) depends upon whether the are assumed to be random or fixed. If the
are fixed, the dummy variable model, while if the are random, the error component model are used to estimate slope coefficients (Judge et a l . ,1985:519).
The decision whether are random or fixed depends on the number of observation covered in the study and also whether or not the individual effects (Yi) are correlated with explanatory variables.
According to Hausman (1978:1262) "The choice of the specification seems to rest on two considerations, one logical and the other statistical. The logical consideration is whether the Y^ can be considered random and drawn from i.i.d. distribution". The Y^ are random variables impling that N individuals (sectors) can be regarded as a random sample from a large population. In this study, the nvimber of sectors (at most 14) are not large enough to draw sectors randomly. As a result, it is unlikely that the error component model will yield reliable coefficients. The dummy variable estimators are used wider range of problems as there is no specific assiimptions about the distributions of Y^ (Judge et al. , 1985:527). So, in this study, the dummy variable model is used to estimate slope coefficients instead of error component model.
In most cross-sectional time series analysis, an explicit account are taken of the dependence that exists between independent variables and the effects i.e., whether E(Y^|Z^t)=0 (ilundlak, 1978:69). However, analysis of cross-sectional data alone can neither identify nor control such individual effects (Hausman, 1981:1377) that the hypothesis of no correlation between Y^ and cannot be tested statistically. So, one needs to be careful in making
assimption about individual effects. In this study, it is reasonable to assuiae that certain independent variables such as tax rebate are correlated with individual effects. Government favours certain sectors while determining the tax rebate rates in order to encourage exports of these sectors. So, it is apparent that there is at least correlation between individual sectors and tax rebates paid to that sectors.
Thus, the reasonable prescription is to use the dummy variable estimator as both Y
correlated and N is small.
and certain X i t ’s are
In the presence of correlation between independent variables and individual effects, ordinary least square yields biased and inconsistent estimates of the slopes. So,
the traditional technique to overcome this problem is to eliminate the individual effects in the sample by transforming data into deviations from individual means:
(Yit - Ti) = + ··· +
where, is the average of y^^· over time, is the average of the k th expiatory variable and is the average of the errors over time.
So, for such a model, the least square estimator is the best linear uiibiased and as the model utilizes the variations of the variables within each individual, it is also known as the "within estimator" (lladdala; 1977:326).
'I’he intercepts of the model can be estimated by
sectors.
3.3. Findings of Hie Study
3.3.1. tfodel 1
The first model in this study covers all the variables and five manufacturing sub-sectors for the time period of 1980-86;
(i=l,2.. 5; t=l,2_.,7)
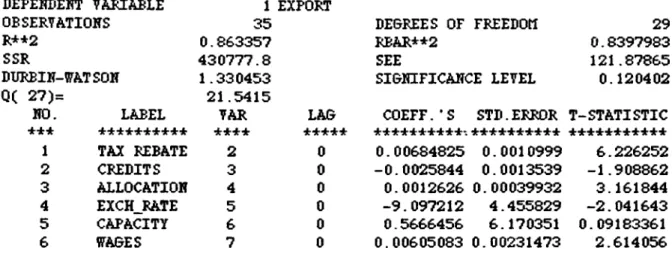
The data are transformed to averaged data over time and the ordinary least square estimation procedure is applied to the model. The estimated coefficients can be seen from Table 1. In that table, it is apparent that coefficients of export credits, trade weighted effective exchange rate and capacity utilization are insignificant at 5 percent level. Also, from covariance/correlation matrix, it can be seen that capacity utilization and trade weighted effective exchange rate are highly correlated. The utilization of these two variables within the model may cause multicollinearity so that capacity utilization is eliminated from the equation. In manufacturing industry, private firms capture almost sixty percent of total production, so, as the survey conducted by ICI covers 900 member firms of the chamber which are producing almost 30 percent of overall manufacturing goods, the data about capacity utilization may have bias regarding the indication of capacity changes in overall manufacturing iiidustry.
Thus, manufacturing exports are regressed again by excluding capacity utilization (Table 2). In this model, coefficient of determination (r^) is equal to almost 86 percent which means that the model explains eighty six percent of the variations on export. The model is
TABLE 1 DEPEMBEMT VABIABLE OBSERTATIOKS R**2 1 EXPORT 35 0.863357 DEBREES OF FREEDOM RBAR**2 29 0.8397983 SSR 430777. 8 SEE 121.87865 DURBIH-mTSON 1.330453 SIBNIFICANCE LETEL 0.120402 Q( 27)= 21.5415
HO. LABEL TAR LAB COEFF.’S STD.ERROR T-STATISTIC +** ·********** ***+ +·*+*·*++·***·:********** *********** 1 TAX REBATE 2 0 0.00684825 0.0010999 6.226252 2 CREDITS 3 0 -0.0025844 0.0013539 -1.908862 3 ALLOCATION 4 0 0.0012626 0.00039932 3.161844 4 EXCH_RATE 5 0 -9.097212 4.455829 -2.041643 5 CAPACITY 6 0 0.5666456 6.170351 0.09183361 6 7ABES 7 0 0.00605083 0.00231473 2.614056 COTARIAHCE/CORPJELATION MATRIX OF COEFFICIENTS
TARIABLE TAX REBATE CPPDITS ALLOCATION EXCH_PATE SERIES LAB 2 0 3 0 4 0 5 0 TAX REBATE 2 0 1.2098E-06 -0.27816 -0.11485 0.12205 CREDITS 3 0 -4.142E-07 1.833E-06 0.24997 -0.027297 ALLOCATION 4 0 -5.045E-08 1.3514E-07 1.5946E-07 0.22671 EXCH_BATE 5 0 0.00059817 -0.0001647 0.00040339 19.854 CAPACITY 6 0 0.00032178 -0.0022158 -0.0004336 20.835 1TABES 7 0 7.6374E-07 -9.464E-07 2.955E-07 -0.0022854
TARIABLE CAPACITY ffABES SERIES LAB 6 0 7 0 TAX REBATE 2 0 0.047413 0.29998 CBEDITS 3 0 -0.26523 -0.302 ALLOCATION 4 0 -0.17596 0.31969 EXCH_RATE 5 0 0.75779 -0.22158 CAPACITY 6 0 38.073 -0.085954 WABES 7 0 -0.0012276 5.358E-06 SECTORS FOOD TEXTILE LEATHER CHEtaCALS IRON-STEEL IMTERCEPTS 445.9325 1031.1985 338.7163 -302.0414 -422.1915 29
TABLE 2 DEPEMHEMT TABIABLE OBSERTATIOHS R*+2 SSR DURBIH-ffATSON Q( 27)= MO. *** 1 2 3 4 5 1 EXPORT 35 LABEL TAX REBATE CREDITS ALLOCATION EXCH_RATE VA&ES 0.863318 430903.1 1.335429 21.3699 VAR *+** 2 3 4 5 6 LAO
*****
0 0 0 0 0 DEGREES OF FREEDOM RBAR++2 SEE SIGNIFICANCE LEVEL 30 0.84509333 119.84755 0.125423 COEFF.’S **********-. 0.00684346 -0.0025514 0.00126905 -9.407295 0.0060691 STD.ERROR T-STATISTIC ********** ***********·* 0.00108035 0.00128365 0.00038654 2.858971 0.00226773 6.334467 -1.987631 3.283086 -3.290448 2.676289 COVARIANCE/CORRELATION MATRIX OF COEFFICIENTSVARIABLE TAX REBATE CREDITS ALLOCATION EXCH RATE SEPJES LAG 2 0 3 0 4 0 5 0 TAX REBATE 2 0 1.1672E-06 -0.27576 -0.10832 0.13214 CREDITS 3 0 -3.824E-07 1.6478E-06 0.21419 0.27609 ALLOCATION 4 0 -4.524E-08 1.0628E-07 1.4942E-07 0.56055 EXCH_RATE 5 0 0.00040814 0.0010132 0.00061947 8.1737
WhGES 6 0 7.4853E-07 -9.842E-07 2.7221E-07 -0.0015603
VARIABLE SERIES LAG iVAGES 6 0 TAX REBATE 2 0 0.30553 CREDITS 3 0 -0.33811 ALLOCATION 4 0 0.31054 EXCH_RATE 5 0 -0.24066 ffAGES 6 0 5.1426E-06 SECTORS INTERCEPTS FOOD 507.9337 TEXTILE 1093.5209 LEATHER 453.3303 CHEMICALS -242.1375 IRON-STEEL -366.2312
Xit=b+0. 0068TRi^-0. 0026ECi|.+0. 0013ГСА^^-9. 41Т»ЕР^^+0. 0061¥^^ (0.0011) (0.0013) (0.0004) (2.8589) (0.0023)
where,
b
is the vectors of intercepts (Table 2) and the standard errors are shown in paranthesis.¥hen the signs of the coefficients are analyzed, it can be seen that the export credits and the trade weighted effective exchange rate have negative signs and the others have positive signs. About the trade weighted effective exchange rates, it can be apparently seen from the Table 12 that this index has an inverse relation with the bilateral exchange rates (TL/$ or TL/DÍI) as the exchange rates in this index are taken as $/TL and Dll/TL. When the Turkish lira is devaluated, the bilateral exchange rate will increase but the trade weighted effective exchange rate will decrease accordirjgly. So, trade weighted effective exchange has the right sign. ¥hen the trade weighted effective exchange rate increases, the Turkish lira appreciates against dollar and mark and this will have a worse effect on the exports as the price of the domestic goods are increased given the world prices.
Although the t-statistic for export credits is significant, the sign of this coefficient being negative is an unexpected one. As the export credits are subsidy for manufacturer-exporters, the effect of this subsidy should be encouraging. Export credits are intensively utilized between 1980-84 as the effective interest rates were highly appealing at thst time. At the begining of the 1985, the export credits are totally eliminated that the amount of credits utilized at that year was zero. The deterioration of the data may be the cause of the unexpected sign of this variable.
Another case is the positive sign of the labor wages. As the decrease in labor wages lowers the production cost, price
of exportable goods decreases. The decline in price of exportables increases the deiaand for domestic goods in foreign markets. In this study, the data about payments made to employees include overtime, bonuses and pa^naents in kind. So, as it can be seen from Table 15, labor wages are not declining much between 1980-86. Thus, the expected negative relation between exports and wages was not seen in this study.
Other two subsidies, tax rebates and foreign currency allocations have encouraging effects on the manufacturing exports so, they have the right signs.
Durbin ¥atson statistic stated in Table 2 has no meaning in the cross section model. As in the cross-sectional time series, only the disturbance vector for given individual may follow a first-order autoregressive process. Accordingly, the DW-statistic given by computer which summarizes the nature of correlation between residuals without considering individual effect, has no meaning. According to Johnston (1984:400) in cross-sectional time series "it is usually assumed that the disturbance vector is homoscedastic and nonautocorrelated so that OLS provides b . 1.u.e.‘s . "
The models considered in this study are the restricted ones as it is assumed that there is a restriction of common vector of regression slopes and differential intercepts for all models. While the hypothesis that the slope coefficients are equal (test of differential slopes) is considered;
Hr
bo = bo — = bN
an unrestricted model should be also defined. The unrestricted model can be defined in the model with different intercepts and different slopes. Thus to test the hypothesis
of different slopes, the test statistic can be given as
F
[(RSSp-RSSu)/(dfp-df„)]
[RSS
tt
f dfy]
where.
RSSR
and
RSSU
residual
sum
of
squares
of
restricted
and
unrestricted models respectively. Also,
df R
and
df U
the
degrees
of
freedom
of
r
ricted
and
unrestricted models respectively.
As it can be seen from the Table 2, the sum of
square
iduals
(SSR) calculated
by
computer,
is the restricted
residual sum of squares with degrees of freedom of NT-K
By
applying OLS to the model;
n t
b li + b2i^2i +
+
^Ki^Ki
+
®it
i=l.
t=l.
,T
as a separate regression for each sub-sectors, will yield the
residual sum of
square
of
individual sectors (RSS
t
). Thus,
the unrestricted residual srm of squares can be calculated as
RSS„
RSS
+ RSSo ■
·
■
+ RSSjT
dfn is N(T-K)
According to Table 3, the test for common regression slope F<
2.1026, which
insignificant
so.
the
assumption
of
common
slope
coefficients
for
all
sub-sectors
not
rejected
3.3.2. Hodel 2
•me
econd model
in
the
study
also
covers
all
the
variables and fourteen manufacturing sub-sectors at the time
TABLE 3
F-TESI:
H : T est oT M ffe r e n c ia l Slopes
tfnXEL 1:
N = 5 T = 7
k = 6 (inclvuiiitg vector of intercepts) Reject H if F > F_critical(24,5)=4.53 Restricted RSS = Urii'estricted RSS = 430903.05 38846.58 F = (430903.05-38846.58/24)^(38846.58/5) = 2.1026 DO HOT REJECT HYPOTHESIS AS 2.1026 < F_critical
ttJDEL 2 :
H = 14 T = 6
k = 5 (including vector of intercepts) Reject H if F > F_critical(65,14)'^2.19 Restricted RSS = Unrestricted RSS = 266494.48 59106.53 F = (266494.48-59106.53/65)-f (59106.53/14) = 0.756 DO HOT REJECT HYPOTHESIS AS 0.756 < F_critical
moo. 3:
H = 14 T = 7
k = 4 (incl\jding vector of iiitercepts) Reject H if F > F_critical(52,28)'*'l .75 Restricted RSS = Unrestricted RSS = 518870.79 124819.36 F = (518870.79-124819.36/52)-r(124819.36/28) = 1.69991 DO HOT REJECT HYPOTHESIS AS 1.69991 < F critical
period of 1980-85:
(i=l,2.. 14; t=l,2.. 6)
As the data about the export credits cannot be extended to 1987, the utilization of all the variables in the model for all fourteen sub-sectors is longed to 1985.
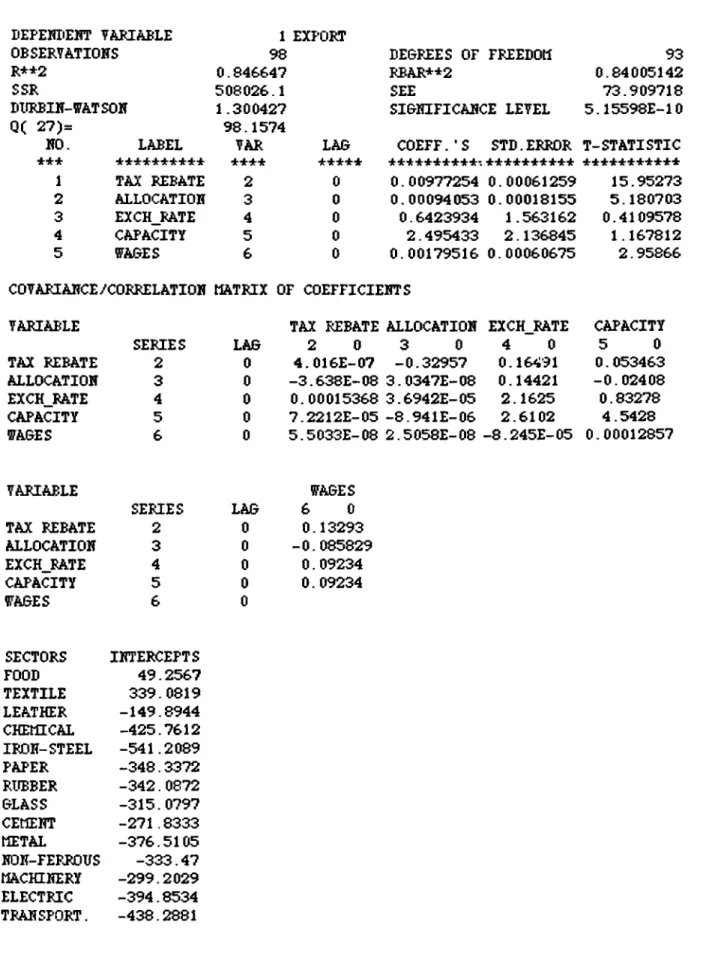
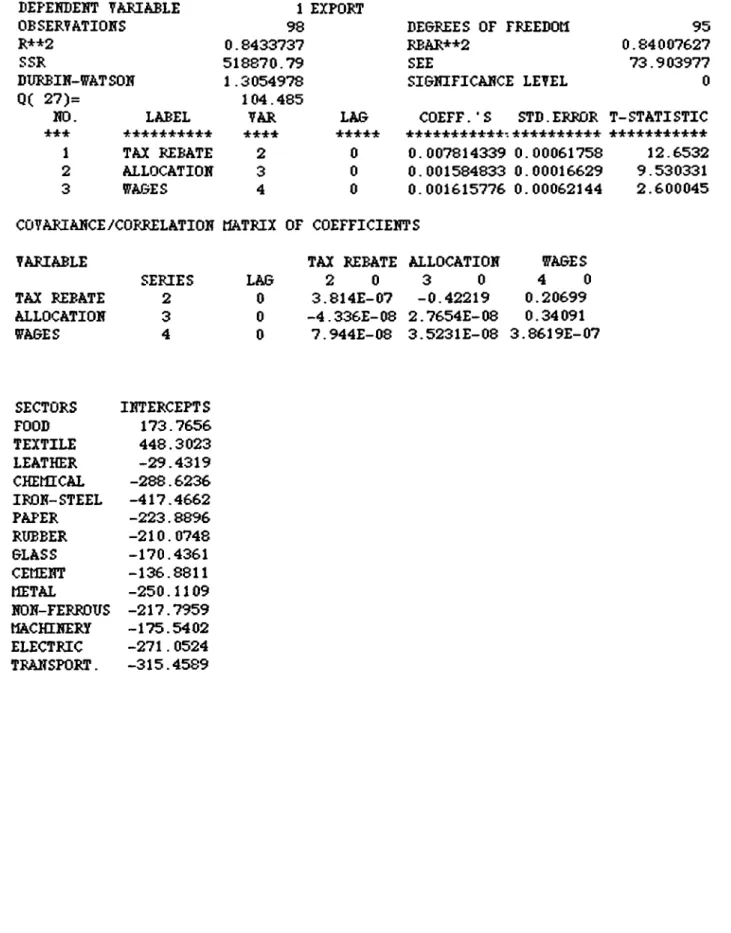
In this model, explanatory variables explains 90.6 percent of the variations on exports. However, as in the case of the first model, capacity utilization and trade weighted effective exchange rate are correlated and both are insignificant at 5 percent level (Table 4).
The capacity utilization is again eliminated and the model is regressed for other five variables (Table 5). This time, the model has an r^ of 90.5 percent but trade weighted effective exctiange rate is already insignificant at 5 percent level. Thus, this variable is also eliminated. Finally regressed model with four explanatory variables explains 90.3 percent of the variations on manufacturing exports and all the coefficients are significant (Table 6) . The model is
Xit = b + 0.0098TRjt - 0.0013ECit + 0.OOlOFCAi^ + 0.OOlOW^t
(0.00057) (0.00062) (0.00017) (0.00059)
where,
b
is the vectors of intercepts and the standard errors are shown in parenthesis.As the signs of each coefficient are same as in the case of the first model, the same explanations are valid for this model also.
When the test of the differential slopes is considered.
TA3LE 4 DEPEKDEMT TAPIABLE OBSERTATIOHS R**2 SSR DUREIN-ffATSOH Q( 27)= 1 EXPORT 84 MO.
1
2 3 4 5 6 LABEL ********** TAX REBATE CREDITS ALLOCATION EXCH_RATE CAPACITY WA&ES 0.906462 256452.4 1.647913 53.0446 TAR *+++ 2 3 4 5 6 7 LA& +++** 0 0 0 0 0 0 DEGREES OF FREEDOtl RBAR++2 SEE SIGNIFICANCE LEVEL COEFF.‘S **+*+***++·: 0.00977254 -0.0015065 0.00094053 0.6423934 2.495433 0.00179516 STD.ERROR +***++*+** 0.000612594 0.00063037 0.000181545 1.563162 2.136845 0.000606749 78 0.90046579 57.339789 0.00198778 T-STATISTIC *+***+*+**+ 15.95273 -2.389898 5.180703 0.4109578 1.167812 2.95866 COTAPIANCE/CORRELATION MATRIX OF COEFFICIENTSVARIABLE SERIES LAG TAX REBATE 2 0 CREDITS 3 0 TAX REBATE 2 0 3.7527E-07 -0.17006 CREDITS 3 0 -6.567E-08 3.9737E-07 ALLOCATION 4 0 -5.46E-08 2.6129E-09 EXCH_RATE 5 0 0.00033895 -2.306E-05 CAPACITY 6 0 0.00035363 -0.0001712 STAGES VARIABLE 7 0 4.6706E-08 -1.108E-07 CAPACITY WAGES SERIES LAG 6 0 7 0 TAX REBATE 2 0 0.27015 0.12566 CREDITS 3 0 -0.12711 -0.28968 ALLOCATION 4 0 -0.21002 0.26699 EXCH_RATE 5 0 0.88163 0.11361 CAPACITY 6 0 4.5661 0.20397 WAGES SECTORS 7 INTERCEPTS 0 0.00026445 3.6814E-07 ALLOCATION 4 0 -0.49091 0.022832 3.2959E-08 -2.3802E-05 -8.1475E-05 2.941E-08 FOOD TEXTILE LEATHER CHEMICAL IRON-STEEL PAPER RUBBER GLASS CEMENT METAL NON-FERROUS MACHINERY ELECTRIC TRANSPORT. -25.7599 215.6151 -278.5809 -491.4949 -528.3706 -457.9646 -446.9498 -436.1228 -385.6882 -465.9708 -430.2581 -404.673 -463.9942 -499.6358 EXCH_RATE 5 0 0.35396 -0.023403 -0.083875 2.4435 2.9448 0.00010775