1
Renewables, food (in)security, and inflation regimes in the Coastline
Mediterranean Countries (CMCs): The environmental pros and cons
Andrew Adewale ALOLA*, Kürşat YALÇİNER**, Uju Violet ALOLA***
Acknowledgement
Author’s gratitude is extended to the editor and anonymous reviewers that will/have spared time to guide toward a successful publication.
Funding
I hereby declare that there is no form of funding received for this study. Compliance with Ethical Standards
The author wishes to disclose here that there are no potential conflicts of interest at any level of this study
Abstract
In the present (21st) century, the pertinent challenge of attaining the regime of food security with low pollution, and amidst the drive for sustainable economy and energy efficiency is core to governance and intergovernmental agencies. Therefore, in an attempt to investigate environmental issues among the Coastline Mediterranean Countries (CMCs) for the first time, the current study examines the dynamic long-run nexus of carbon dioxide (CO2) emissions with food production and inflation rate over the annual period 1995-2014. Using a dynamic Autoregressive Distributed Lag (ARDL) approach, the consumption of renewable energy in
* Faculty of Economics, Administrative and Administrative and Social Sciences, Istanbul Gelisim University, Istanbul, Turkey * Corresponding: [email protected]
** Faculty of Economics, Administrative and Administrative and Social Sciences, Istanbul Gelisim University, Istanbul, Turkey E-mail: [email protected]
*** Faculty of Economics, Administrative and Administrative and Social Sciences, Istanbul Gelisim University, Istanbul, Turkey E-mail: [email protected]
2
the panel of sixteen (16) CMCs is empirically observed to be an efficient policy vehicle for mitigating CO2 emissions. Also, in all the examined CMCs, consumption of renewables is observed to cause significant decline in CO2 emissions, thus securing a sustainable environment. However, in the long run and in the panel of CMCs, the study reveals that increase in food production (a drive toward food security) increases environmental risk. Additionally, the study found that high inflation regime in the panel CMCs is associated with low CO2 emissions especially in the long-run, thus necessitating efficient policy mechanism. In adopting the genetic resources of the International Treaty on Plant Genetic Resources as well as employing price control policy, the members of the CMCs might have unearth a suitable policy directive in effectively sustaining environmental quality.
Keyword: Sustainable environment; food security; renewable energy consumption; inflation; Coastline Mediterranean Countries (CMCs).
1. Introduction
Mitigating the adverse effect of desertification, land degradation, and ecological distortions have continued to prompt discussion fora among researchers, environmental scientist, and stakeholders. Importantly, with the projected population of 9.5 billion people by 2050, meeting the growing needs of human will unlikely be possible without environmental damages (Davidson et al., 2015; Norse et al 2015). For instance, the increasing energy consumption and land use through agricultural activities will expectedly remain the main sources of the upstream and downstream environmental hazards. This is why the greenhouse gas (GHG) emissions has remained the source of the world’s most hazardous substances affecting the natural ecosystem and human development (Alola, 2019a &b). Evidently, greenhouse gas emissions has remained a causative agent of the global adverse effect of the climate change. In spite the stakeholders’ commitment in addressing this global challenge, turning down the global heat has remained a
3
herculean policy pathway. For instance, the Intergovernmental Panel on Climate Change (IPCC, 2014) reported that carbon emissions (like the Carbon dioxide, CO2) has unexpectedly increased from 9434.4 million tons in 1961 to 34649.4 million tons in 2011. As reported by the British Petroleum (BP) Statistical Review of World Energy (BP, June 2018), the emissions of CO2 increased from 29714.2 million tons in 2009 to 33444.0 million tons in 2017. Even in the advent of the Paris Agreement of 20151 and the determination to reducing carbon emission by countries of the world, the emissions of co2 is largely yet to be contained. According to the BP report, emissions in the European region is only second to the Middle East countries that is averagely observed to be about 2.9%. Also, except for the few North African countries, majority of the Coastline Mediterranean Countries (CMCs) lies in the aforesaid regions (European and Middle East) with the two most emitted carbon dioxide.
Subsequently, the process of turning down the heat i.e cutting down carbon dioxide emissions in these regional countries and in other large economies of the world have intensified the development of the renewable energy sources. For instance, France, Spain, Italy, Slovenia, and Israel are among the CMCs at the forefront of pushing for more development of the renewables. In 2017 for instance, the Europe’s fourth largest investment in renewable energy came from France with $2.6 billion (United Nations Environment Program, UNEP, 2018). Resulting from this investment, thousands of Megawatts of renewable energy sources was generated to produce electricity during the previous year 2017 (International Renewable Energy Agency IRENA, 2018). Generally, the Eastern and Southern Mediterranean region are naturally endowed with abundant renewable energy resources like solar and wind energy sources. On
1 More details relating to the Paris Agreement of 2015 is contained is available at:
https://unfccc.int/process/conferences/pastconferences/paris-climate-change-conference-november-2015/paris-agreement.
4
that note, addressing the challenges of climate change in the aforesaid region presents alternative energy portfolio that are capable of initiating economic transformation of the CMCs.
In another dimension, the drive toward attaining food security and by achieving part of the Sustainable Development Goals (SDGs) 2030 has been challenging in most countries and processes has been without causing significant setback on the pathway of cleaner and quality environment. This is because food security is synonymous with increased and effective food production, thus implying more agricultural and land use activities (Alola & Alola, 2019; Uzuner & Adewale, 2019). These activities include combustion of (agricultural) wastes, deforestation, production of food tree and vegetation, cultivation and expansion of land for grain crops, irrigation, and among others. For instance, the processes and systems of crop production, chemical manures and fertilizer management are significant sources of upstream and downstream pollution dynamics (Velthof, Kuikman & Oenema, 2003; Snyder, 2009). Specifically, in the Mediterranean region, the change in the agricultural activities of the region (Tanrivermis, 2003; Galli et al. 2017; Alola & Alola, 2018) has been largely linked with the region’s soil and water quality (Zalidis, et al., 2002; Serpa et al., 2017; Segurado et al. 2018). Recently, certain Coastal Mediterranean areas have been linked with high environmental risk (Marignani et al., 2017), just as diffuse pollution from agricultural activities has been traced across the three Mediterranean river basins in the study of Lutz et al (2016).
Interestingly, neither of the aforementioned potential determinants of environmental degradation is totally independent of the economic and financial performance of a state. Illustratively, and in extant literature, studies have empirically linked the dynamics of environmental quality to the economic growth, thus prompting several conclusions like the
5
Environmental Kuznets Curve2 (EKC) hypothesis. However, several economic, financial and socioeconomic indicators that affects environmental quality (these include trade openness, financial development, public expenditure, foreign direct investment, among others) are connected with the inflationary dynamics. For instance, in the recent study of Alam et al. (2015), the research noted the significant and negative correlation between CO2 and the Consumer Price Index (CPI). In reality, the stock market and financial development which are relatively determined by inflation rate are observed to increase the volume of CO2 in the atmosphere (Zhang, 2011). As such, the perceived relationship between inflationary dynamics and carbon mitigation could be understood from the context of the inflationary effect of carbon tax and the general economy context. On one hand, carbon tax is believed to have a trigger inflationary effect on the components of the power sector, thus responsible for carbon mitigation (Ekins, 1994; Dejuán, Lenzen & Cadarso, 2017; Bloomberg, 2019). On the other hand, high financial costs, higher operating risk resulting in relatively low project financing, investments, and declining energy consumption are assumed to cut the emission of CO2 during lower inflation regime.
Given the complexity of environmental pollution associated with the drive toward attaining food security vis-a-vis food production sufficiency amidst clean energy consumption and economic sustainability as motivated above, the current study is designed to underpin this trilemma within the geographical framework of the Coastline Mediterranean Countries. The essence of considering the CMCs is because of it economic relevance, geographical location, and the possibility of the water mass being a potential source of pollution. Hence, the current study examines how the complexity associated with the dynamics of food production,
2 Details on the Environmental Kuznets Curve (EKC) hypothesis as forwarded by Grossman and Krueger (1995) is available in Grossman, G. M., & Krueger, A. B. (1995). Economic growth and the environment. The
quarterly journal of economics, 110(2), 353-377.
6
renewable energy consumption and inflation affects the environmental pollution of the CMCs (namely Albania, Algeria, Bosnia and Herzegovina, Cyprus, Egypt, France, Greece, Israel, Italy, Lebanon, Malta, Morocco, Slovenia, Spain, Tunisia, and Turkey). Until now, among the studies that have separately investigated either agriculture-related or pollution-related topic in the Mediterranean region (Zalidis, et al., 2002; Lutz et al 2016; Galli et al. 2017; Marignani et al., 2017; Serpa et al., 2017; Alola & Alola, 2018), none (according to authors observation) have shown the link between the two factors. Hence, by employing empirical methods in the current study, the result is expected to additionally fine tune the existing literature by presenting specific novelty accordingly:
In addition to examining the trilemma effects of food production, renewable energy consumption amidst the price inflation on the environmental quality, the long-run and short-run impacts are analyzed. In doing, the study obviously advances the study of Galli et al. (2017).
Also, except the studies of Alola and Alola (2018) and Alola, Alola & Saint Akadiri, 2019), no other existing studies have specifically focused on the CMCs. However, the current study is the first to specifically investigate and reveal the environmental interests and implications for the CMCs
Lastly, by employing the Dumitrescu and Hurlin (2012), the study uniquely to underpin the Granger causality and interaction between the observed factors, thus revealing a unique underpinning of historical information among the observed factors.
The algorithm of the sections is presented thus. Section (2) contains a synopsis of the extant and related literature. The materials and methods adopted for the investigation are the focus of section 3 while the results are discussed thereafter in section 4. Section 5 offers the conclusions with include policy implications.
7 2. Previous studies: A synopsis
The importance of attaining economic, social, and environmental sustainability as further put forward by the SDGs 2030 of the United Nations (UN) is responsible for the sporadic studies that have continued to address the topical issue. For instance, the desire to mitigate poverty by engaging in more crop cultivation which leads to more application of fertilizer Nitrogen (N) is largely responsible for the atmospheric concentration of ammonia (NH3), nitric oxide (NO), nitrous oxide (N2O), among others (Davidson et al., 2015). This is why the study of Jarecki, Hatfield and Barbour (2015) and Fernández, Terry and Coronel (2015) on corn cultivation in Iowa and Illinois respectively are associated with the emissions of N2O from the farmlands. Consequently, both the aforementioned studies practically designed formulations that potentially curtails the impacts of the sources of N fertilizers (keep it within the IPCC range of 0.3% to 3%).
In addition to the assertion of the overuse of synthetic Nitrogen (like the N fertilizers) as one of the consequence of agricultural activities on the environment, Norse and Ju (2015) further illustratively identified the degree of environmental cost from the mismanagement and excessive use of manure and livestock wastes, excessive use of irrigation, inefficient land management. The study identified the challenges of indiscriminate disposal and storage of urine or fecal matter from livestock resulting from manure mismanagement. It maintained that the discharges from the mismanagement of manure is the major source of point pollution, estuarine eutrophication, and rise in the emissions of ammonia and N2O. On the other hand, the leaching of N, and N2O emissions is associated with either excessive irrigation or wrong timing of irrigation. In addition to these effects associated with the misuse of irrigation, Norse and Ju (2015) maintained that the environmental damages caused by land mismanagement vis-à-vis soil erosion resulting from deforestation and burning of grassland is too grievous to be unnoticed. However, in the same study, Norse and Ju (2015) interestingly observed that the
8
increasing level of GHG (such as CO2) emissions is potentially associated with the short to medium term and long term increase in some crop productions (for example maize) respectively.
Moreover, the investigation of the relationship between renewable energy consumption and environmental sustainability has remained on the spotlight in the last decades (Alola, Bekun, & Sarkodie, 2019 Alola et al., 2019; Saint Akadiri et al., 2019). In doing, studies between these macroeconomic variables have largely been reported for many countries: Bekun, Alola & Sarkodie (2019) reported for panel of European Union member countries, sub-Saharan Africa was investigated by Hanif (2018), and Nguyen and Kakinaka (2019) reported for panel of 107 countries. But while studies have identified the negative relationships between the renewable energy consumption and environmental pollution, number of extant literature have noted a positive association. However, in some cases such relationship is observed to be either weak or non-existence (Jebli & Youssef 2015; Al-Mulali, Ozturk & Solarin (2016)). For instance, Nguyen and Kakinaka (2019) empirically noted that a positive and negative relationship is observed between the renewable energy consumption and emissions in low-income and high-income countries respectively. Thus, concluding that the nexus of renewable energy consumption and emissions is a reflection of the development stage. As one of the CMCs, the case of Turkey as investigated by Pata (2018) presents an interesting result. In the study, Pata (2018) empirically noted that the consumption of renewable energy in Turkey is yet to be seen as an efficient policy mechanism toward achieving a cleaner and sustainable environment. Additionally, while investigating for Tunisia (another CMC), Jebli and Youssef (2015) found that the impact of renewable energy on CO2 is although weak, it is significant and negative.
However, the carbon tax and other emission-targeted policies that are being employed toward attaining a low carbon and environmental sustainability are mostly with macroeconomic merits
9
and demerits. For instance, evidence has shown that there is a meditative inflationary effect as well as it positive effect of reducing distortionary taxes, offset competitiveness effects, and stimulation of innovative and efficient energy sector (Ekins, 1994). While corroborating this evidence, Andersson (2018) noted that the consumer prices, investment prices, export and import price effects are the observed inflationary dynamics of carbon price that result in carbon emission mitigation. Importantly, the study informed that three different inflationary effects are classified in the context of carbon price. Andersson (2018) revealed that the inflationary effect in the developing countries is larger and potentially almost not practical compare to the inflationary effects in the developed countries. Similarly, Benavente (2016) study implied that carbon tax is responsible for 2% reduction (inflationary effect) in the Gross Domestic Product (GDP) of Chile in 2010. Consequently, the inflationary effect produced a 20% reduction of annual emissions because the fossil fuels generation was cut by 11% while the renewables generation increased by 43% (Benavente, 2016). The study noted that the hike in the price levels is directly associated with the resulting increase of the electricity price by 8% in the same period. Hence, while the Chilean government is building on the success of achieving its commitment to reducing greenhouse gas by 20% by 2020, the national government is also tasked with quantifying the resulting inflationary effect on the economy.
3. Materials and Method
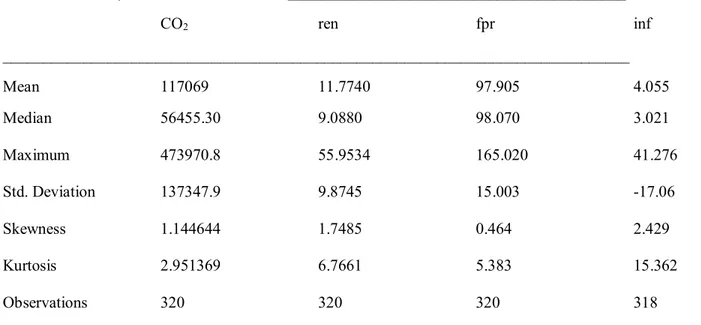
The materials employed for this investigation are the derived from the available data obtained from selected CMC countries. A selection of sixteen (16) countries of the total of 23 CMCs (CMC-16) with annual data composition spanning for the period 1995-2014 is employed for the investigation. The following materials employed were all collected from the World Development Indicators (WDI, 2019) of the World Bank online database and the common statistics are presented in the Table A of the appendix.
10
Carbon dioxide (CO2) is a proxy for carbon emissions which is measured in kilotons per capita and a major determinant of environmental sustainability.
Food production index (fpr) is a proxy for food security. The fprinclude food crops that are considered edible and that contain nutrients. According to the World Bank database, coffee and tea are excluded because, although edible, they have no nutritive value.
Renewable energy consumption (ren) is the share of renewable energy in the total energy consumed in kilotons.
Inflation rate (inf) (as measured by the consumer price index) reflects the annual percentage change in the cost to the average consumer of acquiring a basket of goods and services. This may be fixed or changed at specified intervals, such as yearly.
<Insert Table A>
3.1. Method of experimentation
In advancing the concept of environmental sustainability, the current study incorporates inflation rate and food production index to the related models employed in the previous empirical models (Bekun, Alola & Sarkodie, 2019; Bekun, Emir & Sarkodie, 2019; Destek & Sarkodie, 2019). Also, the incorporated price inflation is in lieu of the trade and monetary policies employed in Alola (2019). Moreover, the estimate of the correlation matrix (see lower part of Table 1) between the explanatory variables (food production, renewable energy consumption, and inflation) and the CO2 are all significant. Hnce, the current model is presented in equation (1) as:
CO2 = f (fpr, ren, inf) (1)
Such that the dynamic nexus of equation 1 is determined by transformation to linear logarithmic model which is presented as:
11
2 3
2 0 1logfpr inf
log
CO
ren
(2)<Insert Table 1> 3.1.1 The Dynamic ARDL Pooled Mean Group Approach
The empirical method employed for the current study relies on the advantage of the Autoregressive Distributed Lag (ARDL) model. The ARDL’s advantages are centered on the model’s appropriateness for either I (0) or I (1) as indicated in the panel unit root estimations of Table 1. Also, as an alternative model to the Generalized Method of Moments (GMM) estimation technique, the Pooled Mean Group (PMG) estimation of the ARDL is considered effective. This is because the PMG adopts the cointegration form of the ordinary ARDL model as proposed by Pesaran, Shin and Smith (PSS, 1999). Importantly, the automatic lag selection by the information criteria is enhanced such that the panel estimation presents the lag length (which is selected as 3 by the Akaike Information Criteria-AIC) for the estimated equation 2 above, for the explanatory (q) and the dependent (p) variables are presented in the equation below: 1 1 , , , , , , , 0 1 q p i t i i t i t i t j i j i t j i t j j
EC
A
B
A
(3)here, the error correction is
, 1 ,
, i t i t
i t
EC
A
B
. The adjustment coefficients and the
long-run coefficients are respectively given as and θ such that B = f (logCO2, ren, inf) for model. And A is the dependent variable, CO2. The model specifications ARDL (3, 3, 3, 3) presents the result output which is shown in Table (2).
<Insert Table 2> 3.1.2. Robustness Tests
Foremost in this study, a robustness test is employed by incorporating additional variables in the main model (equation 1) employed in the investigation. In this case, the total energy use (energy) which is a known determinant of environmental degradation vis-à-vis carbon
12
emissions is now employed in lieu of the renewable energy. In addition, the ratio of food production to the GDP is incorporated as a proxy for food security (fsecurity) such that the previous model (equation1) is now been re-expressed as
CO2 = f (energy, fsecurity, inf) (4)
Hence, the above previously employed ARDL dynamic estimation approach is employed to such that a new result is obatined which is presented in Table B of the appendix.
<Insert Table B>
In addition to the above robustness test, the study employs the panel Granger causality approach as an extra robustness check. The applied panel Granger causality test is the Dumitrescu and Hurlin (2012) Granger causality for heterogeneous non-causality. This test is considered appropriate when either of T or N is larger than the other. Also, the first difference of the variables under investigation is being employed in accordance to the condition underlying the use of the Dumitrescu and Hurlin (2012) approach. Having been built on vector autoregressive model (VAR), the estimation technique is robust especially when there is evidence of cross-sectional dependency. The asymptotic and the semi-asymptotic are the two observable and distinctive distributions in this test. On one hand, the asymptotic distribution is employed when T is larger than N, and in a case when N is larger than T, the semi-asymptotic distribution is considered suitable. The linear model representation in the current case where T = 20 and N = 16 is given as follows:
(p) (p) , , , 1 1 p p it i i t p i i t p i t p p A A B
(4)Where p depicts the lag length, i(p) represent the parameter of the autoregressive part, while
(p)
i
represents the regression coefficient which is allowed to vary within the groups. The
estimated variables A and B illustrates the pair match of the four variables under investigation. The causality test is normally distributed and at the same time it allows for heterogeneity. The
13
Homogenous non-stationary hypothesis (HNC) is the expression term employed to convey the hypothesis of the causal relationship with the estimate of the heterogeneous models. For brevity, the expression of the hypotheses is not provided here but the Table 3 presents the results of the causal relationships in the macro panel.
<Insert Table 3>
4. Results and Discussion
The results of the stationarity tests indicated in Table 1 (upper section) is an indication that the series exhibits a mixed order integration, thus paved way for the use of the PMG of ARDL approach. In Table 1 (lower part), the correlation between CO2 and the explanatory variables are observed to be significant. Indicatively, CO2 is negatively correlated with ren, positively correlated with fpr, and negatively correlated with the inflation rate (inf). While both the series ren and fpr exhibits no cross-section dependence in the panel countries, the series inf and CO2 are found to be cross-sectional dependent in the panel countries. However, the model result indicates that there is no cross-section dependence in the panel countries (see Table 1), thus encouraging the use of the first generation estimation modelling for the investigation.
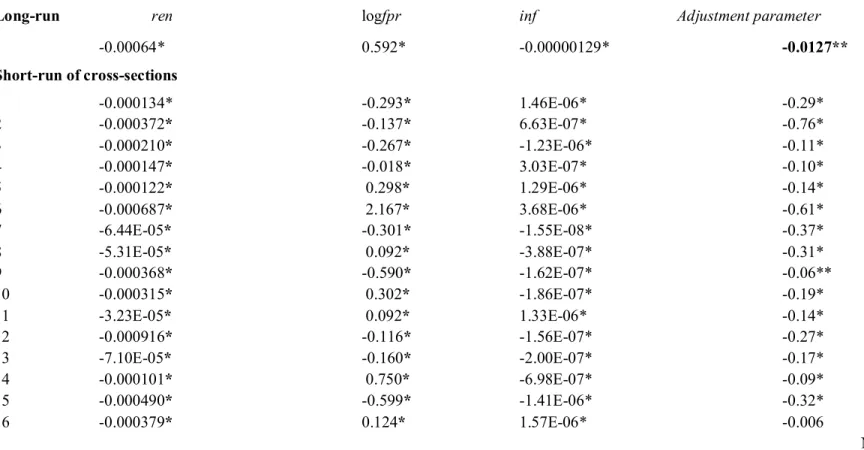
Importantly, the Table 2 presents the results of the relationships between the CO2 emissions (proxy for environmental sustainability) and the consumption of renewable energy, food production, and the inflation rate. The system is observed to adjust very slowly by 1.3% from a situation of short-run disequilibrium. For the nexus of CO2 and renewable energy, the result identifies a significant and negative relationship in the long-run. This implies that one kilotons of the share of ren in total energy consumption will cause 0.064 kilotons per capita of CO2 emissions in the panel countries. As such, the current result of the association between CO2 and ren is consistent with the observation of Nguyen and Kakinaka (2019) especially for the high-income countries. In addition, this result is consistent with other empirical investigation
14
of the CMCs countries (Bölük & Mert, 2015; Jebli & Youssef, 2015). But, interestingly the recent study by Pata (2018) contradicts the negative relationship assertion of Bölük and Mert (2015) for the case of Turkey. The reason could simply be because; (1) the Bölük and Mert (2015)’s study was strictly based on the consumption of only electricity from renewable energy without the hydro power source, and (2) the use of an updated data (period dated to 2014) in the study of Pata (2018) which further reflects the significant industrial, production, and total expansion of the Turkish economy. However, the reported investigation of Al-Mulali, Ozturk and Solarin (2016) outlined lack of significant relationship between duo in the Middle East, North Africa, and the Sub-Sahara Africa regions.
Similarly, the long-run relationship between the CO2 emissions and food production is empirically observed to be positive (see Table 2). It simply implies that an increase by 1% of food production will potentially increase the CO2 emissions per capita by 0.59%. Considering the agricultural activities generated by the process of food production, the observation from the current study is consistent with the extant studies (Norse & Ju, 2015, Hatfield & Barbour, 2015, Fernández, Terry & Coronel, 2015). Likewise, the result of the relationship between the CO2 emissions and the inflation rate is significant and negative. As a reflection of the study by Alam et al. (2015), the current implies that a percentage increase in the inflation rate will potentially cause an increase of 0.00013 kilotons per capita emissions of the CO2. Although the impact of the increase in the price level on the carbon emissions in the panel of CMCs is observed to be low, the effect is however significant.
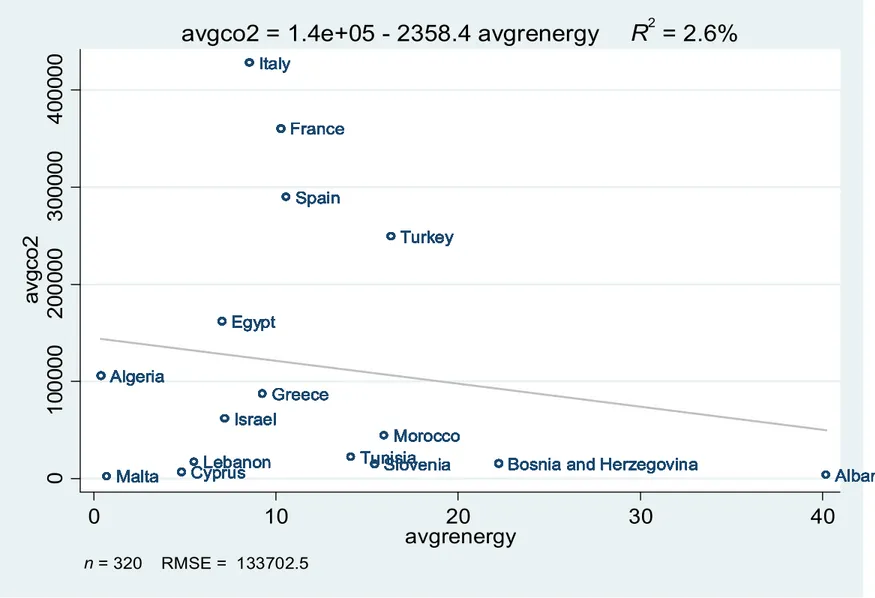
However, the short-run cross-section (individual country) result of Table 2 shows that the nexus of CO2 and renewable energy consumption is negative in all the countries. The indication implies that the renewable energy consumption of the CMCs is good enough as policy mechanism toward mitigating CO2 emissions. Also, visual evidence from Figure 1 reveals that while Albania and Bosnia and Herzegovina are the two countries leading with high average
15
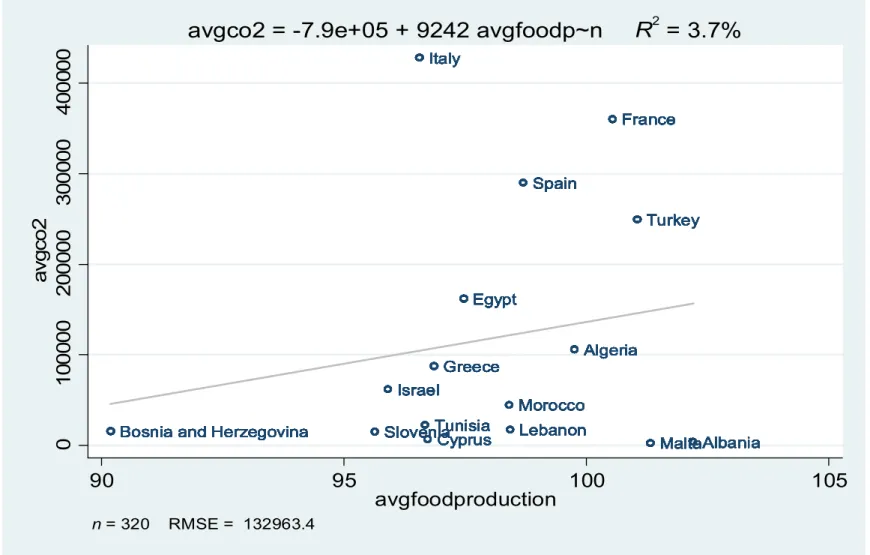
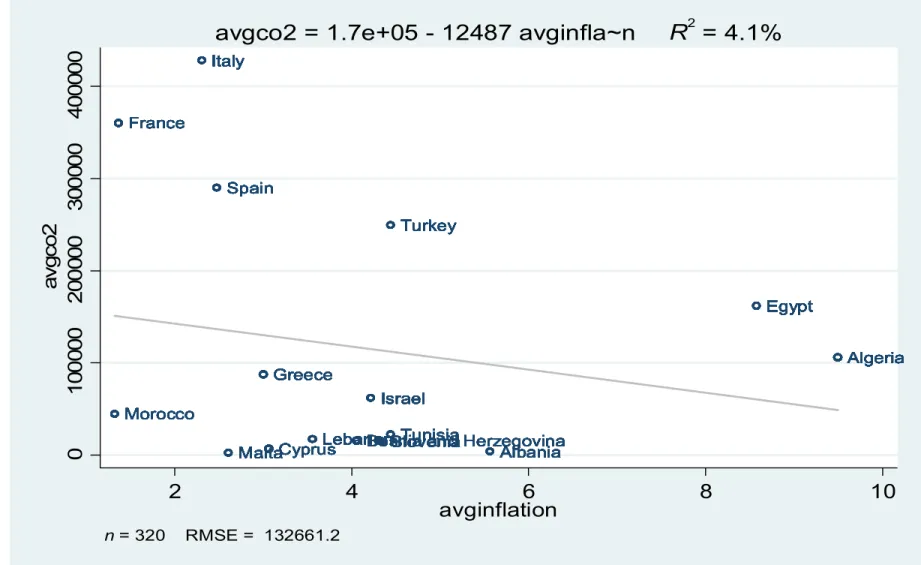
renewable energy consumption (avgrenergy) and low average CO2 emissions (avgCO2), Italy, France and Spain are still emitting high average CO2 (avgCO2) amidst their low renewable energy consumption potential. Similarly, the short-run cross-section nexus of average CO2 emissions (avgCO2) with average food production (avgfoodproduction) and average inflation rate (avginflation) are both mixed of positive and negative impacts among the observed CMCs. Also, the Figures 2 and 3 presents the visual observations of the nexus of average CO2 (avgCO2) with the average food production (avgfoodproduction) and average inflation (avginflation) respectively. In both cases (Figures 2 and 3), Italy, France and Spain are leading in CO2 emissions under the circumstances of high food production and low inflation rates.
<Insert Figure 1> <Insert Figure 2> <Insert Figure 3>
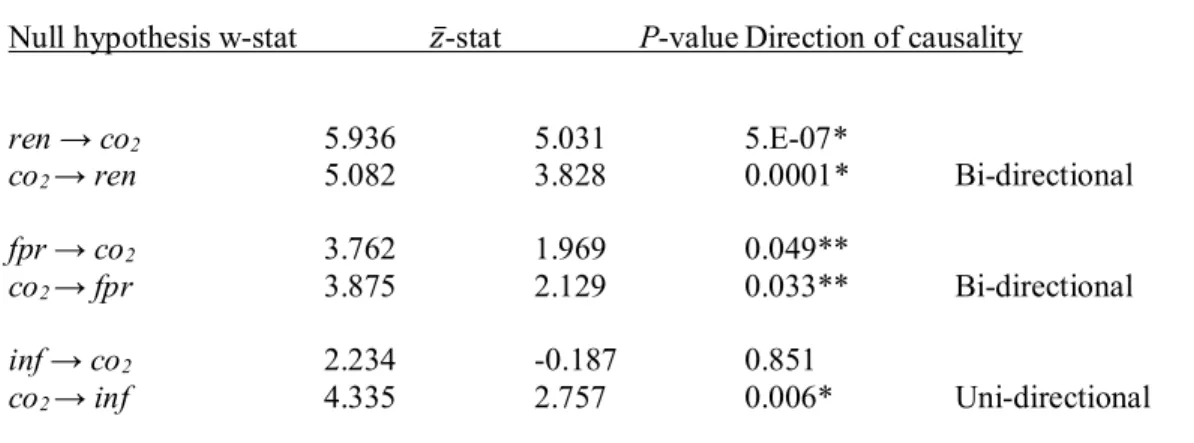
Lastly, in addition to the diagnostic test employed to examine the cross-section dependency in the panel, both the Granger causality test and re-estimation of the dynamic ARDL by incorporating new variables were utilized as a robustness check. For instance, the result of the re-estimation as indicated in Table B corroborates the previous result. By employing the ratio of food production to GDP as the food security, the result implies that 1% increase in food security will cause 0.013% increase in carbon emissions even as inflation is observed to exert a negative and significant impact on carbon emissions. Expectedly, the impact of total energy use on carbon emissions is positive, thus indicating 1% increase in energy use leads to 1.47% of carbon emissions. Additionally, the result of the Granger causality (see Table 3) among the observed variables is desirable. As obviously observed, the Granger causality running from the consumption of renewable energy to CO2 emissions is significant and with feedback. Also, there is a significant Granger causality running from the food production to CO2 emissions per capita, and it is with feedback. However, the significant Granger causality running from CO2
16
emissions per capita to inflation rate is without feedback, meaning that the historical (previous) values of the inflation rate are not appropriate in explaining the future volume of CO2 emissions per capita.
5. Conclusions and Policy Implication
This study produces the desired result of investigating the nexus (long-run and short-run relationship) of environmental sustainability (CO2) emissions with the renewables (renewable energy), food (in) security (food production). and the inflation dynamics in the panel of CMCs (namely Albania, Algeria, Bosnia and Herzegovina, Cyprus, Egypt, France, Greece, Israel, Italy, Lebanon, Malta, Morocco, Slovenia, Spain, Tunisia, and Turkey). In doing so, the study employed the annual data for the period 1995-2014. Consequently, a negative and significant relationship is observed between the CO2 emissions and the renewable energy consumption in the long-run. This implies that renewable energy consumption in the panel of CMCs has the potential to ensuring a sustainable environment in the long-run. While a positive relationship is ensued between the CO2 emissions and the food production, the relationship between the CO2 emissions and the inflation rate is significant and negative in the long-run. This result is of useful interest considering that it signifies a more food secured CMCs can only be attained with a potential cost to the quality of the environment, thus leading to unsustainable environment in the long-run. Likewise, the empirical result shows that it is only during a high inflation regime (which implies unstable or unhealthy economy) that the environmental sustainability of the CMCs can be secured in the long-run. Hence, the aforementioned observations and the Granger causality results respectively expressed in Tables 2 and 3 is not without suggestive policies for implementation.
Importantly, the indications from the impact of food (in) security, renewable energy consumption, and the inflation dynamics on the environmental sustainability of the CMCs provides valid policy frameworks. Hence, the policy vehicles from the perspectives of food
17
(in) security vis-à-vis food production, renewable energy consumption, and the inflation regime dynamics are carefully outlined.
For food production: Giving the undoubtable effects of synthetic fertilizers and heavy mechanization on the soil and the environment, more research that is geared toward the discovery of genetically improved crop seedlings should be encouraged. The improved genetically modified crop variety should be such that is less-reliant on synthetic fertilizers, yet a potential for higher yields. Hence, the programs and resources of the International Treaty on Plant Genetic Resources (ITPGR) of the United Nations of Food and Agriculture (FAO) should be strongly encouraged among the CMCs. Also, policy tools to reduce food price volatility should be encouraged.
On renewable energy consumption: Despite the desirable impact of renewable energy consumption as observed in the result, the CMCs are encouraged to further deepened the invisible aspect of energy i.e. the energy efficiency strategies. Thus the drive to attaining the mandatory energy efficiency standards should be sustained among the CMCs. This can be achieved by harnessing the energy efficiency resources across the sectors of the concerned states.
On inflation regime dynamics: Although there has been consistent advocacy for carbon tax especially among the advanced states, the inflationary effect on consumer goods and the eventual carbon emissions reduction is always a dilemma. Hence, an approach that carefully quantifies the inflationary effects should be employed. These approach could consider using the tax revenue as subsidies for the households and end-users of energy and subsidies on energy technologies. Additionally, public private partnership policy should be encouraged because a more sustainable environment entails investments that are capital-intensive enterprises. Such investments are essentially
18
suitable for the stability of the economy indices while contributing zero risk to the environment.
References
Alam, A., Azam, M., Abdullah, A. B., Malik, I. A., Khan, A., Hamzah, T. A. A. T., & Zaman, K. (2015). Environmental quality indicators and financial development in Malaysia: unity in diversity. Environmental Science and Pollution Research, 22(11), 8392-8404. Al-Mulali, U., Ozturk, I., & Solarin, S. A. (2016). Investigating the environmental Kuznets curve hypothesis in seven regions: The role of renewable energy. Ecological indicators, 67, 267-282.
Alola, A. A., & Alola, U. V. (2018). Agricultural land usage and tourism impact on renewable energy consumption among Coastline Mediterranean Countries. Energy & Environment, 29(8), 1438-1454.
Alola, A. A. (2019). The trilemma of trade, monetary and immigration policies in the United States: Accounting for environmental sustainability. Science of The Total Environment, 658, 260-267.
Alola, A. A. (2019). Carbon emissions and the trilemma of trade policy, migration policy and health care in the US. Carbon Management, 10(2), 209-218.
Alola, A. A., & Alola, U. V. (2019). The dynamic nexus of crop production and population growth: housing market sustainability pathway. Environmental Science and Pollution Research, 1-9.
Alola, A. A., Alola, U. V., & Saint Akadiri, S. (2019). Renewable energy consumption in Coastline Mediterranean Countries: impact of environmental degradation and housing policy. Environmental Science and Pollution Research, 1-13.
19
Alola, A. A., Bekun, F. V., & Sarkodie, S. A. (2019). Dynamic impact of trade policy, economic growth, fertility rate, renewable and non-renewable energy consumption on ecological footprint in Europe. Science of The Total Environment, 685, 702-709. Alola, A. A., Yalçiner, K., Alola, U. V., & Saint Akadiri, S. (2019). The role of renewable
energy, immigration and real income in environmental sustainability target. Evidence from Europe largest states. Science of The Total Environment, 674, 307-315.
Andersson, F. N. (2018). Estimates of the Inflation Effect of a Global Carbon Price on
Consumer, Investment, Export, and Import Prices (No. 2018: 22).
Bekun, F. V., Alola, A. A., & Sarkodie, S. A. (2019). Toward a sustainable environment: Nexus between CO2 emissions, resource rent, renewable and nonrenewable energy in 16-EU countries. Science of The Total Environment, 657, 1023-1029.
Bekun, F. V., Emir, F., & Sarkodie, S. A. (2019). Another look at the relationship between energy consumption, carbon dioxide emissions, and economic growth in South Africa. Science of The Total Environment, 655, 759-765.
Benavente, J. M. G. (2016). Impact of a carbon tax on the Chilean economy: A computable general equilibrium analysis. Energy economics, 57, 106-127.
Bloomberg (2019). Canadian Inflation Picks Up to 2% on Trudeau’s Carbon Levies.
https://www.bloomberg.com/news/articles/2019-05-15/canadian-inflation-picks-up-to-2-on-trudeau-s-carbon-levies.
Bölük, G., & Mert, M. (2015). The renewable energy, growth and environmental Kuznets curve in Turkey: An ARDL approach. Renewable and Sustainable Energy Reviews, 52, 587-595
British Petroleum (BP, 2018). BP Statistical Review of World Energy. https://www.bp.com/en/global/corporate/energy-economics/statistical-review-of-world-energy/downloads.html. (Accessed 20 March 2019).
20
Davidson, E. A., Suddick, E. C., Rice, C. W., & Prokopy, L. S. (2015). More food, low pollution (Mo Fo Lo Po): a grand challenge for the 21st century. Journal of environmental quality, 44(2), 305-311.
Destek, M. A., & Sarkodie, S. A. (2019). Investigation of environmental Kuznets curve for ecological footprint: the role of energy and financial development. Science of the Total Environment, 650, 2483-2489.
Dejuán, Ó., Lenzen, M., & Cadarso, M. Á. (Eds.). (2017). Environmental and economic
impacts of decarbonization: Input-output studies on the consequences of the 2015 Paris Agreements. Routledge.
Dumitrescu, E. I., & Hurlin, C. (2012). Testing for Granger non-causality in heterogeneous panels. Economic Modelling, 29(4), 1450-1460.
Ekins, P. (1994). The impact of carbon taxation on the UK economy. Energy policy, 22(7), 571-579.
Fernández, F. G., Terry, R. E., & Coronel, E. G. (2015). Nitrous oxide emissions from anhydrous ammonia, urea, and polymer-coated urea in Illinois cornfields. Journal of environmental quality, 44(2), 415-422.
Galli, A., Iha, K., Halle, M., El Bilali, H., Grunewald, N., Eaton, D., & Bottalico, F. (2017). Mediterranean countries' food consumption and sourcing patterns: An Ecological Footprint viewpoint. Science of the Total Environment, 578, 383-391.
Grossman, G. M., & Krueger, A. B. (1995). Economic growth and the environment. The quarterly journal of economics, 110(2), 353-377.
Hanif, I. (2018). Impact of economic growth, nonrenewable and renewable energy consumption, and urbanization on carbon emissions in Sub-Saharan Africa. Environmental Science and Pollution Research, 25(15), 15057-15067.
21
Im, K. S., Pesaran, M. H., & Shin, Y. (2003). Testing for unit roots in heterogeneous panels. Journal of econometrics, 115(1), 53-74.
Intergovernmental Panel on Climate Change (IPCC, 2014). http://www.ipcc.ch/report/ar5/syr/. (Accessed 19 March 2019).
International Renewable Energy Agency (IRENA, 2018). Renewable Capacity Statistics 2018. http://www.irena.org/. (Accessed 19 March 2019).
Jarecki, M. K., Hatfield, J. L., & Barbour, W. (2015). Modeled nitrous oxide emissions from corn fields in Iowa based on county level data. Journal of environmental quality, 44(2), 431-441.
Jebli, M. B., & Youssef, S. B. (2015). The environmental Kuznets curve, economic growth, renewable and non-renewable energy, and trade in Tunisia. Renewable and Sustainable Energy Reviews, 47, 173-185.
Levin, A., Lin, C. F., & Chu, C. S. J. (2002). Unit root tests in panel data: asymptotic and finite-sample properties. Journal of econometrics, 108(1), 1-24.
Lutz, S. R., Mallucci, S., Diamantini, E., Majone, B., Bellin, A., & Merz, R. (2016). Hydroclimatic and water quality trends across three Mediterranean river basins. Science of the Total Environment, 571, 1392-1406
Marignani, M., Bruschi, D., Garcia, D. A., Frondoni, R., Carli, E., Pinna, M. S., ... & Queller, E. M. (2017). Identification and prioritization of areas with high environmental risk in Mediterranean coastal areas: A flexible approach. Science of the Total Environment, 590, 566-578.
Nguyen, K. H., & Kakinaka, M. (2019). Renewable energy consumption, carbon emissions, and development stages: Some evidence from panel cointegration analysis. Renewable Energy, 132, 1049-1057.
22
Norse, D., & Ju, X. (2015). Environmental costs of China’s food security. Agriculture, Ecosystems & Environment, 209, 5-14.
Pata, U. K. (2018). Renewable energy consumption, urbanization, financial development, income and CO2 emissions in Turkey: testing EKC hypothesis with structural breaks. Journal of Cleaner Production, 187, 770-779.
Pesaran, M. H., Shin, Y., & Smith, R. P. (PSS, 1999). Pooled mean group estimation of dynamic heterogeneous panels. Journal of the American Statistical Association, 94(446), 621-634.
Saint Akadiri, S., Alola, A. A., Akadiri, A. C., & Alola, U. V. (2019). Renewable energy consumption in EU-28 countries: policy toward pollution mitigation and economic sustainability. Energy Policy, 132, 803-810.
Segurado, P., Almeida, C., Neves, R., Ferreira, M. T., & Branco, P. (2018). Understanding multiple stressors in a Mediterranean basin: Combined effects of land use, water scarcity and nutrient enrichment. Science of the total environment, 624, 1221-1233. Serpa, D., Nunes, J. P., Keizer, J. J., & Abrantes, N. (2017). Impacts of climate and land use
changes on the water quality of a small Mediterranean catchment with intensive viticulture. Environmental pollution, 224, 454-465.
Snyder, C. S., Bruulsema, T. W., Jensen, T. L., & Fixen, P. E. (2009). Review of greenhouse gas emissions from crop production systems and fertilizer management effects. Agriculture, Ecosystems & Environment, 133(3-4), 247-266.
Tanrivermis, H. (2003). Agricultural land use change and sustainable use of land resources in the Mediterranean region of Turkey. Journal of Arid Environments, 54(3), 553-564. United Nations Environment Program (UNEP, 2018). Global trends in renewable energy
investment 2018. https://fs-unep-centre.org/publications/global-trends-renewable-energy-investment-report-2018. (Accessed 20 March 2019).
23
Uzuner, G., & Adewale, A. A. (2019). Does asymmetric nexus exist between agricultural land and the housing market? Evidence from non-linear ARDL approach. Environmental Science and Pollution Research, 1-11.
Velthof, G. L., Kuikman, P. J., & Oenema, O. (2003). Nitrous oxide emission from animal manures applied to soil under controlled conditions. Biology and Fertility of Soils, 37(4), 221-230.
World Bank Indicator (2018). https://data.worldbank.org/indicator (Accessed 19 March 2019). Zalidis, G., Stamatiadis, S., Takavakoglou, V., Eskridge, K., & Misopolinos, N. (2002). Impacts of agricultural practices on soil and water quality in the Mediterranean region and proposed assessment methodology. Agriculture, Ecosystems & Environment, 88(2), 137-146.
Zhang, Y. J. (2011). The impact of financial development on carbon emissions: An empirical analysis in China. Energy Policy, 39(4), 2197-2203.
24
Table 1: Panel unit root test_____________________________________________________________________________________
LLC IPS Fisher-ADF Variable c t c t c t _____ ren 3.303 -2.286 4.696 3.840 11.446 10.962 fpr -0.626 -5.965* 0.078 -4.825* 41.954 80.142* inf -9.726* -6.681* -9.937* -8.532* 158.621* 124.36* CO2 -0.770* 0.642* 2.283 2.735 20.425 26.408 energy 0.589 1.951 2.675 4.014 17.075 16.123 Δren -6.499* -8.817* -5.943* -7.013* 98.716* 106.836* Δfpr -18.551* -15.827* -18.470* -16.120* 289.414* 216.669* Δinf -17.334* -14.069* -16.640* -12.603* 297.363* 155.158* ΔCO2 -13.709* -15.158* -11.953* -13.636* 188.777* 184.138* Δenergy -2.736* -3.124* -5.277* -6.261* 90.446* 96.365* ____________________________________________________________________________________________________________
Cross-sectional dependence test Correlation Matrix
Breusch-Pagan LM Pesaran CD ren fpr inf co2
ren 990.734* 0.481 ren 1.00
fpr 1057.574* 1.215 fpr -0.10 1.00
inf 343.038* 10.514* inf -0.02 -0.12 1.00
CO2 948.652* 14.641* co2 -0.18* 0.11** -0.08 1.00
Cross-section dependence (correlation) in residuals
Pesaran CD: statistic (p-value) = -0.1068(0.916) Number of observation = 318
____________________________________________________________________________________________________________
Note: * and ** are statistical significance at 1% and 5% respectively. Δ, t, and c indicates the first difference, the time trend and the intercept. Lag selection by SIC of maximum of 4 in all estimations. LLC, IPS and Fisher-ADF are the Levin, Lin and Chu (2002); Im, Pesaran and Shin (2003); Fisher-ADF by Maddala & Wu (1999) panel unit root tests. For the Cross-sectional dependence test, ( ) is the p-value. Also, ren, fpr, inf, and CO2 are respectively the renewable energy
25
Table 2: Pooled Mean Group Test with Dynamic ARDL (3, 3, 3, 3) specifications __________________________________________
Long-run ren logfpr inf Adjustment parameter
-0.00064* 0.592* -0.00000129* -0.0127** Short-run of cross-sections 1 -0.000134* -0.293* 1.46E-06* -0.29* 2 -0.000372* -0.137* 6.63E-07* -0.76* 3 -0.000210* -0.267* -1.23E-06* -0.11* 4 -0.000147* -0.018* 3.03E-07* -0.10* 5 -0.000122* 0.298* 1.29E-06* -0.14* 6 -0.000687* 2.167* 3.68E-06* -0.61* 7 -6.44E-05* -0.301* -1.55E-08* -0.37* 8 -5.31E-05* 0.092* -3.88E-07* -0.31* 9 -0.000368* -0.590* -1.62E-07* -0.06** 10 -0.000315* 0.302* -1.86E-07* -0.19* 11 -3.23E-05* 0.092* 1.33E-06* -0.14* 12 -0.000916* -0.116* -1.56E-07* -0.27* 13 -7.10E-05* -0.160* -2.00E-07* -0.17* 14 -0.000101* 0.750* -6.98E-07* -0.09* 15 -0.000490* -0.599* -1.41E-06* -0.32* 16 -0.000379* 0.124* 1.57E-06* -0.006 ____________________________________________________________________________________________________________Note:
Akaike Information Criteria (AIC) with lag length of 3. * and ** are the statistical significant values at 1% and 5% respectively. The investigated countries are arranged in the order of 1=Spain, 2=France, 3=Italy, 4=Slovenia, 5=Bosnia and Herzegovina, 6=Albania, 7=Greece, 8=Turkey, 9=Lebanon, 10=Israel, 11=Morocco, 12=Algeria, 13=Tunisia, 14=Egypt, 15=Malta, 16=Cyprus. Also, ren, fpr, inf, and CO2 are respectively the renewable energy consumption, food
26
Table 3: Panel Granger causality results by Dumitrescu and Hurlin (2012)____________ Null hypothesis w-stat ̅-stat P-value Direction of causality
ren → co2 5.936 5.031 5.E-07* co2 → ren 5.082 3.828 0.0001* Bi-directional fpr → co2 3.762 1.969 0.049** co2 → fpr 3.875 2.129 0.033** Bi-directional inf → co2 2.234 -0.187 0.851 co2 → inf 4.335 2.757 0.006* Uni-directional __________________________________________________________________
27
Appendix
Table A: Summary statistics of the variables__________________________________________
CO2 ren fpr inf ______________________________________________________________________________ Mean 117069 11.7740 97.905 4.055 Median 56455.30 9.0880 98.070 3.021 Maximum 473970.8 55.9534 165.020 41.276 Std. Deviation 137347.9 9.8745 15.003 -17.06 Skewness 1.144644 1.7485 0.464 2.429 Kurtosis 2.951369 6.7661 5.383 15.362 Observations 320 320 320 318 ______________________________________________________________________________
Note: The ren, fpr, inf, and CO2 are respectively the renewable energy consumption, food production, inflation, and carbon dioxide (proxy for carbon
emissions).
Table B: Robustness PMG Dynamic ARDL (2, 2, 2, 2) specifications _______________________
Long-run with logCO2 as dependent variable
logenergy logfsecurity inf Adjustment parameter
1.472* 0.013 -0.005** -0.313*
______________________________________________________________________________
Note: The energy, fsecurity, inf, and CO2 are respectively the renewable energy consumption, food production, inflation, and carbon dioxide (proxy for carbon
28
Figure 1: A graphical illustration of the relationship between average CO2 emissions (avgCO2) and the average renewable energy consumption
(avgrenergy) for the panel of CMCs.
Spain Spain Spain Spain Spain Spain Spain Spain Spain Spain Spain Spain Spain Spain Spain Spain Spain Spain Spain Spain France France France France France France France France France France France France France France France France France France France France Italy Italy Italy Italy Italy Italy Italy Italy Italy Italy Italy Italy Italy Italy Italy Italy Italy Italy Italy Italy Slovenia Slovenia Slovenia Slovenia Slovenia Slovenia Slovenia Slovenia Slovenia Slovenia Slovenia Slovenia Slovenia Slovenia Slovenia Slovenia Slovenia Slovenia Slovenia
Slovenia Bosnia and HerzegovinaBosnia and HerzegovinaBosnia and HerzegovinaBosnia and HerzegovinaBosnia and HerzegovinaBosnia and HerzegovinaBosnia and HerzegovinaBosnia and HerzegovinaBosnia and HerzegovinaBosnia and HerzegovinaBosnia and HerzegovinaBosnia and HerzegovinaBosnia and HerzegovinaBosnia and HerzegovinaBosnia and HerzegovinaBosnia and HerzegovinaBosnia and HerzegovinaBosnia and HerzegovinaBosnia and HerzegovinaBosnia and Herzegovina
Albania Albania Albania Albania Albania Albania Albania Albania Albania Albania Albania Albania Albania Albania Albania Albania Albania Albania Albania Albania Greece Greece Greece Greece Greece Greece Greece Greece Greece Greece Greece Greece Greece Greece Greece Greece Greece Greece Greece Greece Turkey Turkey Turkey Turkey Turkey Turkey Turkey Turkey Turkey Turkey Turkey Turkey Turkey Turkey Turkey Turkey Turkey Turkey Turkey Turkey Lebanon Lebanon Lebanon Lebanon Lebanon Lebanon Lebanon Lebanon Lebanon Lebanon Lebanon Lebanon Lebanon Lebanon Lebanon Lebanon Lebanon Lebanon Lebanon Lebanon Israel Israel Israel Israel Israel Israel Israel Israel Israel Israel Israel Israel Israel Israel Israel Israel Israel Israel Israel Israel Morocco Morocco Morocco Morocco Morocco Morocco Morocco Morocco Morocco Morocco Morocco Morocco Morocco Morocco Morocco Morocco Morocco Morocco Morocco Morocco Algeria Algeria Algeria Algeria Algeria Algeria Algeria Algeria Algeria Algeria Algeria Algeria Algeria Algeria Algeria Algeria Algeria Algeria Algeria Algeria Tunisia Tunisia Tunisia Tunisia Tunisia Tunisia Tunisia Tunisia Tunisia Tunisia Tunisia Tunisia Tunisia Tunisia Tunisia Tunisia Tunisia Tunisia Tunisia Tunisia Egypt Egypt Egypt Egypt Egypt Egypt Egypt Egypt Egypt Egypt Egypt Egypt Egypt Egypt Egypt Egypt Egypt Egypt Egypt Egypt Malta Malta Malta Malta Malta Malta Malta Malta Malta Malta Malta Malta Malta Malta Malta Malta Malta Malta Malta
Malta CyprusCyprusCyprusCyprusCyprusCyprusCyprusCyprusCyprusCyprusCyprusCyprusCyprusCyprusCyprusCyprusCyprusCyprusCyprusCyprus
0
1
0
0
0
0
0
2
0
0
0
0
0
3
0
0
0
0
0
4
0
0
0
0
0
a
v
g
c
o
2
0
10
20
30
40
avgrenergy
n = 320 RMSE = 133702.529
Figure 2: A graphical illustration of the relationship between average CO2 emissions (avgCO2) and the average food production (avgfoodproduction)
for the panel of CMCs.
Spain Spain Spain Spain Spain Spain Spain Spain Spain Spain Spain Spain Spain Spain Spain Spain Spain Spain Spain Spain France France France France France France France France France France France France France France France France France France France France Italy Italy Italy Italy Italy Italy Italy Italy Italy Italy Italy Italy Italy Italy Italy Italy Italy Italy Italy Italy Slovenia Slovenia Slovenia Slovenia Slovenia Slovenia Slovenia Slovenia Slovenia Slovenia Slovenia Slovenia Slovenia Slovenia Slovenia Slovenia Slovenia Slovenia Slovenia Slovenia Bosnia and Herzegovina
Bosnia and Herzegovina Bosnia and Herzegovina Bosnia and Herzegovina Bosnia and Herzegovina Bosnia and Herzegovina Bosnia and Herzegovina Bosnia and Herzegovina Bosnia and Herzegovina Bosnia and Herzegovina Bosnia and Herzegovina Bosnia and Herzegovina Bosnia and Herzegovina Bosnia and Herzegovina Bosnia and Herzegovina Bosnia and Herzegovina Bosnia and Herzegovina Bosnia and Herzegovina Bosnia and Herzegovina Bosnia and Herzegovina
Albania Albania Albania Albania Albania Albania Albania Albania Albania Albania Albania Albania Albania Albania Albania Albania Albania Albania Albania Albania Greece Greece Greece Greece Greece Greece Greece Greece Greece Greece Greece Greece Greece Greece Greece Greece Greece Greece Greece Greece Turkey Turkey Turkey Turkey Turkey Turkey Turkey Turkey Turkey Turkey Turkey Turkey Turkey Turkey Turkey Turkey Turkey Turkey Turkey Turkey Lebanon Lebanon Lebanon Lebanon Lebanon Lebanon Lebanon Lebanon Lebanon Lebanon Lebanon Lebanon Lebanon Lebanon Lebanon Lebanon Lebanon Lebanon Lebanon Lebanon Israel Israel Israel Israel Israel Israel Israel Israel Israel Israel Israel Israel Israel Israel Israel Israel Israel Israel Israel Israel Morocco Morocco Morocco Morocco Morocco Morocco Morocco Morocco Morocco Morocco Morocco Morocco Morocco Morocco Morocco Morocco Morocco Morocco Morocco Morocco Algeria Algeria Algeria Algeria Algeria Algeria Algeria Algeria Algeria Algeria Algeria Algeria Algeria Algeria Algeria Algeria Algeria Algeria Algeria Algeria Tunisia Tunisia Tunisia Tunisia Tunisia Tunisia Tunisia Tunisia Tunisia Tunisia Tunisia Tunisia Tunisia Tunisia Tunisia Tunisia Tunisia Tunisia Tunisia Tunisia Egypt Egypt Egypt Egypt Egypt Egypt Egypt Egypt Egypt Egypt Egypt Egypt Egypt Egypt Egypt Egypt Egypt Egypt Egypt Egypt Malta Malta Malta Malta Malta Malta Malta Malta Malta Malta Malta Malta Malta Malta Malta Malta Malta Malta Malta Malta Cyprus Cyprus Cyprus Cyprus Cyprus Cyprus Cyprus Cyprus Cyprus Cyprus Cyprus Cyprus Cyprus Cyprus Cyprus Cyprus Cyprus Cyprus Cyprus Cyprus 0 1 0 0 0 0 0 2 0 0 0 0 0 3 0 0 0 0 0 4 0 0 0 0 0 a v g c o 2 90 95 100 105 avgfoodproduction n = 320 RMSE = 132963.4
30
Figure 3: A graphical illustration of the relationship between average CO2 emissions (avgCO2) and the average inflation (avginflation) for the panel of CMCs.
Spain Spain Spain Spain Spain Spain Spain Spain Spain Spain Spain Spain Spain Spain Spain Spain Spain Spain Spain Spain France France France France France France France France France France France France France France France France France France France France Italy Italy Italy Italy Italy Italy Italy Italy Italy Italy Italy Italy Italy Italy Italy Italy Italy Italy Italy Italy Slovenia Slovenia Slovenia Slovenia Slovenia Slovenia Slovenia Slovenia Slovenia Slovenia Slovenia Slovenia Slovenia Slovenia Slovenia Slovenia Slovenia Slovenia Slovenia Slovenia
Bosnia and Herzegovina Bosnia and Herzegovina Bosnia and Herzegovina Bosnia and Herzegovina Bosnia and Herzegovina Bosnia and Herzegovina Bosnia and Herzegovina Bosnia and Herzegovina Bosnia and Herzegovina Bosnia and Herzegovina Bosnia and Herzegovina Bosnia and Herzegovina Bosnia and Herzegovina Bosnia and Herzegovina Bosnia and Herzegovina Bosnia and Herzegovina Bosnia and Herzegovina Bosnia and Herzegovina Bosnia and Herzegovina Bosnia and Herzegovina Albania Albania Albania Albania Albania Albania Albania Albania Albania Albania Albania Albania Albania Albania Albania Albania Albania Albania Albania Albania Greece Greece Greece Greece Greece Greece Greece Greece Greece Greece Greece Greece Greece Greece Greece Greece Greece Greece Greece Greece Turkey Turkey Turkey Turkey Turkey Turkey Turkey Turkey Turkey Turkey Turkey Turkey Turkey Turkey Turkey Turkey Turkey Turkey Turkey Turkey Lebanon Lebanon Lebanon Lebanon Lebanon Lebanon Lebanon Lebanon Lebanon Lebanon Lebanon Lebanon Lebanon Lebanon Lebanon Lebanon Lebanon Lebanon Lebanon Lebanon Israel Israel Israel Israel Israel Israel Israel Israel Israel Israel Israel Israel Israel Israel Israel Israel Israel Israel Israel Israel Morocco Morocco Morocco Morocco Morocco Morocco Morocco Morocco Morocco Morocco Morocco Morocco Morocco Morocco Morocco Morocco Morocco Morocco Morocco Morocco Algeria Algeria Algeria Algeria Algeria Algeria Algeria Algeria Algeria Algeria Algeria Algeria Algeria Algeria Algeria Algeria Algeria Algeria Algeria Algeria Tunisia Tunisia Tunisia Tunisia Tunisia Tunisia Tunisia Tunisia Tunisia Tunisia Tunisia Tunisia Tunisia Tunisia Tunisia Tunisia Tunisia Tunisia Tunisia Tunisia Egypt Egypt Egypt Egypt Egypt Egypt Egypt Egypt Egypt Egypt Egypt Egypt Egypt Egypt Egypt Egypt Egypt Egypt Egypt Egypt Malta Malta Malta Malta Malta Malta Malta Malta Malta Malta Malta Malta Malta Malta Malta Malta Malta Malta Malta
MaltaCyprusCyprusCyprusCyprusCyprusCyprusCyprusCyprusCyprusCyprusCyprusCyprusCyprusCyprusCyprusCyprusCyprusCyprusCyprusCyprus
0 1 0 0 0 0 0 2 0 0 0 0 0 3 0 0 0 0 0 4 0 0 0 0 0 a v g c o 2 2 4 6 8 10 avginflation n = 320 RMSE = 132661.2