The Good, the Bad, the Well-Connected
Michael Wegener & Evla Mutlu
Abstract—In this paper, we analyse a variation of truel competi-tions in which each prospective player is represented by a node in a scale-free network. Without the inclusion of any particular spatial arrangement of players, traditional game theory suggests that in many truel settings the strongest player often has the lowest probability of survival, a result which has been popularised by the term survival of the unfittest. However, both our single run and the Monte-Carlo simulations suggest that this particular notion does not hold in scale-free networks. The spatial structure and arrangement of players are crucial for the outcome of truels, as in scale-free networks the number of players surviving the competition positively depends on their marksmanship (i.e. the strongest players indeed have the highest probability of survival).
Index Terms—Truels, Evolutionary Game Theory, Scale-Free Networks, Survival of the Fittest
I. INTRODUCTION
Truels, the three player extension of a duel, are well known from the 1966 Italian western ’The Good, the Bad, the Ugly’, in which the three main characters team up to find a bounty of 200.000 USD in buried gold coins. After having successfully tracked down the location of the gold, no one is willing to share the reward, and so the three finally meet in a great showdown, in which each one is eager to shoot his opponents to get his hands on the bounty as the only survivor.
Game theory loosely defines truels in less martial words as a series of one-to-one competitions in which each player aims to either eliminate or overtake his two opponents in the game. The basic mechanics of the game are simple and can be summarised as follows: Once the shooting order is determined, the first player decides which of the other two players will be his target. He then aims a shot at the targeted player, with a certain probability (marksmanship) that the shot will be successful, and the targeted player will be removed from the game. Given the shooting order, a new player is then chosen among the surviving players, who will target one of his opponents for his shot. These steps repeat until only one winning player remains in the game.
Various alterations of these basic rules exist. The shooting order may be fixed or random, players can fire shots simultaneously or sequentially one after another, the number of shots available to each player may be limited, and players may be allowed to misfire into the air on purpose. However, in all variations players are unmistakably rational (i.e. each player will apply a strategy which maximises his own probability of staying alive and winning the game).
Truels differ from other one-to-one competitive games, such as Paper, Rock, Scissors, due to their non-cyclical marksmanships (i.e. no player is superior to one player but inferior to the other competitor in the field). Marksmanships in truels are intrinsic and can be ordered from weakest to strongest and vice versa.
Surprisingly, the player with the poorest marksmanship has the highest probability to win the game in many settings. The latter outcome, being so at odds with the conventional notion of the survival of the fittest, makes truels an interesting subject to study for both game theorists and evolutionary biologists. In the literature, truels were first described as an
entertaining mathematical puzzle byKinnaird (1946) and later
byLarson and Moser(1948) andGardner(1966). In the 1970s, Kilgour was among the first to analyse truels theoretically and to present the mutual best responses and Nash equilibria for
simultaneous (Kilgour,1972) and (infinite) sequential truels
(Kilgour,1975,1978).1 His results show that in many of these
settings there exists a unique equilibrium point at which the optimal winning strategy of a rational player is to fire a shot at the strongest opponent in the field. It is due to this dominant strategy that the two inferior shooters in a truel have a combined interest to eliminate the strongest shooter as soon as possible, which leads to the above-cited paradoxical outcome: in many settings, the strongest player has the lowest probability of survival. Apart from being a puzzling but purely theoretical case, a better understanding of this paradox is also crucial to evolutionary biology because it indicates that competitive skills can only be improved by mutation and not by interactions among more than two individuals in the process of natural selection (Archetti,2012).
More recent analyses of truels include Toral and Amengual
(2005), who use Markov Chain theory to confirm Kilgour’s
previous results, and Xu(2012), who examines the conditions
under which the weakest player should deliberately pass his first shot into the air. More related to our paper, however, is
the framework of Amengual and Toral(2006), in which the
truel players reside on a simple n-dimensional grid. Although adding such a spatial structure reflects the fact that individual players have a higher propensity to interact with those players in close vicinity, in most real-world networks, the number of connections one particular node has can vary greatly. Hence, we
believe that small-world networks (Watts and Strogatz,1998)
or scale-free networks (Barab´asi and Albert,1999) are a more
natural and realistic fit to study the evolutionary interaction of truel players.
Accordingly, the remainder of this paper is organised as follows.
SectionIIreconsiders the basic features of scale-free networks,
in which each node represents one player in a truel and outlines the evolutionary competition in a single simulation run. Section
III then further explores the population of surviving truel
players in a so-called Monte-Carlo study for a broader range of simulation runs with different initial starting conditions. The last section concludes the paper.
WORKING PAPER 2
II. TRUELS INSCALE-FREENETWORKS: A NUMERICAL
EXAMPLE
Many interactions in complex biological (Almaas et al.,2013,
Barab´asi and Oltvai,2004) or social (Albert et al.,1999,Ebel et al., 2002, Wang and Chen, 2003) systems take place in so-called scale-free networks. Scale-free networks have a very uneven distribution of connections according to a power law: few nodes have many connections, while the majority of nodes exhibit few connections. Due to this property it is obvious that the behaviour of scale-free networks in terms of diffusion and interaction between nodes is fundamentally different from that of other more simple networks, such as grids or random networks, and hence scale-free networks are a better and more natural fit for studying the evolutionary interaction of truel players in a numerical simulation.
Accordingly, we start our simulation by creating an undirected scale-free network along the lines of the preferential-attachment
algorithm proposed byBarab´asi and Albert(1999), which can
briefly be described as follows:
1) Create an initial network with 2 connected nodes. 2) Create a new node m and randomly select one existing
node i.
3) Connect m to i with probability p = ki
ktot, where ki is
the number of connections to node i and ktot is twice
the number of existing connections in the entire network. 4) Repeat steps 2 and 3 until the network contains N
connected nodes.
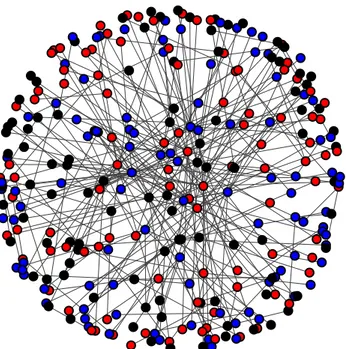
Fig. 1: A scale-free network with N = 300 nodes. Each node represents one potential player with marksmanship a = 1 (red), b = 0.8 (blue), c = 0.5 (black). Connections among nodes are undirected.
Please note that due to the probability of preferential attachment in step 3, each new node is more likely to connect to a more connected node in the existing network than to those
nodes only having a few connections. Fig. 1depicts a
scale-free network for N = 300 nodes created with the above-described algorithm. Each node in the network represents one possible player in our simulation, the colour denoting the player’s respective type, which can take on one of the three possible values of marksmanship: a = 1 (red nodes), b = 0.8 (blue nodes) or c = 0.5 (black nodes). Marksmanships are randomly distributed in the network with equal initial
proportions xA= xB = xC = 13. In our simulation, players
obey the standard rules of a sequential truel, as outlined by
Amengual and Toral(2006). That is, at each step in the game, one node is chosen randomly. This chosen player, in turn, randomly selects two opponents among his neighbour nodes, and the three players play a sequential truel with a fixed shooting order. If the chosen player has only one neighbour node, a duel is played. Players are assumed to be rational (i.e. they strictly follow the strongest opponent strategy but never aim at a player of the same type). Finally, the losers of either a truel or a duel are removed from the network, and if a node has no neighbours it will be reattached to the network along the lines of the preferential-attachment algorithm.
Fig. 2 illustrates the further evolution of the simulation
run. At each step, the number of nodes decreases, and the simulation stops after 634 iteration steps, with 44 red players, 12 blue players and 11 black players surviving the evolutionary competition. Interestingly, and at odds with the previously cited literature on truels, the players with the highest marksmanship have the highest likelihood of surviving: 44 out of the initial red players with marksmanship a = 1 survive while only 23 of the initial 200 weaker blue and black players are still alive at the end of the simulation run. At first glance, this result may be puzzling, but it can be explained by the structural nature of scale-free networks. Recall that in scale-free networks the distribution of connections follows a power law (i.e. many players are connected to only one or two other players while only a few highly connected players have many neighbours). For any randomly selected player, the chances of having only one neighbour are thus much higher than having two or more neighbours. Accordingly, in scale-free networks the number of duels played will exceed the number of truels. In duels, however, the player with the highest marksmanship is more likely to win. The spatial arrangement and connectedness of players do indeed matter in the sense that the evolutionary mechanism leading to the survival of the fittest does, in fact, hold for truel competitions played in scale-free networks.
III. TRUELS INSCALE-FREENETWORKS: A
MONTE-CARLOSIMULATION
Monte-Carlo simulations are a popular numerical technique for assessing the probabilities of outcomes in systems that cannot be predicted easily due to their stochastic nature or high dependency on initial conditions. Rather than relying on the results of a single simulation run, the central idea of a Monte-Carlo experiment is to simulate many different scenarios
(a) Network structure after 100 iteration steps. (b) Network structure after 634 iteration steps.
Fig. 2: Evolution of the network in the course of the simulation. The simulation stops after 634 iteration steps, with 45 red players (marksmanship a = 1), 12 blue players (marksmanship b = 0.8) and 11 black players (marksmanship c = 0.5) surviving the competition.
with slightly different initial starting conditions hundreds or thousands of times. Each scenario generates a set of hundreds or thousands of samples, and for each set, the average outcome will be recorded and visualised to get a comprehensive idea of the underlying probability distribution of all possible outcomes. Hence, Monte-Carlo experiments can tell us not only which outcomes can happen in our truel competitions but also how likely they are to occur. Our Monte-Carlo analysis aims to answer the following simple question: how robust are the results we obtained in the previous section against changes in the initial network structure? For this purpose, we will create 1000 independent samples by repeating the single-run simulation presented in the last section 1000 times. In each repeated sample, we will keep the initial proportion of players constant but change the initial network structure and, hence, the relationships among players in the scale-free network. Once the competition has come to an end in each repeated run, we will record the number of surviving red, blue and black players, with the compiled data summarised by the box and whisker
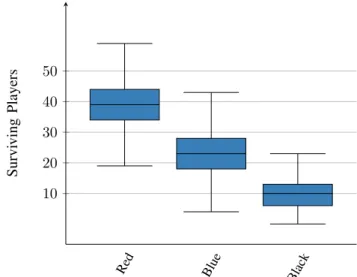
plots presented in Fig.3. Comparing these plots, it becomes
evident that there is a striking difference among the surviving players in each group. On average, more strong players with the highest marksmanship a = 1 survive the competition than weaker players with lower marksmanships b = 0.8 and c = 0.5. Please note that the spreads of the boxes do not overlap, which in combination with the relatively large sample size of 1000 repetitions indicates that this difference is likely to be highly statistically significant, a fact which is further supported by the quite narrow, non-overlapping confidence intervals for the
Red Blue Black 10 20 30 40 50 Survi ving Players
Fig. 3: Box and whisker plots summarising the sample data generated in a Monte-Carlo experiment with 1000 repeated simulations. In each repetition, we keep the initial proportion of red, blue and black players constant but change the initial structure of the network. The plots show that there is a striking difference among the numbers of players in each group surviving the competition.
means. With 99% confidence, the mean number of surviving red players lies between 38.61 and 39.81, the mean number of surviving blue players lies between 22.35 and 23.49 and
WORKING PAPER 4 0 17 33 50 67 83 100 0 17 33 50 67 83 100 0 17 33 50 67 83 100 red players blue players black players 0 100 200 300
(a) Red players with marksmanship a = 1
0 17 33 50 67 83 100 0 17 33 50 67 83 100 0 17 33 50 67 83 100 red players blue players black players 0 100 200 300
(b) Blue players with marksmanship b = 0.8
0 17 33 50 67 83 100 0 17 33 50 67 83 100 0 17 33 50 67 83 100 red players blue players black players 0 100 200 300
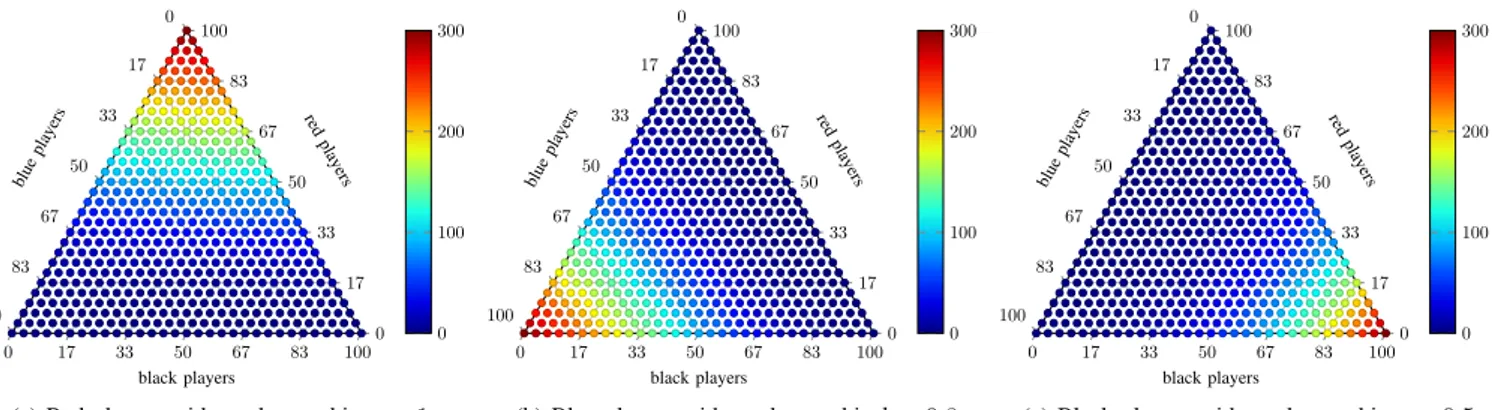
(c) Black players with marksmanship c = 0.5 Fig. 4: Ternary heat maps illustrating the average number of surviving players for different initial proportions of marksmanships. Each average is calculated for a sample of 10 simulations. The average number of surviving red players (a), blue players (b) and black players (c).
the mean number of surviving black players lies between 9.58 and 10.41, respectively.
Fig. 4summarises how the initial proportions of
marksman-ships affect the final population of surviving players. Again, the average numbers were calculated from a Monte-Carlo simulation run with 10 repetitions. The figure shows that ceteris paribus, the average number of red players surviving the truel competition is highest compared to the same initial proportion of the weaker blue or black players. For instance,
in a simulation run with an initial proportion of xA= 0.67 red
and xB+ xC = 0.33 blue and black players, about 160 red
players with marksmanship a = 1 will survive the competition. In contrast, if we start the simulation with an initial proportion
of xC = 0.67 black players and xA+ xC = 0.33 red and blue
players, on average only about 100 black players will survive. Overall, these numbers corroborate our previous result showing that the traditional notion of the survival of the fittest indeed holds and that in a scale-free network the strongest players have a higher probability of surviving truel competitions.
IV. CONCLUSIONS
In this paper, we analysed, how the spatial arrangement of players in scale-free networks affects the final population of surviving players. Without the inclusion of any particular spatial arrangement, traditional game-theoretic analysis concludes that in many truel settings the strongest player most often has the lowest probability of survival, a paradox which has been disseminated through the popular notion of the survival of the unfittest. However, both our single-run and Monte-Carlo simulations suggest that this notion does not hold if the potential players are arranged in scale-free networks, as, on average, the surviving stronger players outnumber the weaker players in many settings. This result may be explained by the characteristic structure of scale-free networks, in which the distribution of connections follows a power law. As many nodes have few neighbours and truel players randomly select their potential opponents from their immediate neighbourhood, the number of duels played may exceed the number of truels in a scale-free network. In duels, however, stronger players are
more likely to win and survive the competition.
Possible interesting extensions of our analysis include more complex and dynamic algorithms to create scale-free networks in which players either tend to cluster in marksmanship
communities based on similarity (Mele, 2018) or prefer to
connect to the immediate neighbours of a parent node (Jackson
and Rogers,2007). However, we will leave these extensions for further research.
REFERENCES
Albert, R., H. Jeong, and A.-L. Barab´asi (1999, September). Internet: Diameter of the world-wide web. Nature 401(6749), 130–131.
Almaas, E., A. Vazquez, and A.-L. Barabasi (2013, 01). Scale-free networks in biology. Biological Networks 3.
Amengual, P. and R. Toral (2006). Truels, or survival of the weakest. Computing in Science Engineering 8(5), 88–95. Archetti, M. (2012). Survival of the weakest in n-person duels
and the maintenance of variation under constant selection. Evolution 66(3), 637–650.
Barab´asi, A.-L. and R. Albert (1999). Emergence of scaling in random networks. Science 286(5439), 509–512.
Barab´asi, A.-L. and Z. N. Oltvai (2004, February). Network biology: understanding the cell’s functional organization. Nature Reviews Genetics 5(2), 101–113.
Ebel, H., L.-I. Mielsch, and S. Bornholdt (2002, 10). Scale-free topology of e-mail networks. Physical Review E 66, 035103. Gardner, M. (1966). New Mathematical Puzzles and Diversions.
London.
Jackson, M. O. and B. W. Rogers (2007). Meeting strangers and friends of friends: How random are social networks? The American Economic Review 97(3), 890–915.
Kilgour, D. M. (1972). The simultaneous truel. International Journal of Game Theory 1(4), 229–242.
Kilgour, D. M. (1975). The sequential truel. International Journal of Game Theory 4(3), 151–171.
Kilgour, D. M. (1978). Equilibrium points of infinite sequential truels. International Journal of Game Theory 6(3), 167–180.
Kilgour, D. M. and S. J. Brams (1997). The truel. Mathematics Magazine 70(5), 315–326.
Kinnaird, C. (1946). Encyclopedia of Puzzles and Pastimes. Secaucus: Citadel.
Larson, H. D. and L. Moser (1948). A dart game. American Mathematical Monthly 55(10), 640–641.
Mele, A. (2018). A structural model of homophily and
clustering in social networks. Conference on Network Science in Economics.
Toral, R. and P. Amengual (2005). Distribution of winners in truel games. Proceedings of the 8th Granada Seminar on Computational Physics 779(128).
Wang, X. F. and G. Chen (2003). Complex networks: small-world, scale-free and beyond. IEEE Circuits and Systems Magazine 3(1), 6–20.
Watts, D. J. and S. H. Strogatz (1998). Collective dynamics of ‘small-world’ networks. Nature 393, 440–442.