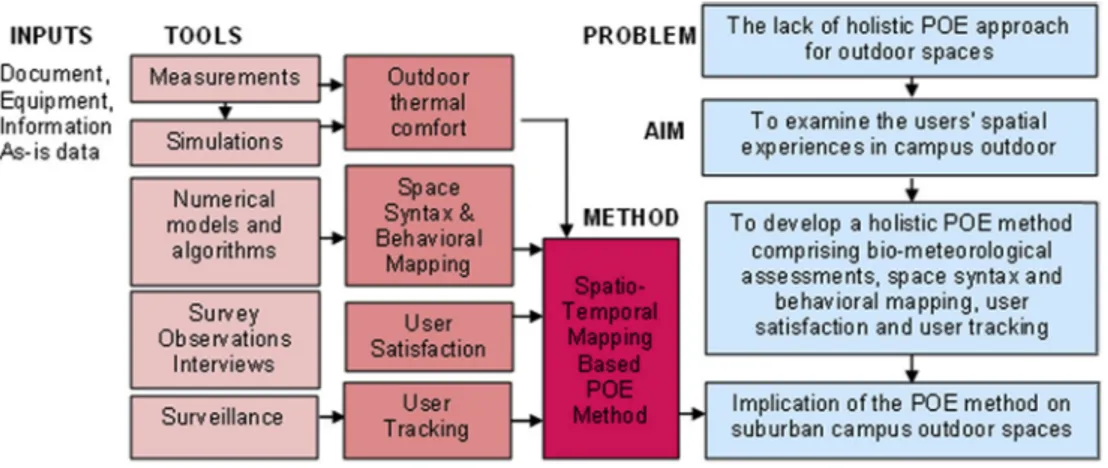
Introduction of a spatio-temporal mapping based POE method for outdoor spaces: Suburban university campus as a case study
Tam metin
Şekil

Benzer Belgeler
Bizim çalışmamızda; yatay eksende; tümör büyüklüğü ortalama 5.6±0.5 mm (2-10 mm), defekt büyüklüğü ortalama 12.3±1.1 mm (11-18 mm) olan olgularda Tenzel flep
Sümer ve arkadaşlarının13 çalışmasında ise tüm yaş gruplarında ilaç zehirlenmesinin en sık olduğu, 7 ay-4 yaş, 5-8 yaş ve 13-17 yaş gruplarında kostik-korozif
“firstly, as I mentioned in the questionnaire, we are doing business plan, in beginning of every semester, we are trying to make best service, we are think about satisfaction
In CL square that is connected by pedestrian path to edge of EMU campus, the exhibition that is identifying backgrounds and history of each country and their
Literatüre katkı sağlamak amacıyla, çalışmada; TÜFE, HTÜFE ve ITÜFE bazlı enflasyona ait modeller oluşturulmuş, yurtiçi kredi hacmine kredi kartı harcamaları dahil
Bu sezon İstanbul Devlet Ti y atro su ’nun repertuvarında Türk tiyatrosu için bu denli önemli karakterin yaşamöykü- sünü konu alan “ Afife Jale” de var?.
1949 yirmi Ekiminde, İstanbul Vali ve Belediye Başkanlığı görevine başladıktan sonra da Cumhuri yet ailesiyle yakın münasebetlerimiz, acı-tatlı hâtıra larla
İnsanın k end inde siyah örtü oluşu, üstünde o- luşundan beterdir.. Kişisel Arşivlerde İstanbul Belleği Taha
