Abstract
In this study, Earthquake catalog of the events within the time period of 1900-2015 prepared by Boğaziçi University Kandilli Observatory and Earthquake Research Institute (KOERI) is analyzed. The catalog consists of earthquakes occurred in Turkey and surrounding area (32O
-45O N/23O
-48OE). The current earthquake catalog data has been checked in two aspects; the time dependent variation and compliance for different regions. Specifically the data set prior to 1976 was found deficient. In total, 7 regions were evaluated according to the tectonic specifications and data set. In this study for every region original data were used without any change; b- values, a- values, Magnitude of completeness (Mc) were calculated. For the calculation of b- values focal depth was selected as h= 0-50 km. One of the important complications for the seismic catalogs is discriminating real (natural) seismic events from artificial (unnatural) seismic events. Therefore within the original current catalog events especially artificial quarry blasts and mine blasts have been separated by declustering and dequarry methods. Declustering process eliminates induced earthquakes especially occurred in thermal regions, large water basins, mine regions from the original catalogs. Current moment tensor catalog prepared by Kalafat, 2015 the faulting type map of the region was prepared. As a result, for each region it is examined if there is a relation between fault type and b- values. In this study, the hypothesis of the relation between previously evaluated and currently ongoing extensional, compression, strike-slip fault regimes in Turkey and b- values are tested one more time.
Keywords: Catalog, explosion, b-value, magnitude
compliteness (Mc).
1. Introduction
There are economy related mine and stone quarries in almost every territory of our country. According to officially released statistics, 228 quarries (coal mines) that were detected as illegal were closed only in 2009.
Accepted Date: 03.04.2016 Corresponding author: Doğan Kalafat, PhD
B.Ü. Kandilli Observatory & Earthquake Research Institute 34684 Çengelköy/İstanbul-TURKEY E-mail: [email protected]
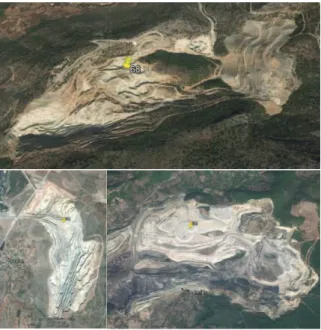
Figure 1a. An example map that indicates only some of the
blast areas in Turkey (The yellow symbols indicate the location of some blasting sources in Turkey).
Statistical Evaluation of Turkish Earthquake Data (1900-2015): A Case study
DOĞAN KALAFAT1,*
Figure 1b. A view of some of the blasting areas
Seismic energy that is generated during these procedures is recorded by seismic stations that are closed to the region and then indicated as data on the earthquake catalogues by assessing these as earthquake by the operators that operate seismic network. The blasts at every region that were selected in terms of assessment of current catalogue were sorted out by using the algorithm developed by WIEMER and BAER (2000). Therefore sorting out of seismic events generated by stone and mine quarry blasts and excavations was done from current catalogue. As known, blasts are mostly used in the field of constructional engineering (tunnel, subway, roadway, dam, etc.).
It is put forth in the last half century’s studies that stress or pore pressure is correlated to magnitude of the earthquakes (SCHORLEMMER et al. 2005; GULIA and WIEMER, 2010). At magnitude-frequency correlation logN=a-b-M defined as Gutenberg-Richter code (GUTENBERG and RICHTER, 1944), N is cumulative earthquake number, M I magnitude and a and b are constants and these describe distribution of earthquake activity and relative magnitude. In the recent years, similar studies have been done (UTSU, 1965; WYSS, 1973; RYDELEK and SACKS, 1989; OGATA and KATSURA, 1993; OKUDA et al. 1993; WIEMER and WYSS, 1997; SCHORLEMMER et al. 2005; GULIA and WIEMER, 2010; TORMANN et al. 2010). Because b-value is a critical parameter for probability of seismic risk assessment and there is a strict in terms of binding b-value with regional faulting model. The studies done from all various data set show that there is a similar correlation between faulting mechanism and b-value and for example b-value (≈1.1) is given for normal faults, for strike-slip faults (≈0.9) and for reverse faults (≈0.7) (SCHORLEMMER et al. 2005).
2. Method
The earthquake catalogue in hand covers data of Turkey and its surrounding. It coordinate range is 32O-45 ON latitudes and 23 O-48 OE longitudes (1900-2015; total data number= 223501; Figure 2).
Figure 2. The current seismicity map produced using the
original catalog data
Due to that the region is so wide and includes various magnitude and depth distributions, it includes the earthquakes especially occurred at sea and border areas out of seismic network of the country and there are irregularities at the increase of data number at the catalogue by years, distribution of earthquake stations and earthquake numbers at enough magnitude and depth range depending on the time not with its current state in terms of algorithms and calculations is not regular; it was paid attention to take on-shore earthquakes in to consideration and exclude the off-shore earthquakes. Especially it was paid attention to that the depth distribution was h=0-50 km at the selected data set as on-shore earthquakes were generally used at b-value calculations.
Since 1971 KOERI (Kandilli Observatory and Earthquake Research Institute) has been involved in measuring the parameters of earthquakes through earthquake station network set to record the emerging earthquakes in and around Turkey and to accurately spot the specific regions affected by the earthquakes. To serve that purpose regional earthquakes were real-time recorded from 1972 till 1996 in the permanent stations located within the region of Western Anatolia (KALAFAT et al. 1998).
In the subsequent periods, as of 2004 in particular, the rapid developments witnessed in digital equipment fueled a corresponding change in the current substructure of KOERI and broadband digital seismic stations have been activated nationwide (KALAFAT et al. 2006, 2007; KALAFAT 2007).
As widely acknowledged, there is no viability to directly measure earthquake-induced seismic energy, hence any earthquake is defined through its magnitude effect. One of the most important parameters in detecting the seismicity of Turkey is identifying its magnitude value. Prior to 2000 specifically availability of 60mm/minute recording speed in the entire analog seismograph systems registered to earthquake network was an impeding factor to access period readings, therefore amplitude and period-dependent magnitude assessments were avoided.
It was a widely-common approach in the pre-2000 seismic researches to use the periods extending from the onset till the end of earthquake records to measure instrumental magnitude. In particular the magnitude of recorded micro-earthquakes was measured through the signal duration independent of signal amplitude. BISZTRICSANY (1958) was the pioneer scholar in assessing magnitude by referring to signal duration. BISZTRICSANY developed duration-magnitude (Md) formula for a number of Europe-based stations. In the ensuing dates SOLOV’EV, 1965, TSUMURA 1976, LEE et
al. 1972, REAL and TENG 1973, HERRMAN, 1980 etc.
employed this magnitude formula likewise. In Turkey the same topic was investigated in Kandilli Observatory by researchers ÜÇER et al. 1977, ALSAN 1978, ÜÇER et al. 1980, SEVIMAY 1983, SEVIMAY and GÜNGÖR 1987, AYHAN 1988, ÖĞÜTÇÜ 1988, KALAFAT 1989, AYHAN and KALAFAT 1989, KALAFAT et al. 1998 to measure the magnitude of earthquakes.
Magnitude assessments conducted by utilizing the duration of earthquake-induced seismic waves on recordings were implemented through seismograms extracted from high-gain and vertical component electro-magnetic signals and have been effectively utilized in a large quantity of micro-earthquake studies since then.
Used data set was compiled by listing the seismogram values for each station and the list provided information on earthquake record duration, distance of the station to the epicenter and utilized reference magnitude values by conducting Least Squares Method (LSM) to measure the coefficients. Since Athens Observatory (ATH) used Wood-Anderson Torsion Seismograph as the reference magnitude for a long time and measured actual Local Magnitude (ML),
Athens Observatory ATH was taken as the reference magnitude. In sum provided duration magnitude (Md) was partially a modified version of local magnitude (ML). In all
the processes it is imperative to fixate station calibrations; thus the discrepancy between local magnitude and duration magnitude is negligible (KALAFAT 2002; KALAFAT et
al. 2010).
In the aftermath of 2000 particularly local magnitude gained popularity in KOERI. As manifested this magnitude type, which was originally created by Charles Richter
(1958) in 1930, can loosely be translated to the conversion of dislocation of amplitudes by adapting to Wood Anderson Seismograph and associating the new form maximum amplitude of data with the analogously-distanced reference earthquakes (UIDAS 1999; SHEARER 1999). This definition has been provided with the formula below; ML = log10A + log10A0(D)
Here D is the distance (km), A is the maximum amplitude (micron) and A0 is the reference earthquake
amplitude in micron type. In this equation log10A0 values
for California was measured by Richter within the range of 600 km distance and extensively these values were referred to as resources in updated ML computations.
For ML computations about the entire Turkey in this
formula, two distinctive functions defined with respect to distance are used to refer to log10A0(D) term in ML formula
(GÜNGÖR 2003).
In the transfers between magnitudes, empirical formulas generated in different periods were used for conversion process that was particularly implemented till 2000 (KALAFAT 2002; KALAFAT et al. 2000, 2006, 2010). In current paper the complete data set was converted to local magnitude to ensure data set integrity. The formula used in this conversion is as provided hereinafter;
ML=(0.9897*Md)+0.0978 (R2=0.8955; Cohesion
coefficient)
In conclusion the complete data set was assessed as local magnitude.
ZMAP software (WIEMER 2001) was used at the application and it was made suitable for the format that constituted an input for the software at which Turkey Earthquake catalogue was first used. Then the country faults were made executable at the program by making a format change in the same way. As a result of these procedures, test-purpose seismicity map was formed (Figure 2).
Figure 3a. Cumulative Distribution of the Earthquakes
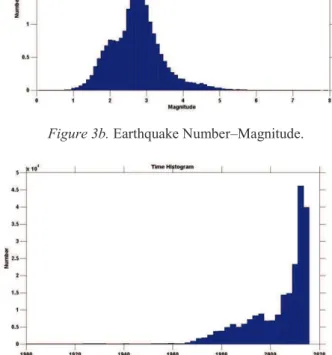
Figure 3b. Earthquake Number–Magnitude.
Figure 3c. Earthquake Number-Time Histograms.
As seen from Figure 3a, magnitudes of earthquakes especially before 1976 and time distribution were disapproved statistically and in terms of method. Therefore, every region was subjected to the assessment within appropriate time period. Various statistical studies have been concluded concerning to earthquake and blast differentiation (WIEMER and WYSS 1994; WIEMER and KATSUMATA 1999).
At the analysis of the data, very important change was observed at earthquake number on the basis of time between the hours of 08-15. This was resulted from blast based stone and mine quarry works in the region. The studies that have been done in this field have been densely continued in the recent years (HEDLIN et al. 1990; KIM et al. 1994; WIEMER and WYSS 1997; WIEMER and BAER 2000; HORASAN et al. 2009). Current earthquake catalogues are especially used by the scientists who are dealing with statistic seismology and this problem is tried to be solved with various algorithms. The most widely used one among these is the algorithm developed by WIEMER and BAER 2000.
Frequency-magnitude correlation carries very big importance in these kinds of studies. Similar studies have been done in this subject (WYSS 1973; OGATA and
KATSURA 1993; WIEMER and WYSS 1997; WIEMMER and KATSUMATA 1999; WIEMER and BAER 2000; WIEMER and WYSS 2000). Generally economy related stone quarry blasting artificially shows high b-value (b>1.5). Because the blasting represents similar and small-scaled events that repeat majority. Distinguishing the blasting is not a simple job. So many seismic network operator deal with defining the blasting especially related to the subject and data analysis that was regularly done along the all-day but this is not completely done. Along with that, in the recent years sorting procedure has been done with numeric data analysis and other spectrum analysis techniques. Although that, detailed analysis has not been still done in so many seismology centers due to earthquake data set analysis at big density within the daytime. Of course, one of the indicators of these events is focal depth of the earthquake. Along with that, focal depth of earthquake may be not be reliable distinguisher for small events. Statistical definition criteria may be mostly useful in this job. It is clearly seen that the blasting is generally done in the daytime and the event number at the histograms increases especially at specific time periods of daytime. The clearest method is to exclude all daytime blasts. Along with that, this approach decreases usable data number approximately at the rate of 50% (WIEMER and BAER 2000). In this method, some daytime tectonic related earthquakes are indispensably excluded from the data set.
Rq defined as daytime/nighttime ratio may define probability blasting locations. The algorithm that is used is based on this basis and therefore daytime events are probably resulted from stone quarry blasting and mine quarries. This Rq value carries the meaning of being high. Therefore stone quarry blasting may be distinguished from the data set that may be also used for micro-earthquake studies.
So many studies have been concluded in this subject. Especially WÜSTER 1993; ZUNIGA and WIEMER 1999; WIEMER and KATSUMATA 1999; WIEMER and BAER 2000 stated that the blasts at stone and some mine quarries were generally done in daytime and some specific times. Sorting these unnatural events from earthquakes constitutes an important problem. Also these events lead to that b-value in the region is high (b>1.5). Because these represent similar and small scaled repetitive events. Defining the blasting is very hard. Seismic network operators may make this procedure during everyday observation and assessment and waveform analysis techniques in this subject help to this. But making this procedure on the earthquakes in big catalogues and on earthquakes belonging to former years has become hard. Focal depth of the earthquake may be a good determinant but especially sorting the small scaled events that especially occur in our country may not be reliable. Generally statistic defining criteria show that blasting occur in daytime (RYDYLEK and SACKS 1982,
1992; WUSTER 1993; WIEMER and BEAR 2000; GULIA 2009; WIEMER and WYSS 2010).
In this method, first upper magnitude threshold of the catalogue is determined, Reasenberg (1985) excluded earthquake after shock series by using this method and defined code earthquake after shock series developed by WIEMER and BAER 2000 (more than 20% of the daytime events within a day) and the catalogue purified from these events clearly sorts out these.
Spatial map of the ratio of daytime to nighttime Rq has been widely used in the recent years as an important algorithm in defining blasting locations. The algorithm shows that Rg is generally high in the blasting regions within specific time intervals during the daytime. This algorithm may be appropriate for sorting out these algorithms. While calculating daytime/night time ratio (D/N ratio), 0.1O
x0.1O
separated cells and closest 100 events are used in every nodes. Also de-clustering procedure was done from the catalogues for earthquakes after shock, triggered earthquakes, earthquake waves, etc. if it was necessary in terms of integrity. Therefore the earthquake clusters in the region may be seen and these may be excluded from the catalogues if seems necessary.
Base of WIEMER and BAER 2000 algorithm is based on that stone quarry blasting is generally done in daytime; ratio of daytime events to nighttime events (Rq) determines blasting activity of the region and ratio in these regions was founded as Rq> 1.5. ın fact, environmental noises affect the earthquake records along the daytime and it is seen that number of these noises decreases. Exact opposite situation is observed in the regions that are rich in terms of stone quarry; in Figure 4 shows distribution histogram of typical hourly events. The distribution histogram in a region that is rich in terms of blasting is seen at Figure 4a and hourly histogram that is obtained after excluding the stone quarry blasting in the same region is seen at Figure 4b (WIEMER and BAER 2000).
Figure 4a. Figure 4b.
Ratio of daytime events to nighttime events was normalized as stated below according to Wiemer and Baer, 2000;
Rq=Nd Ln /(Nn Ld)
Here, Nd refers to number of the events that occur in the daytime and Nm refers to number of the events that occur in the nighttime. Respectively, Ln, Ld are number of the hour within each period (Ln+Ld=24).
Ratio of Ld number of daytime hours to Ln number of nighttime hours (D/N) is calculated by using regular spaced grid.
The software is a part of software package ZMAP of which one part is open source and this ratio is used with frequent grid intervals and sampling and N (N=Nd+Nn) only very closed epicenters at every node on the time dependent map. In other words, N is calculated for different sampling intervals (N=Nd+Nn) and by calculating every Rq (x, y, N) value, it is converted to PRQ (N) (probability of
occurrence PRQ(N)=99%); if the most significant nod passes
99% reliability level, all daytime events are deleted. Of course some daytime tectonic earthquakes are indispensably deleted in this way. The sampling interval NSİZE is an independent parameter and 4 different calculation of the sampling were done for the mapping and applied grid interval NMIN=50, NMAX=400, NSTEP=50. Sampling interval is
significant and it is to be selected by taking the data density in every region into consideration. As a conclusion 3 dimensional data: latitude, longitude and Nsize. Therefore
high and abnormal Rq ratio are defined with appropriate nod. This test is also applied for earthquake series after shock because a big part of main shock and earthquake after the main shock may occur within the daytime when blasts are dense and may seem like these blasts.
Rq density was compared for different example sized (N) but Rq still is not a enough criteria alone. In order to calculate how much abnormality has observed Rq (N) value, it is required to covert the Rq ratio to occurrence possibility by using numerical simulation.
3. Region Applications
1. Region: NW Turkey-Marmara Region
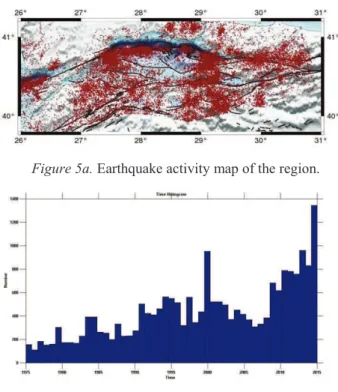
The earthquakes occurred in the region between the years of 1975 and 2015 were assessed within the scope of the study (Figure 5a,b). Number of the earthquakes within the selected period is 26205 and magnitude range=0.2-7.7 and Depth=0-50 km. An accumulative increase especially after 1999 earthquakes is seen at the distribution of the earthquakes by years (Figure 6a,b). This may be clearly seen at accumulative seismic moment diagram.
Figure 5a. Earthquake activity map of the region.
Figure 5b. Distribution of the earthquakes by years.
Figure 6a. Number of earthquake occurrence–time
correlation.
Figure 6b. Released seismic moment-zaman correlation.
Also comparison of 1975-1999 and 1999-2015 was done. Although Mc was approximately 3.0 between the years of 1975 and 1999, sensitivity much more increased between the years of 1999 and 2015. The alteration between 2 terms was observed as approximately 128%. It was observed at the alteration of b-value with magnitude that error bars were high at the earthquakes especially of which magnitude was M=0.2-2.4. It was observed that alteration of b-value within time was very variable between the years of 1999 and 2015 but error limits were very low. Frequency-Magnitude Distribution was detected by using 2 different methods. These were Maximum Likelihood (MLM; WIEMER 2001; WIEMER and SCHORLEMMER 2007) and Entire Magnitude Range (EMR; WOESSNER and WIEMER 2005) and at these methods, data was detected as reliable pursuant to F-M code. Earthquake completeness map shows that Mc was 2.6 at especially Marmara Sea but sensitivity increased as progress to west, north and east (Mc=1.9-2.4). These areas also shows the blasting area (Figure 7a,b).
Figure 7a. F-M relation, b, a, Mc value in the region.
Figure 7b. Magnitude completeness map of the region
(Magnitude of completeness Mc).
The de-clustering procedure was done by using REASENBERG 1975 method. As a result of the de-clustering procedure, 939 clusters were detected and blasts were sorted out from the data obtained after this procedure. Therefore de-quarry catalogue data were formed. The data
information relevant to this is given at Table 1-2 located at the results part. Example histograms that show number of daytime earthquakes from which blasts were not sorted out and blasts were sorted out and from the blast location are given below (Figure 7c,d).
Figure 7c. Figure 7d.
Figure 7c. Number of daytime hourly events in theregion; 7d. Alteration example of number of daytime events at the
quarry locations in the region
2. Region: North Anatolian Fault Zone NAFZ
The earthquakes between 1975 and 2015 in the region were assessed within the scope of the study (Figure 8). Number of the earthquakes in the region was 13029 and Magnitude range=0.5-7.7 and Depth =0-50 km. A regular increase was seen at the distribution of the earthquakes by year even if it was slightly changed after 1999 earthquakes. This may be more clearly seen at released accumulative seismic moment diagram (Figure 9a,b).
Figure 8a. Earthquake activity map of the region.
Figure 8b. Distribution of the earthquakes by years.
Figure 9a. Number of earthquake occurrence–time
correlation;
Figure 9b. Released seismic moment-time correlation.
Also comparison of 1975-1995 and 1995-2015 was done. Although Mc was approximately 2.8 at both of these observed period, sensitivity between the years of 1995 and 2015 was the increase especially at the earthquakes between 1.5 and 3.5. The alteration between two terms was observed as approximately 588.0%. It was observed at the alteration of b-value with magnitude that error bars were high at the earthquakes especially of which magnitude was M=0.5-2.5. It was observed that alteration of b-value within time was very variable between the years of 2000 and 2015 but error limits were very low. Frequency-Magnitude Distribution reliability (according to MLM and EMR) was detected as reliable (Figure 10a). Magnitude of completeness in all regions of earthquake completeness map varies as Mc=2.8-3.2. Mc is decreasing especially eastern part of Marmara Sea, it was seen that Mc generally varied between 2.6 and 3.2 along with NAFZ (Figure 10b).
Figure 10a. F-M relation, b, a, Mc value in the region.
Figure 10b. Magnitude completeness map of the region
(Magnitude of completeness Mc).
As a result of de-clustering procedure, 955 clusters were detected in the region and blasts were sorted out from the data obtained after the procedure. Therefore de-quarry catalogue that was sorted from blasts was formed. The data information relevant to that was given at Table 1-2. Example histograms that show number of daytime earthquakes from which blasts were not sorted out and blasts were sorted out and from the blast location are given below (Figure 11a,b).
Figure 11a. Figure 11b.
Figure 11a. Number of daytime hourly events in the region; 11b. Alteration example of number of daytime events at the
stone quarry locations in the region.
3. Region: Western Turkey
The earthquakes occurred in the region between the years of 1990 and 2015 were assessed within the scope of the study (Figure 12a,b). Number of the earthquakes within
the selected period is 81220 and magnitude range=0.3-6.1 and Depth =0-50 km.
Figure 12a. Earthquake activity map of the region.
Figure 12b. Distribution of the earthquakes by years.
A regular increase is seen at number of the earthquakes by years. This may be clearly seen at accumulative seismic moment diagram. A gradual increase that may be deemed as regular at released cumulative seismic moment was observed (Figure 13a,b).
Figure 13a. Number of earthquake occurrence –time
Figure 13b. Released seismic moment-time correlation.
Comparison of the catalogue between the years of 1990 and 2000 and 2000 and 2015. It was observed that earthquake distribution of both of these two periods was relatively significant increase at the earthquakes of which magnitude was M=2.5-3.3 and the alteration between 2 periods was 1775.4%.
Mc of both periods was detected as Mc=3.2-2.9. It was observed at the alteration of b-value with magnitude that error bars were high at the earthquakes especially of which magnitude was M=0.3-2.6. It was observed that alteration of b-value within time was very variable between the years of 1993 and 2012 but error limits were very variable. Frequency-Magnitude distribution was found reliable pursuant to FM code. b-value=1.34, a value=8.26; Mc=2.7 (Figure 14a). Magnitude completeness map of the region (Magnitude of completeness) was excluded and it was seen that Mc varied between 2.9 and 3.3 and sensitivity increased especially towards southern west and Mc decreased to 2.0-2.7 (Figure 14b). This in turn, illustrates the blasting area (Figure 14b).
Figure 14a. F-M relation, b, a, Mc value in the region.
Figure 14b. Magnitude completeness map of the region
(Magnitude of completeness Mc ).
As a result of de-clustering procedure3472 clusters were detected in the region and blasts were sorted out from the data obtained after the procedure. Therefore de-quarry catalogue that was sorted from blasts was formed. The data information relevant to that was given at Table 1-2. Example histograms that show number of daytime earthquakes from which blasts were not sorted out and blasts were sorted out and from the blast location are given below (Figure 15a,b).
Figure 15a.
Figure 15b.
Figure 15a. Number of daytime hourly events in the region; 15b. Alteration example of number of daytime events at the
4. Region: East Anatolian Fault Zone
The earthquakes occurred in the region between the years of 1992 and 2015 were assessed within the scope of the study. Number of the earthquake within the selected period was 1307 and magnitude range=0.7-6.4 and Depth=0-48 km (Figure 16). An increase was seen at number of the earthquakes in the region especially after 2003. Importance of the earthquake stations established in this region was very big (Figure 16b).
Figure 16a. Earthquake activity map of the region.
Figure 16b. Distribution of the earthquakes by years.
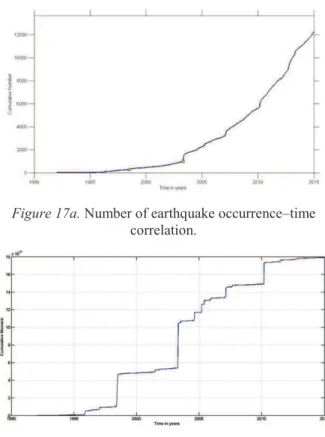
An important increase was seen at number of the earthquakes by years after 2003. A big amount gradual increase at released cumulative seismic moment was observed after the years of 1998 and 2003 (Figure 17a,b).
Figure 17a. Number of earthquake occurrence–time
correlation.
Figure 17b. Released seismic moment-time correlation.
Comparison of the catalogue between the years of 1992 and 2004 and 2004 and 2015. It was observed that completeness of the magnitude for both of these periods Mcomp was decreased to 2.7 from 3.1 and a significant increase was occurred at the earthquakes of which magnitude was M= 1.5-3.3 at the data set that earthquake distribution was relatively appropriate and the alteration between 2 periods was 519.7%.
Mc =2.7 was detected for the region. It was observed at the alteration of b-value with magnitude that error bars were high at the earthquakes especially of which magnitude was M=0.7-2.5. It was observed that alteration of b-value within time was very variable between the years of 2004 and 2013 but error limits were very variable. Also it was seen that b-value has been increased especially in the recent years. It is thought that the events related to economy related quarries in the region leaded to that. Frequency-Magnitude Distribution (FMD) reliability was detected as reliable pursuant to applied methods (ML and EMR Methods) and F-M codes. b-value =0.972, a value =6.47; Mc=2.7 (Figure 18a). Magnitude completeness map of the region (Magnitude of completeness) was excluded and it was seen that Mc varied between 2.7 and 3.3 and sensitivity decreased especially towards southern west and northern east Mc increased to 3.1-3.3 (Figure 18b).
Figure 18a. F-M relation, b, a, Mc value in the region.
Figure 18b. Magnitude completeness map of the region
(Magnitude of completeness Mc).
As a result of de-clustering procedure, 378 clusters were detected in the region and blasts were sorted out from the data obtained after the procedure. Therefore de-quarry catalogue that was sorted from blasts was formed. The data information relevant to that was given at Table 1-2. Example histograms that show number of daytime earthquakes from which blasts were not sorted out and blasts were sorted out and from the blast location are given below (Figure 19).
Figure 19a. Figure 19b.
Figure 19a. Number of daytime hourly events in the region; 19b. Alteration example of number of daytime events at the
stone quarry locations in the region.
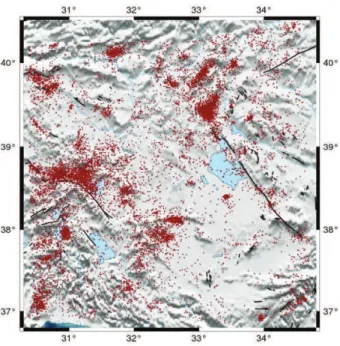
5. Region: Central Turkey
The earthquakes occurred in the region between the years of 1976 and 2015 were assessed within the scope of the study. Number of the earthquake within the selected period was 13212 and magnitude range=0.2-6.1 and Depth=0-49 km (Figure 20a). An increase was seen at number of the earthquakes in the region especially after 2000. Importance of the earthquake stations established in this region was very big (Figure 20b).
Figure 20b. Distribution of the earthquakes by years.
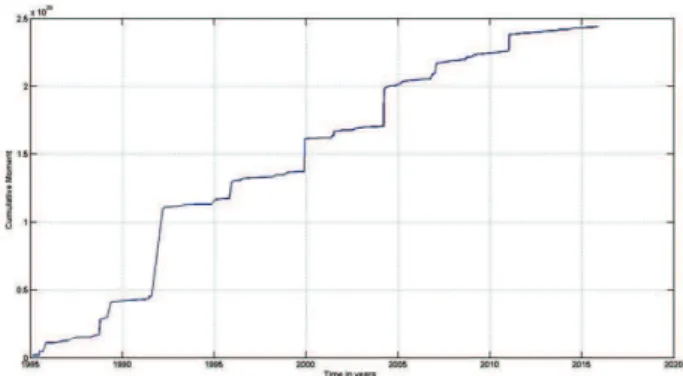
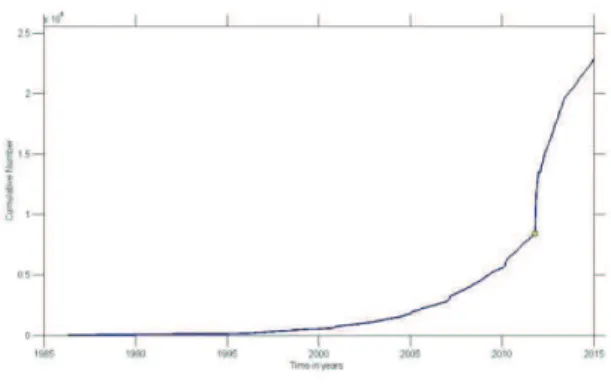
At the distribution of the number of the earthquake occurrence by years; although it was low between the years of 1976 and 2000, a significant increase was observed after 2000. A big amount gradual increase at released cumulative seismic moment was observed after the years of 2002 and 2003 (Figure 21a,b).
Figure 21a. Number of earthquake occurrence–time
correlation;
Figure 21b. Released seismic moment-time correlation
Also comparison of catalogue of 1976-2000 and 2000-2015 was done. It was observed that magnitude sensitivity of observed two periods decreased to 2.8 from 3.2, there was a significant difference between two period in terms of earthquake distribution, there was a significant increase at data number of the earthquakes of which magnitude was M=1.3-3.4 and the alteration between two terms was observed as approximately 1847.7%. Mc=2.8 was detected for the region. It was observed at the alteration of b-value
with magnitude that error bars were high at the earthquakes especially of which magnitude was M=0.2-2.7. It was observed that alteration of b-value within time was very variable especially after 2003. Also it was seen that b-value increased especially in the recent years. Frequency-Magnitude Distribution reliability (FMD) was detected as reliable pursuant to F-M code. b-value 1.24, a value=7.26 and Mc=2.8 (Figure 22a). Magnitude completeness map of the region (Magnitude of completeness) was excluded and it was seen that Mc varied between 1.8 and 3.2 and sensitivity increased especially towards Afyon-Tuz Lake Region and Mcomp decreased to 1.8-2.4 (Figure 22b).
Figure 22a. F-M relation, b, a, Mc value in the region;
Figure 22b. Magnitude completeness map of the region
(Magnitude of completeness Mc).
As a result of de-clustering procedure, 414 clusters were detected in the region and blasts were sorted out from the data obtained after the procedure. Therefore de-quarry catalogue that was sorted from blasts was formed. The data
information relevant to that was given at Table 1-2. Example histograms that show number of daytime earthquakes from which blasts were not sorted out and blasts were sorted out and from the blast location are given below (Figure 23).
Figure 23a.
Figure 23b.
Figure 23a. Number of daytime hourly events in the region; 23b. Alteration example of number of daytime events at the
stone quarry locations in the region.
6. Region: Northeastern Turkey
The earthquakes occurred in the region between the years of 1986 and 2015 were assessed within the scope of the study. Number of the earthquake within the selected period was 4076 and magnitude range=1.2-5.8 and Depth=0-48 km (Figure 24a). Significant increase was seen at number of the earthquakes in the region especially after 2004. Importance of the earthquake stations established in this region after 2004 was very big (Figure 24b).
Figure 24a. Earthquake activity map of the region.
Figure 24b. Distribution of the earthquakes by years.
Although a very big increase was not seen at the distribution of the number of the earthquake occurrence by years, a significant increase was observed after 2004 (Figure 25a). A big amount gradual increase at released cumulative seismic moment was observed after the years of 1999 and 2004 (Figure 25b).
Figure 25a. Number of earthquake occurrence–time
correlation;
Figure 25b. Released seismic moment-time correlation.
Also comparison of catalogue of 1984-2004 and 2004-2015 was done. It was observed that magnitude sensitivity of observed two periods decreased to 2.9 from 3.3, there was a significant difference between two period in terms of earthquake distribution, there was a significant increase at data number of the earthquakes of which magnitude was M=1.6-3.6 and the alteration between two terms was observed as approximately 1932.0%.
Mc=2.9 was detected for the region. It was observed at the alteration of b-value with magnitude that error bars were high at the earthquakes especially of which magnitude was M=1.2-2.6. It was also observed that b-value has decreased in the recent years and it was regular. Frequency-Magnitude Distribution reliability (FMD) was detected as reliable pursuant to F-M code (Figure 10a). b-value =1.09, a value= 6.44; Mc=2.9 (Figure 26a). Magnitude completeness map of the region (Magnitude of completeness) was excluded and it was seen that Mc varied between 2.3 and 3.1 and sensitivity
decreased around Erzurum, Horasan, Narman and Mcomp increased to 2.9-3.1 (Figure 26b).
Figure 26a. F-M correlation, b, a, Mc value in the region;
Figure 26b. (Map of magnitude of completeness of Turkey
Mc).
As a result of de-clustering procedure, 153 clusters were detected in the region and blasts were sorted out from the data obtained after the procedure. Therefore de-quarry catalogue that was sorted from blasts was formed. The data information relevant to that was given at Table 1-2. Example histograms that show number of daytime earthquakes from which blasts were not sorted out and blasts were sorted out and from the blast location are given below (Figure 27).
Figure 27a. Figure 27b.
Figure 27a. Number of daytime hourly events in the region;
27b. Alteration example of number of daytime events at the stone quarry locations in the region.
7. Region: Southeastern Turkey
The earthquakes occurred in the region between the years of 1986 and 2015 were assessed within the scope of the study. Number of the earthquake within the selected period was 24377 and magnitude range=0.7-7.2 and Depth=0-50 km (Figure 28a). Significant increase was seen at number of the earthquakes in the region especially after 2004 (Figure 28b).
Figure 28a. Earthquake activity map of the region.
Figure 28b. Distribution of the earthquakes by years.
Although a very big increase was not seen between the years of 1984 and 1999 at the distribution of the number of
the earthquake occurrence by years, a significant increase was observed in 2002 and afterwards. A big amount gradual increase at released cumulative seismic moment was observed after the years of 2004 and 2007 (Figure 29).
Figure 29a. Number of earthquake occurrence–time
correlation;
Figure 29b. Released seismic moment-time correlation.
Also comparison of catalogue of 1986-2002 and 2002-2015 was done. It was observed that magnitude sensitivity of observed two periods decreased to 2.7 from 3.0, there was a significant difference between two period in terms of earthquake distribution, there was a significant increase at data number of the earthquakes of which magnitude was M=1.3-3.5 and the alteration between two terms was observed as approximately 2912.3%.
It was detected for the region that Mc=2.7. It was observed that error bars were very high at the earthquakes of which magnitude was between M=0.7-2.4 at the alteration of b-value with magnitude. It was observed that b-value alteration was very variable especially before 2004 and after 2011. It was also observed that b-value has decreased in the recent years and it was not regular. Frequency-Magnitude Distribution reliability (FMD) was detected as reliable pursuant to F-M code. b-value=0.97, a value=6.68; Mc=2.7 (Figure 30a). Magnitude completeness map of the region (Magnitude of completeness) was excluded and it was seen that Mc varied between 2.7 and 3.2 and sensitivity decreased towards to south and southern east and especially around Syria border and Mcomp increased to 3.0-3.2 (Figure 30b).
Figure 30a. F-M correlation, b, a, Mc value in the region;
Figure 30b. Magnitude completeness map of the
region(Magnitude of completeness Mc).
As a result of de-clustering procedure, 760 clusters were detected in the region and blasts were sorted out from the data obtained after the procedure. Therefore de-quarry catalogue that was sorted from blasts was formed. The data information relevant to that was given at Table 1-2. Example histograms that show number of daytime earthquakes from which blasts were not sorted out and blasts were sorted out and from the blast location are given below (Figure 31a,b).
Figure 31a. Figure 31b.
Figure 31a. Daytime hourly event number in the region; 31b. Alteration example at daytime event number from
stone quarry locations in the region.
4. Stress Analysis
Within the context of this research P and T axis obtained from the focal mechanism solutions of a total of 1350 earthquakes were utilized. 7 regions were selected in sum. For each region, by using mechanism solutions conducted within the scope of research data sets that would provide the input for stress analyzing were done.
Used stress analyzing method (GEPHART 1990) aims to detect regional principal stress axis (s1, s2, s3) of each
processed earthquake by using every single earthquake’s compression (P) and extension (T) axis. This method hypothesizes that earthquake-induced stress zone is stable or in other terms there is no spatial and temporal change in stress zone. The second hypothesis of this method is that dislocation has shear direction and dislocation occurs in the existing pre-weakness plane. The objective of this method is to detect the principal stress axis that correspond to the maximum of compression s1, mid ofcompression s2 and
the minimum compression s3. To the end of defining the
effective stress regime (compressional-extensional) stress ratio R=(s2-s1)/(s3-s1) is used. In the end, for each selected
region, potential effect direction and angle of dip of stress components are measured; thus findings on regional stress regime were manifested. Findings obtained from stress analyzing are as detailed in Figure -32. As can be witnessed in this Figure there are various types of faulting and faulting mechanisms that emerge in response throughout Turkey.
Faulting Mechanism Map of Turkey and Its Surrounding that was prepared by KALAFAT 2015 was used as relevant to the subject (Figure 32). Firstly faulting type map was drawn by using current catalogue. This map puts forth that in general, so many various tectonic regimes have been still continued in Turkey today (Figure 33).
Figure 32. MT Catalogue used in the study (Kalafat, 2015).
Figure 33. Faulting Style Map of Turkey and Surrounding
Area
NF- Normal Faulting; NS Normal Strike Slip (Oblique); SS- Strike Slip Faulting; TS Reverse-Strike Slip (Oblique); TF Reverse Faulting; U not defined faulting).
Current catalogue data were obtained by using general stress analysis (GEPHART 1990) by taking 7 main tectonic roofs that was previously determined. A brief evaluation of the stress analysis findings with respect to regions manifests that;
1st Region (NW Turkey-Marmara Region): Mechanism solutions exhibit that within NW Turkey and Marmara region, strike slip and normal component oblique faults are widely effective. In this region, P-axis directions are generally NW-SE extended.
2nd Region (North Anatolian Fault Zone-NAFZ): Strike slip faults are widely effective and dominant P-axis directions are NW-SE extended in North Anatolia Fault Zone.
3rd Region (Western Turkey): In Western Turkey extension regime is heavily dominant and normal faults are equally dominant. Dominant P- axis directions are W-SW/-E-NE extended on a large scale.
4th Region (Eastern Anatolian Fault Zone-EAFZ): In Eastern Anatolia Fault Zone strike slip faults are dominant and P axis directions are NE-SW extended generally.
5th Region (Central Anatolia): In Central Anatolia Region normal faults are widely dominant. In addition there are some oblique faults that have strike-slip component. In this region too P axis directions are generally E-W extended.
6th Region (Northeastern Turkey): Mechanism solutions in Northeast Anatolia Region reveal that strike slip faults are widely dominant. In this region P axle strikes are usually concentrated on N-NW-S-SE route.
7th Region (Southeast Turkey): In Southeast Turkey Region a compression-shortening regime is dominant. On a general scale trust faults are dominant however strike-slip faults and oblique faults with strike-slip components are also widely present. P axis directions are mostly concentrated NNW-SSE trending.
As an example to that, NAFZ and EAFZ stress analyses were given (Figure 34a,b).
Figure 34a. NAFZ Stress Analysis Results;
Also stress analyses dominant for 7 main tectonic roof (biggest P and biggest T) map was formed (Figure 35, 36).
Figure 35. The Regional stress tensor analysis: Regional
main stress directions (T axis, Max extensional deformation) for 7 main tectonic regions in Turkey. Stress
analysis calculated from Gephard Method (1990).
Figure 36. The Regional stress tensor analysis: Regional
main stress directions (P axis, MAX compressional deformation) for 7 main tectonic regions in Turkey. Stress
analysis calculated from Gephard Method (1990).
5. Results
b-values were calculated from catalogue data that was sorted out by using first original catalogue data and then making declustering and dequarry procedure for every region (dequarry catalog). Total 7367 earthquake clusters were detected for overall Turkey between the years of 1975 and 2015. Also as given at Table-1 and Table-2, total data number and Mc, a-values were calculated and results of both data set were compared. As a conclusion, b-values obtained from dequarry catalogue were detected as lower at some regions and higher at some other regions. But in general, it was seen that b-values slight decreased. For overall Turkey, b-value was detected as b=1.1. Magnitude completeness value for Turkey was detected as Mc=2.7 (Figure 37a.b). The histograms that show number of daily
events were drawn in 7 regions and overall Turkey by using the data from which blasts were not excluded and blasts were excluded. At these histograms, it is clearly seen that to what extent blasts affected number of the events (Figure 38a,b).
Regional stress analysis was done with current data set and it was searched that whether there was a correlation between faulting type found for every region and b-values. As a conclusion, high b-values were detected at the events that gave normal faults (for example; Western Anatolia, central Turkey and Marmara Region) and medium values were detected at the strike slip faults (NAFZ, EAFZ) and low b-values were detected at the events that gave reverse faults (SE Turkey) (Table 1-2).
Overall Turkey
Maximum Likelihood Solution
(from original catalog)
Figure 37a. F-M correlation from overall Turkey original
data, b, a, Mc value; (from dequarry catalog)
Figure 37b. F-M correlation data that overall Turkey
blasting are sorted out, b, a, Mc value (Magnitude of completeness Mc).
Histograms of the number of events
Figure 38a.
Figure 38b.
Figure 38. Histogram of number of events per hour for
whole of Turkey. The histogram is based on the Turkish seismicity catalog from 1975 to 2015. (a)The original distribution, with a clear increase in the number of detected
events during daytime hours due to quarry explosions. (b) “De-quarried” catalog. Alo Some tectonic events have been
removed by the de-quarry algorithm.
Table 1. Magnitude of completeness (Mc) with relative time
periods and obtained the b-values, a-values from the original catalog and their relationship with the main tectonic
frames in Turkey (original catalog; h=0- 50 km.).
Zone Code Zone Name General Fault Types Time Period Number of
Earthquakes Mc b-value a-value 1 Marmara Normal-Oblik 1975-2015 26205 2.6 1.26±0.01 7.44 2 NAFZ Strike-Slip 1975-2015 13029 2.8 1.13±0.01 6.98 3 Western Turkey Normal 1990-2015 81220 2.7 1.34±0.006 8.26 4 EAFZ Strike-Slip 1992-2015 13007 2.7 0.97±0.01 6.47 5 Central Turkey Normal 1976-2015 13212 2.8 1.24±0.02 7.26 6 NE Turkey Strike-Slip 1986-2015 4076 2.9 1.09±0.02 6.44 7 SE Turkey Trust 1986-2015 24377 2.7 0.97±0.009 6.68 8 Overall Turkey Mix 1975-2015 194446 2.7 1.09±0.003 7.94
Table 2. Magnitude of completeness (Mc) with relative time
periods and obtained the b values, a-values from the original catalog and their relationship with the main tectonic
frames in Turkey (de-quarry catalog; h=0-50 km.).
Zone Code Zone Name General Fault Types Time Period Number of
Earthquakes Mc b-value a-value
1 Marmara Normal-Oblik 1975-2015 22428 2.6 1.32±0.01 7.56 2 NAFZ Strike-Slip 1975-2015 11242 2.8 1.20±0.02 7.08 3 Western Turkey Normal 1990-2015 56167 2.7 1.37±0.007 8.19 4 EAFZ Strike-Slip 1992-2015 10084 2.7 0.994±0.01 6.40 5 Central Turkey Normal 1976-2015 10879 2.8 1.26±0.02 7.18 6 NE Turkey Strike-Slip 1986-2015 3367 2.9 1.11±0.03 6.37 7 SE Turkey Trust 1986-2015 16767 2.6 0.916±0.09 6.31 8 Overall Turkey Mix 1975-2015 148638 2.7 1.1±0.004 7.86
6. Conclusion
In this study, Earthquake catalog of the events within the time period of 1900-2015 prepared by Boğaziçi University Kandilli Observatory and Earthquake Research Institute (KOERI) is analyzed. The catalog consists of earthquakes occurred in Turkey and surrounding area (32O
-45O N/23O
-48OE). The current earthquake catalog data has been checked in two aspects; the time dependent variation and compliance for different regions. Specifically the data set prior to 1976 was found deficient. As the development of earthquake seismic stations took place in different regions no contemporarily, catalog data set have been analyzed for different time period and regions. In total, 7 regions were evaluated according to the tectonic specifications and data set.
In this study for every region original data were used without any change; b- values, a- values, Magnitude of completeness (Mc) were calculated by using ZMAP software package (WIEMER 2001). For the calculation of b- values and depth was estimated h= 0-50 km. In addition to this, for each region; Depth-Time, Magnitude-Time, Magnitude-Earthquake occurrence number, Earthquake occurrence Depth, Earthquake occurrence number-Time graphics, b- values, a-values, Earthquake Density Map (Ed) and Magnitude of completeness (Mc) map were prepared.
One of the important complications for the seismic catalogs is discriminating real (natural) seismic events from artificial (unnatural) seismic events. Therefore within the original current catalog events especially artificial quarry blasts and mine blasts have been separated by declustering (REASENBERG 1985), and dequarry (WIEMER and BAER 2000) methods. Declustering process eliminates induced earthquakes especially occurred in thermal regions, large water basins, mine regions from the original catalogs. Then for each region b-value (the data set eliminated from the explosions), a- values and Mc values were calculated, map, graphics and related data tables were prepared. In this way b and a- values were compared. For the assessment of the current catalog all explosions within the selected region is cleaned out with the algorithm developed by WIEMER and BAER 2000. As a result seismic events produced by quarry blasts, mine blasts and large excavations were removed. Between 08-15h time periods, the number of earthquakes shows major differences within the region in terms of timing. The reason is the existing quarry and mine blast studies in the region. The studies on this subject are continuing intensively in recent years (HEDLIN et al. 1990; KIM et al. 1994; WIEMER and WYSS 1997; WIEMER and BAER 2000; HORASAN et al. 2009). Current earthquake catalogs are especially used by the statistical seismologists and such problems are being solved by various algorithms. The most common one of these
algorithms are WIEMER and BAER 2000 algorithm. In this method, first of all, upper magnitude threshold (Mmax=3.0) is calculated. By using REASENBERG 1985 method aftershock series are removed, generally the code developed by WIEMER and BAER 2000 defines aftershock series (which is the activity more than % 20 of daily activity), however the truncated catalog distorts them. In each node 0.1O
x0.1O
sized cells and the most nearest 100 events were used. Spatial map of Rq which is the ratio of daily time to night time ratio (DT/NT) is widely used in recent years. The algorithm shows that within certain time period, especially in blast regions Rq value is high. For the calculation of Day/Night ratio in each node 0.1O
x0.1O
cells and the closest 100 events have been used. In addition to this aftershock sequences, induced earthquakes, earthquake swarms and earthquake clusters are de-clustered. Thus earthquake clusters could be seen and removed if needed. Current moment tensor catalog prepared by KALAFAT 2015 the faulting type map of the region was prepared. By using the current data set and strike, dip, rake values for each earthquake 7 different dominant stress axis directions were found and regional stress analysis have been done. As a result for each region it is examined if there is a relation between fault type and b- values. In this study, the hypothesis of the relation between previously evaluated and currently ongoing extensional, compression, strike-slip fault regimes in Turkey and b- values are tested one more time. We found normal faulting events (such as Western Turkey, Marmara Region) have the highest b-values. Also strike slip events (NAFZ, EAFZ) have intermediate b-values, while thrust events (SE Turkey) have the lowest b-values.
Acknowledgements: This study was supported by the
Department of Science Fellowship and Grant programs (2014-2219) of TUBITAK (The Scientific and Technological Research Council of Turkey).
It also encourages the continuation of the study and sheds light on the constructive contributions that Prof.Dr. Nafi Toksöz gave. Also I would like to thank Prof.Dr. Yusuf Bayrak (Editör-in Chief), first reviewer Associate Prof. Hakan Çınar and the anonymous reviewer for their constructive comments and suggestions which improved the manuscript.
REFERENCES
UDIAS, A., (1999). Principles of Seismology. Cambridge University Press, Cambridge, ISBN 0-521- 62478-9.
AYHAN, E., KALAFAT D. (1989). Türkiye ve yakın
çevresinde 1949-1980 yılları arasında oluşan ve manyitüdleri saptanamamış depremlerin Kayıt Süresi-Manyitüd ilişkisi ile manyitüdlerinin tayini,
MICHAEL, A.J., (1987b). Use of Focal Mechanism to
Determine Stress: A control Study, Journal of
Geophysical Research, 92, p. 357-368.
RICHTER, C. F., (1958). Elementary Seismology, ISBN
10: 0716702118
KALAFAT, D., (2015). Türkiye ve Çevresi
Faylanma-Kaynak Parametreleri (MT) Kataloğu (1938-2015); A Cataloque of Source Parameters of Moderate and Strong Earthquakes for Turkey and its Surrounding Area (1938-2015), In preparation for publication,
İstanbul.
KALAFAT, D., (2002). Sismik Ağlarda Deprem Büyüklüklerinin Ampirik olarak İlişkilendirilmesi,
Aktif Tektonik Araştırma Gurubu Altıncı Toplantısı (ATAG-6), Bildiri Özleri Kitapçığı, s. 105-108, MTA Genel Müdürlüğü, 21-22 Kasım 2002, Ankara (in Turkish).
KALAFAT, D., (1989). İznik Deprem istasyonu için yerel
manyitüd denkleminin saptanması, DAE Bülteni,
Sayı 65, 57-68.
KALAFAT, D., (1989). Batı Anadolu’da yer alan sismik
istasyonların süreye bağlı yerel manyitüd
denklemlerinin çıkartılması, DAE Bülteni, Sayı 65,
83-94.
KALAFAT, D., (2007). Current Seismic Network and
Application of KOERI, UNESCO South Eastern
Europe Network meeting, 14-16 March 2007, Athens, Greece.
KALAFAT, D., (2002). Sismik Ağlarda Deprem Büyüklüklerinin Ampirik olarak İlişkilendirilmesi,
Aktif Tektonik Araştırma Gurubu Altıncı Toplantısı (ATAG-6), Bildiri Özleri Kitapçığı, s. 105-108, MTA Genel Müdürlüğü, 21-22 Kasım 2002, Ankara (in Turkish).
BISZTRICSANY, E., (1958). A new method for the
determination of the magnitude of the Puget Sound
Regioni Bull. Seism. Soc. Am., 62, 1133-1171. GÖRGÜN, E., (2003). Calibration of Various Magnitude
Scales in Turkey Using Broadband Data, Yüksek
Lisans Tezi, Boğaziçi Üniversitesi, Kandilli Rasathanesi ve Deprem Araştırma Enstitüsü.
AYHAN, E., (1988). Kavak Deprem İstasyonuna ait Süreye
Dayalı Magnitüd Denklemi Kullanılarak Doğu
Anadolu Depremlerinin Mağnitüdlerinin
Saptanması, DAE Bülteni, Sayı 62, 111-123.
ALSAN, E., (1978). İstanbul Kandilli deprem istasyonu için
süreye bağlı mangnitüd denklemi, DAE Bülteni, Sayı
21, 34-42.
GUTENBERG B, RICHTER C.F. (1944). Frequency of
earthquakes in California, Bull. Seism. Soc. Am.34,
p.185–188.
GULIA, L., WIEMERS. (2010). The influence of tectonic
regimes on the earthquake size distribution: A case study for Italy, Geophysical Research Letters,
Volume 37, Issue 10, May 2010, p 1-6.
LAURA, G., (2010). Detection of quarry and mine blast
contamination in European regional catalogues, Nat
Hazards, DOI 10.1007/009-9426-8,
s11069-009-9426-8.
HEDLIN M.A.H, MINSTER J.B., ORCUTT J.A. (1990).
An automatic means to discriminate between earthquakes and quarry blasts, Bull. Seismol. Soc.
Am. 80, p.2143–2160.
HORASAN, G., GÜNEY A.B., KÜSMEZER A., BEKLER F., OĞÜTÇÜ Z., MUSAOĞLU N. (2009).
Contamination of seismicity catalogs by quarry blasts: an example from Istanbul and its vicinity, northwestern Turkey, J. Asian Earth Sci. 34(1),
p.90–99.
GEPHARD, J. W., (1990). FMSI: A FORTRAN program
for inverting fault/slickenside and earthquake focal mechanism data to obtain the original stress tensor, Comput.Geosci., 16, p.953-989.
WÜSTER, J., (1993). Discrimination of chemical
explosions and earthquakes in Central Europe—a case study, Bull. Seism. Soc. Am. 83(4), p.1184–
1212.
KALAFAT, D., ÖZ G., KARA M. (1998). Anadolu’ da yer
alan on-line deprem istasyonlarının magnitüd denklemlerinin çıkartılması, Deprem Araştırma
Bülteni, Sayı 76, 20-30 (in Turkish).
KALAFAT, D., GÜNEŞ Y., KARA M., GARİP P.D., K.KEKOVALI, KULELİ S., GÜLEN L.,
YILMAZER M., ÖZEL N.M. (2007).
Bütünleştirilmiş Homojen Türkiye Deprem
Kataloğu (1900-2005; M≥4.0): A revised and extended earthquake cataloque for Turkey since 1900 (M≥4.0), Boğaziçi Üniversitesi Yayınları
No=977, 558p., Bebek-İstanbul.
KALAFAT, D., ÖZ G., KARA M., ÖĞÜTÇÜ Z., KILIÇ K., PINAR A., YILMAZER M. (2000). Türkiye ve
Dolayları Deprem Kataloğu (An Earthquake Catalogue for Turkey and Surrounding Area 1981-1997, M≥ 4.0) Boğaziçi Üniversitesi Yayınları,
2000,Yayın no:699, 236p.
KALAFAT, D., KEKOVALI K., GÜNEŞ Y., YILMAZER M., SUVARIKLI M., ÖĞÜTCÜ Z. ve HORASAN G. (2006). Türkiye geniş bantlı ulusal sismik ağ
tasarımı ve uygulaması, Aktif Tektonik Araştırma
Grubu (ATAG) 10. Toplantısı 2-4 Kasım 2006 İzmir, Bildiri Özler Kitabı s. 47-50.
TSUMURA, K., (1967). Determination of earthquake
magnitude from total duration of oscillation,
Bull.Earthq.Res.Ins., 15, 7-18.
SEVİMAY, K., (1983). Kandilli Rasathanesi deprem ağı
için yerel manyitüd denklemlerinin saptanması, DAE
Bülteni, Sayı 40, 65-85.
KIM W.Y., SIMPSON D.W., RICHARDS P.G. (1994).
High-frequency spectra of regional phases from earthquakes and chemical explosions, Bull. Seism.
Soc. Am. 84(5), p. 1365–1386.
LEE,W.H.K., BENNER R.E. and MEAGER K.L. (1972). A
method of estimating magnitude of local earthquakes from signal duration. U.S. Geological Survey, Open
File Report.
OGATA, T., and KATSURA K. (1993). Analysis of
temporal and spatial heterogeneity of magnitude frequency distribution inferred from earthquake cataloque, Geophy. J. Int., 113, p.727-738.
OKUDA, S., OUCHI T., and TERASHIMA T. (1993).
Deviation of Magnitude Frequency-Distribution of Earthquakes from Gutenberg-Richter Law-Detection of Precurory Anomalies Prior to Large Earthquakes,
Phys. Earth Planet. Inter. 73 (3-4), p. 229-238.
SHEARER, P.M., (1999). Introduction to Seismology, Cambridge University Press, San Diago, ISBN 0-521-66953-7.
REASENBERG, P., (1985). Second-order moment of
central California seismicity: 1969–1982.J Geophys.
Res. 90, p. 5479–5495.
REAL, C.R. and TENG T.L. (1973). Local Richter
magnitude and total signal duration in Southern California, Bull.Seism., Soc, Am., 63, 1809-1827.
HERRMAN, R. B., (1980). Q Estimates using the coda of
local earthquakes, Bull. Seism. Soc. Am., 70,
447-468.
RYDELEK, P.A., and SACKS S. (1989). Testing the
completeness of earthquake catalogs and the hypotesis of self-similarity, Nature 337, 251-253.
RYDELEK, P.A., and SACKS S. (1992). Comment on “Seismicity and detection/location treshold in the
southern Great Basin seismic network” by Joan Gomberg, Journal of Geophysical Research, 97,
p.15361-15362.
SEVİMAY, K., GÜNGÖR A. (1987). Kandilli Rasathanesi
Deprem Ağı için Yerel Magnitüdlerin Saptanması,
DAE Bülteni, Sayı 57, 56-67.
SCHORLEMMER, D., S. WIEMER, M. WYSS (2005).
Variations in earthquake-size distribution across different stress regimes, Nature 04094, Vol.437, p.
539-542.
SCHORLEMMER, J. WOESSNER S. (2008). Probability
of Detecing an Earthquake, BSSA Vol.98, No. 5, p.
2103-2117.
WIEMER, S., (2001). A software package to analyze
seismicity: ZMAP. Seismol. Res. Lett. 72, p.373–
382.
SOLOVEV, S.L., (1965). Seismicity of Sakhalin, Bull. Earthq.Res.Inst., Tokyo Univ.,43,95-102.
TORMANN, T., WIEMER S., HAUKSSON E. (2010).
Change of reporting rates in the Southern Californian earthquake catalog, introduced by a new definition of Ml, BSSA, Vol.100, No.4, pp.
UTSU, T., (1965). A method for determining the value of b
in a formula log n=a-bM showing the magnitude frequency for earthquakes, Geophys. Bull. Hokkaido
Univ., 13, p. 99-103.
ÜÇER, S.B., AYHAN E., BAŞARIR E., SANCAKLI N., ALSAN E., TEZUÇAN L. (1980). 1979 yılı Batı
Türkiye Deprem Etkinliği, DAE Bülteni, Sayı 31,
1-72.
ÜÇER, S.B., E. AYHAN, N. ULUSAN, E. BAŞARIR, E. AYHAN, L. TEZUÇAN ve C. KAPTAN (1977).
Batı Türkiye Deprem Etkinliği, DAE Bülteni, Sayı
19, 45-93.
WESSEL, P., SMITH W.H.F. (1995). New version of the
generic mapping tools released. Eos Trans 76, p.
329.
WIEMER , S. and WYSS M. (1994). Seismic quesence
before the Lenders (M=7.5) and Big Bear (M=6.5) 1992 earthquakes, Bull. Seism. Soc. Am. 84, p. 900–
916.
WIEMER, S. and WYSS M. (1997). Mapping the
frequency-magnitude distribution in asperities: and improved tecnique to calculate reccurence
time?, J. Geophys. Res. 102, 1515-15128.
WIEMER, S. and KATSUMATA K. (1999). Spatial
variability of seismic parameters in aftershock zones, J.Geophys. Res., 104, 13, p.135-151.
WIEMER, S., BAER M. (2000). Mapping and removing
quarry blast events from seismicity catalogs., Bull.
Seism. Soc. Am. 90(2), p.525–530.
WIEMER, S., WYSS M. (2000). Minimum magnitude of
completeness in earthquake catalogs: examples from Alaska, the Western United States, and Japan. Bull.
Seism. Soc. Am. 90(4), p.859–869.
WIEMER, S. and SCHORLEMMER, D. (2007). ALM: An
asperity-based likelihood model for California,
Seismol. Res. Lett. 78, p.134–140.
WOESSNER, J., WIEMER S. (2005). Assessing the quality
of earthquake catalogues: estimating the magnitude of completeness and its uncertainty, Bull. Seism.
Soc. Am. 95(2), p.684–698.
WYSS, M. (1973). Toward a physical understanding of the
earthquake frequency distribution, Geophy. J. Royal
Astronomical Society, 31, p. 341-359.
ÖĞÜTÇÜ, Z., (1988). Kuzey Kıbrıs Türk Cumhuriyeti
Lefkoşe Deprem İstasyonu Süreye bağlı Manyitüd denklemi, DAE Bülteni, Sayı 62, 96-110.
ZUNIGA F.R., WYSS M. (1995). Inadvertent changes in
magnitude reported in earthquake catalogs:
Influence on b-value estimates, Bull. Seism. Soc.
Am. 85(6), p.1858–1866.
ZUNIGA F.R., WIEMER S. (1999). Seismicity patterns:
are they always related to natural causes?, Pageop