Corresponding author: Dr. Gulbanu Erkan Assoc. Prof.
Department of Internal Medicine
Division of Gastroenterology Istanbul Medipol University Medipol Mega Üniversite Hastanesi TEM Avrupa Otoyolu Göztepe Çıkışı No: 1 34214 Istanbul, Turkey Phone: +90 212 4607070 E-mail: gcanbaloglu@yahoo. com
1 Department of Internal Medicine, Division of Gastroenterology, Istanbul Medipol
University, Istanbul, Turkey
2Department of Biochemistry, Faculty of Medicine, Gazi University, Ankara, Turkey 3Balıkesir Public Health Directorate of Medical Laboratory, BalIkesir, Turkey
Submitted: 11 March 2016 Accepted: 19 May 2016
Arch Med Sci 2018; 14, 4: 781–787
DOI: https://doi.org/10.5114/aoms.2016.61811 Copyright © 2016 Termedia & Banach
Angiopoietin-like protein 2 and angiopoietin-like protein 6
levels in patients with nonalcoholic fatty liver disease
Gulbanu Erkan1, Suzan Muratoglu2, Ugur Ercin3, Ayse Bilgihan2
A b s t r a c t
Introduction: The aim of the current study was to examine the difference between patients detected with nonalcoholic fatty liver disease (NAFLD) and healthy subjects in terms of serum angiopoietin-like protein (ANGPTL) 2 and ANGPTL6 levels and to evaluate the correlation between ANGPTL2 and ANGPTL6 levels and liver enzyme levels, fasting glucose, lipid levels, and steatosis degree on ultrasonography (USG).
Material and methods: A total of 159 participants were included in the study. The participants were divided into 3 groups depending on the steatosis de-gree on USG and serum alanine aminotransferase (ALT) levels: the NAFLD group with increased ALT, the NAFLD group with normal ALT, and the healthy control group. The groups were compared in terms of biochemical and ul-trasonographic findings, insulin resistance, metabolic syndrome (MetS), and anthropometric parameters.
Results: There was no significant difference between NAFLD patients and healthy subjects with respect to serum ANGPTL2 and ANGPTL6 levels (p > 0.05). ANGPTL2 levels did not correlate with serum, biochemical, or ultrasonographic findings, or anthropometric parameters (p > 0.05). A positive correlation was found between serum ANGPTL6 levels and fasting blood glucose, ALT, alkaline phosphatase, g-glutamyl transpeptidase, fasting insulin, and HOMA-IR levels. Conclusions: While our findings suggest no relationship between serum ANGPTL2 and ANGPTL6 levels and NAFLD, ANGPTL6 levels may be relat-ed to metabolic and biochemical parameters. The effects of ANGPTL2 and ANGPTL6 in the pathogenesis of NAFLD should be investigated further. Key words: nonalcoholic fatty liver disease, angiopoietin-like protein 2, angiopoietin-like protein 6.
Introduction
Non-alcoholic fatty liver disease (NAFLD) is a common hepatic disorder characterized by the concentration of fat greater than 5% of liver weight in the presence of < 20 g/day of alcohol intake and no evidence of other caus-es of hepatic disease [1]. Non-alcoholic fatty liver disease has a strong rela-tionship with insulin resistance (IR) and obesity and is currently considered to be the manifestation of the metabolic syndrome (MetS) in the liver [2].
Metabolic syndrome is defined as a combination of risk factors for car-diovascular disease (CVD) including abdominal fat, dyslipidemia, IR, hy-pertension (HT), and glucose intolerance. Of these, obesity and IR are two
major components of the MetS and have a close relationship with the progression of NAFLD [3].
Recently, a novel family of proteins has been identified and recognized as ‘angiopoietin-like proteins’ (ANGPTLs), which exhibit structural sim-ilarities with angiogenic-regulating factors that are known as angiopoietins [4]. In humans, the ANGPTL2 level is increased in obesity (especially due to visceral fat) and is closely related to the lev-els of systemic IR and inflammation [5]. ANGPTL6, also called angiopoietin-like growth factor (AGF), is considered to counteract obesity through the elevation of systemic energy expenditure and the prevention of subsequent metabolic disease [6].
Literature reviews indicate that there has been no study investigating serum ANGPTL2 and ANGPTL6 levels in NAFLD. Serum ANGPTL2 and ANGPTL6 levels have been reported to be elevated in diabetic and obese patients in numerous previ-ous studies [5, 7, 8]; therefore, we included non-obese, non-diabetic NAFLD patients in our study.
The current study was aimed to investigate:
– the difference between NAFLD patients and
healthy subjects with respect to serum ANGPTL2 and ANGPTL6 levels,
– the difference between NAFLD patients and
healthy subjects with respect to MetS and insu-lin resistance, and,
– the association between ANGPTL2 and ANGPTL6 levels and fasting glucose, lipid levels, liver lipid levels, enzyme levels, and the degree of steato-sis on ultrasonography.
Material and methods
The study was conducted on 159 participants, including 46 non-obese, non-diabetic patients who presented with dyspeptic complaints and hepa-tosteatosis on USG and had a minimum 6-month history of elevated liver enzyme levels (group I), 62 patients who presented with hepatosteatosis on USG and normal liver function tests (group II), and 51 healthy controls (control group). Approv-al was obtained from the LocApprov-al Ethics Committee and informed consent was obtained from all the participants. The study was conducted in line with the principles of the Declaration of Helsinki.
The inclusion criteria employed in the study were as follows: a body mass index (BMI) of 18.5–
25 kg/m2, presence of hepatosteatosis on USG,
and negative markers for metabolic, autoimmune, and viral liver diseases.
Exclusion criteria included: presence of diabe-tes mellitus (DM) or impaired glucose tolerance, positive markers for metabolic, autoimmune, and viral liver diseases such as hepatitis B virus (HBV), hepatitis C virus (HCV), and autoimmune hepatitis, use of drugs that lead to hepatic steatosis such as corticosteroids, oral contraceptives,
methotrex-ate, tetracycline, and amiodarone, excessive con-sumption of ethanol (> 20 g/day), and presence of chronic liver disease, biliary tract dilatation, and hepatic nodule and mass on USG.
The control group included non-obese, non-di-abetic participants with negative markers for vi-ral, metabolic, and autoimmune liver diseases,
a BMI of 18.5–25 kg/m2, no history of diabetes,
no antidiabetic drug use, normal postprandial and fasting blood glucose and glycated hemoglobin
(HbA1c) levels, and normal liver parenchyma and
biliary system on USG.
All the participants were examined for the pres-ence of diabetes, impaired glucose tolerance, hyper-tension, cardiovascular disease, and use of ethanol. Height, weight, and waist circumference were mea-sured and converted to the nearest cm or half-kg units. The measurement of the waist circumfer-ence was performed at the midpoint between the iliac crest and the lower border of the rib cage.
Presence of HT was defined as the use of anti-hypertensive drugs or having a resting recumbent blood pressure of ≥ 140/90 mm Hg on a minimum of two measurements. Following the measure-ment of height and weight, the calculation of BMI was achieved by dividing the weight (kg) by the
squared height (m2).
Measurement of biochemical parameters
Blood collection was intravenously performed in the morning after overnight fasting (12 h). Serum and EDTA plasma aliquots were centrifuged and then stored at –70°C until analysis. Serum levels of alanine aminotransferase (ALT), aspartate amino-transferase (AST), g-glutamyl transpeptidase (GGT), triglycerides (TG), alkaline phosphatase (ALP), fast-ing blood glucose (FBG), high-density lipoprotein (HDL) cholesterol, total bilirubin and albumin, and total cholesterol (T. Cho) were measured using the standard techniques of clinical chemistry labora-tories and used for clinical analysis. Calculation of low-density lipoprotein (LDL) cholesterol was achieved by using Friedewald’s equation.
Serum glucose levels were measured using the Hexokinase/G-6-PDH technique (Abbott Architect C8000 System Analyzer, Abbott Laboratories, Ab-bott Park, Illinois, USA), and the measurement of insulin levels was achieved by using the chemilumi-nescent microparticle immunoassay (CMIA) tech-nique (Abbott Architect i2000sr System Analyzer, Abbott Laboratories, Abbott Park, Illinois, USA).
Quantification of serum ANGPTL2 concentra-tions was performed using a commercially avail-able enzyme-linked immunosorbent assay (ELISA) kit (USCNLIFE, catalog no: E91919HU, Export Pro-cessing Zone Building F, Wuhan, Hubei 430056, PRC) in accordance with the guidelines of the manufacturer. Quantification of serum ANGPTL6
concentrations was performed using a commer-cially available ELISA kit (USCNLIFE, catalog no: E82468HU, Export Processing Zone Building F, Wu-han, Hubei 430056, PRC) in accordance with the guidelines of the manufacturer.
Definition of metabolic syndrome
Presence of MetS was defined as the detection of 3 or more of the components reported by the revised Adult Treatment Panel (ATP) III of the Na-tional Cholesterol Education Program [9]. These components have been reported as follows: 1) in-creased waist circumference (waist circumference of 102 cm or greater in males or 88 cm or greater in females); 2) elevated triglyceride (≥ 150 mg/dl); 3) decreased HDL cholesterol (< 40 mg/dl for males and < 50 mg/dl for females); 4) increased blood pressure (≥ 130/85 mm Hg or taking hypertensive drugs); 5) elevated fasting glucose (≥ 100 mg/dl or taking antihyperglycemic drugs).
Definition of IR
Presence of IR was defined in accordance with the homeostasis model assessment index (HOMA- IR), and the calculation of IR was performed using the computer-based solution of the model devel-oped by the Diabetes Trials Unit, Oxford Center for Diabetes, Endocrinology, and Metabolism. The cut-off value accepted for HOMA-IR was 2.7 [10]. Patients were divided into two groups, insulin-sen-sitive (HOMA-IR < 2.7) and insulin-resistant (HOMA- IR ≥ 2.7), depending on their HOMA-IR levels.
Hepatic ultrasonography
Hepatic ultrasonography was performed by an experienced gastroenterologist. Diagnosis of fat-ty liver was established using the standard crite-ria reported in the literature, which include deep beam attenuation, bright vessel walls, liver to kid-ney contrast, and parenchymal brightness [11].
Statistical analysis
All data were analyzed using SPSS 15.0 for Win-dows (Chicago, IL, USA). Continuous variables were presented as mean ± standard deviation (SD), or median and minimum-maximum values where ap-propriate. Categorical variables were expressed as counts and percentages. Normality of distribution was assessed using the Shapiro-Wilk test, and the homogeneity of variance was tested using the Levene test. The difference in numerical variables among multiple groups was tested using one-way ANOVA or Welch variance for parametric data and the Kruskal Wallis test for non-parametric data. Following these tests, the Tukey HSD, Games-How-ell test, and the Dunn test were used for pairwise
comparisons, respectively. The difference in terms of numerical variables between two groups was assessed using the t-test for parametric data and the Mann-Whitney U test for non-parametric data.
The c2 test was used to assess the differences
be-tween the groups in terms of categorical variables. The correlation between numerical variables was evaluated using the Spearman correlation coeffi-cient. A p-value of < 0.05 was accepted as statis-tically significant.
Results
Demographic, metabolic and biochemical findings
The study included a total of 159 participants: 46 non-obese, non-diabetic patients who presented with dyspeptic complaints and hepatosteatosis on USG and had a minimum 6-month history of ele-vated liver enzyme levels (group I); 62 patients who presented with hepatosteatosis on USG and had normal liver function tests (group II); and 51 healthy controls (control group). Table I summarizes the de-mographic and biochemical findings of the groups.
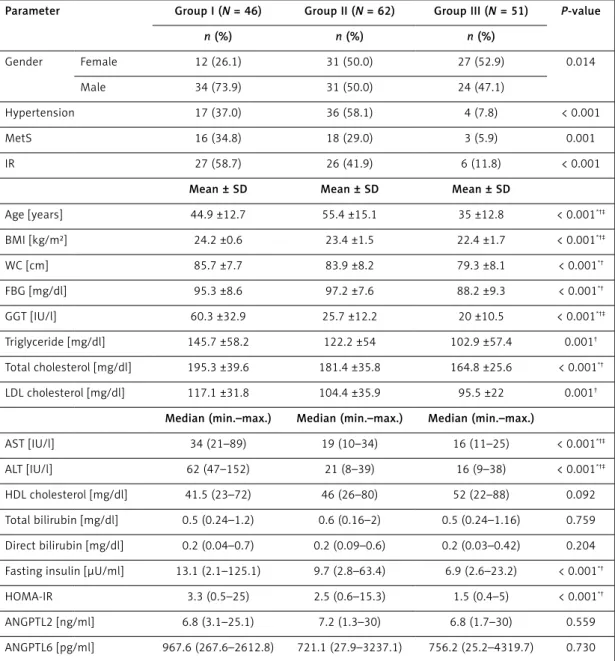
Significant differences were observed among the 3 groups with respect to HT (37%, 58.1%, 7.8%, respectively; p < 0.001), MetS (34.8%, 29%, 5.9%, respectively; p = 0.001), IR (58.7%, 41.9%, 11.8%, respectively; p < 0.001), age (44.9 ±12.7, 55.4 ±15.1, 35 ±12.3, respectively; p < 0.001), BMI (24.2 ±0.6 kg/m², 23.4 ±1.5 kg/m², 22.4 ±1.7 kg/ m², respectively; p < 0.001), AST (34 IU/l, 19 IU/l, 16 IU/l; p < 0.001), ALT (62 IU/l, 21 IU/l, 16 IU/l, respectively; p = 0.001), and GGT (60.3 ±32.9 IU/l, 25.7 ±12.2 IU/l, 20 ±10.5 IU/l, respectively; p < 0.001). Groups I and II had significantly higher levels in waist circumference (WC) (85.7 ±7.7 cm, 83.9 ±8.2 cm vs. 79.3 ±8.1 cm; p < 0.01), waist/ hip ratio (WHR) (0.9 ±0.1, 0.9 ±0.1 vs. 0.8 ±0.1; p < 0.001), FBG (95.3 ±8.6 mg/dl, 97.2 ±7.6 mg/ dl vs. 88.2 ±9.3 mg/dl; p < 0.001), fasting insulin (13.1 µU/ml, 9.7 µU/ml vs. 6.9 µU/ml; p < 0.001), and HOMA-IR (3.3, 2.5 vs. 1.5; p < 0.001) com-pared to the control group, whereas these param-eters showed no significant difference between groups I and II (p > 0.05). Moreover, no significant difference was observed among the three groups in terms of serum ANGPTL2 (6.8 ng/ml, 7.2 ng/ ml, 6.8 ng/ml, respectively; p = 0.55) or ANGPTL6 levels (967 pg/ml, 721 pg/ml, 756.2 pg/ml, respec-tively; p = 0.73) (p > 0.05).
Relationship between serum ANGPTL2 levels and demographic, clinical and laboratory findings
Serum ANGPTL2 level showed no significant dif-ference between females and males (10.2 ±7.5 ng/ ml vs. 8.3 ±5.9 ng/ml; p = 0.059), between
pa-tients with and without HT (8.3 ±6.8 ng/ml vs. 9.6 ±6.6 ng/ml; p = 0.058), between patients with and without MetS (9.8 ±7.1 ng/ml vs. 9 ±6.6 ng/ml; p = 0.44), or between patients with and without IR (9.3 ±7.1 ng/ml vs. 9.1 ±6.5 ng/ml; p = 0.99). No significant correlation was found between serum ANGPTL level and the steatosis level detected on USG (p > 0.05). Moreover, serum ANGPTL2 exhib-ited no significant correlation with age (r = –0.04; p = 0.56), BMI (r = –0.04; p = 0.58), WC (r = –0.12; p = 0.10), WHR (r = –0.01; p = 0.90), FBG (r = 0.03; p = 0.68), AST (r = –0.05; p = 0.47), ALT (r = –0.003; p = 0.97), ALP (r = 0.017; p = 0.83), GGT (r = –0.09;
p = 0.25), ALB (r = –0.004; p = 0.96), total choles-terol (r = 0.05; p = 0.48), LDL cholescholes-terol (r = 0.058; p = 0.47), HDL cholesterol (r = –0.056; p = 0.53), TG (r = 0.10; p = 0.18), total bilirubin (r = –0.01; p = 0.89), direct bilirubin (r = –0.05; p = 0.46), fast-ing insulin (r = 0.04; p = 0.54), HOMA-IR (r = 0.04; p = 0.59), or ANGPTL6 level (r = –0.06; p = 0.44).
Relationship between ANGPTL6 levels and demographic, clinical and laboratory findings
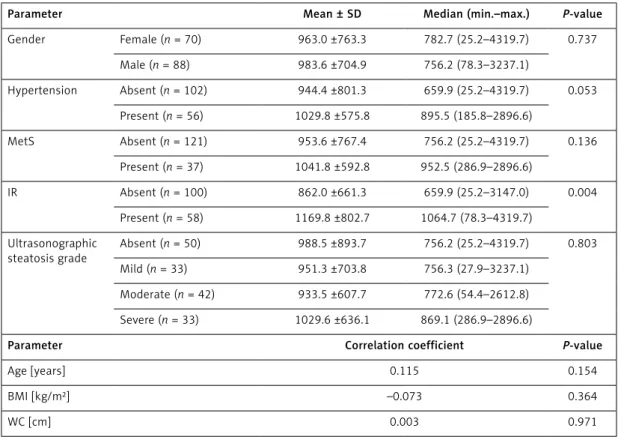
Table II presents the relationship between ANGPTL6 level and demographic and clinical
Table I. Demographic and biochemical findings of the groups
Parameter Group I (N = 46) Group II (N = 62) Group III (N = 51) P-value
n (%) n (%) n (%) Gender Female 12 (26.1) 31 (50.0) 27 (52.9) 0.014 Male 34 (73.9) 31 (50.0) 24 (47.1) Hypertension 17 (37.0) 36 (58.1) 4 (7.8) < 0.001 MetS 16 (34.8) 18 (29.0) 3 (5.9) 0.001 IR 27 (58.7) 26 (41.9) 6 (11.8) < 0.001
Mean ± SD Mean ± SD Mean ± SD
Age [years] 44.9 ±12.7 55.4 ±15.1 35 ±12.8 < 0.001*†‡ BMI [kg/m²] 24.2 ±0.6 23.4 ±1.5 22.4 ±1.7 < 0.001*†‡ WC [cm] 85.7 ±7.7 83.9 ±8.2 79.3 ±8.1 < 0.001*† FBG [mg/dl] 95.3 ±8.6 97.2 ±7.6 88.2 ±9.3 < 0.001*† GGT [IU/l] 60.3 ±32.9 25.7 ±12.2 20 ±10.5 < 0.001*†‡ Triglyceride [mg/dl] 145.7 ±58.2 122.2 ±54 102.9 ±57.4 0.001† Total cholesterol [mg/dl] 195.3 ±39.6 181.4 ±35.8 164.8 ±25.6 < 0.001*† LDL cholesterol [mg/dl] 117.1 ±31.8 104.4 ±35.9 95.5 ±22 0.001†
Median (min.–max.) Median (min.–max.) Median (min.–max.)
AST [IU/l] 34 (21–89) 19 (10–34) 16 (11–25) < 0.001*†‡
ALT [IU/l] 62 (47–152) 21 (8–39) 16 (9–38) < 0.001*†‡
HDL cholesterol [mg/dl] 41.5 (23–72) 46 (26–80) 52 (22–88) 0.092
Total bilirubin [mg/dl] 0.5 (0.24–1.2) 0.6 (0.16–2) 0.5 (0.24–1.16) 0.759
Direct bilirubin [mg/dl] 0.2 (0.04–0.7) 0.2 (0.09–0.6) 0.2 (0.03–0.42) 0.204
Fasting insulin [µU/ml] 13.1 (2.1–125.1) 9.7 (2.8–63.4) 6.9 (2.6–23.2) < 0.001*†
HOMA-IR 3.3 (0.5–25) 2.5 (0.6–15.3) 1.5 (0.4–5) < 0.001*†
ANGPTL2 [ng/ml] 6.8 (3.1–25.1) 7.2 (1.3–30) 6.8 (1.7–30) 0.559
ANGPTL6 [pg/ml] 967.6 (267.6–2612.8) 721.1 (27.9–3237.1) 756.2 (25.2–4319.7) 0.730
WC – waist circumference, Met S – metabolic syndrome, FBG – fasting blood glucose, HDL – high-density lipoprotein, TG – triglycerides, IR – insulin resistance, BMI – body mass index, HOMA-IR – index of insulin resistance calculated according to the HOMA (homeostasis model assessment) method, T. cholesterol – total cholesterol, LDL – low-density lipoprotein, AST – aspartate aminotransferase, ALT – alanine aminotransferase (ALT), GGT – g-glutamyl transpeptidase. *Group II different from group III, †group I different from group III, ‡group I different from group II.
findings. Serum ANGPTL6 level showed no signif-icant difference between females and males (963 ±763.3 pg/ml vs. 983.6 ±704.9 pg/ml; p = 0.73), between patients with and without HT (1029.8 ±575.8 pg/ml vs. 944.4 ±801.3 pg/ml; p = 0.053), or between patients with and without MetS (1041.8 ±592.8 pg/ml vs. 953.6 ±767.4 pg/ml; p = 0.136) (p > 0.05). Moreover, the serum ANGPTL6 levels in the patients with IR were significantly higher com-pared to the patients without IR (1169.8 ±802.7 pg/ml vs. 862 ±661.3 pg/ml; p = 0.004).
Serum ANGPTL6 level showed no significant correlation with age, BMI, WC, WHR, AST, ALB, LDL cholesterol, total cholesterol, HDL choles-terol, TG, direct bilirubin levels, or total bilirubin (p > 0.05). Nevertheless, serum ANGPTL6 level exhibited a significant positive correlation with FBG (r = 0.18; p = 0.01), serum ALT (r = 0.19; p = 0.017), ALP (r = 0.21; p = 0.008), GGT (r = 0.19; p = 0.01), fasting insulin (r = 0.272; p = 0.001), and HOMA-IR (r = 0.27; p < 0.001) (Table III).
Discussion
Non-alcoholic fatty liver disease affects almost 1/3 of the general population around the world and may present an increase in cardiometabolic risk and resultant adverse cardiovascular events regardless of conventional cardiovascular risk fac-tors and the MetS. Non-alcoholic fatty liver disease is mostly indicated by IR and is closely associated
with obesity and type 2 diabetes. Non-alcoholic fatty liver disease is an indicator of pathological ectopic fat concentration with low-grade chronic
Table II. Relationship between serum ANGPTL6 level and demographic and clinical findings
Parameter Mean ± SD Median (min.–max.) P-value
Gender Female (n = 70) 963.0 ±763.3 782.7 (25.2–4319.7) 0.737 Male (n = 88) 983.6 ±704.9 756.2 (78.3–3237.1) Hypertension Absent (n = 102) 944.4 ±801.3 659.9 (25.2–4319.7) 0.053 Present (n = 56) 1029.8 ±575.8 895.5 (185.8–2896.6) MetS Absent (n = 121) 953.6 ±767.4 756.2 (25.2–4319.7) 0.136 Present (n = 37) 1041.8 ±592.8 952.5 (286.9–2896.6) IR Absent (n = 100) 862.0 ±661.3 659.9 (25.2–3147.0) 0.004 Present (n = 58) 1169.8 ±802.7 1064.7 (78.3–4319.7) Ultrasonographic steatosis grade Absent (n = 50) 988.5 ±893.7 756.2 (25.2–4319.7) 0.803 Mild (n = 33) 951.3 ±703.8 756.3 (27.9–3237.1) Moderate (n = 42) 933.5 ±607.7 772.6 (54.4–2612.8) Severe (n = 33) 1029.6 ±636.1 869.1 (286.9–2896.6)
Parameter Correlation coefficient P-value
Age [years] 0.115 0.154
BMI [kg/m²] –0.073 0.364
WC [cm] 0.003 0.971
Met S – metabolic syndrome, IR – insulin resistance, BMI – body mass index, WC – waist circumference.
Table III. Correlations between serum ANGPTL6 level and laboratory findings
Parameter Correlation coefficient P-value FBG [mg/dl] 0.189 0.018 AST [IU/l] 0.135 0.093 ALT [IU/l] 0.192 0.017 ALP [IU/l] 0.212 0.008 GGT [IU/l] 0.194 0.015 Albumin [mg/dl] 0.044 0.584 T. cholesterol [mg/dl] –0.066 0.414 LDL cholesterol [mg/dl] 0.047 0.559 HDL cholesterol [mg/dl] –0.069 0.390 TG [mg/dl] 0.064 0.431
Fasting insulin [µU/ml] 0.272 0.001
HOMA-IR 0.277 < 0.001
FBG – fasting blood glucose, AST – aspartate aminotransferase, ALT – alanine aminotransferase ALP – alkaline phosphatase, GGT – g-glutamyl transpeptidase, T. cholesterol – total cholesterol, LDL – low-density lipoprotein, HDL – high-density lipoprotein, TG – triglycerides, HOMA-IR – index of insulin resistance calculated according to the HOMA (homeostasis model assessment) method.
inflammation which leads to a number of adverse pathophysiological processes such as hypercoagu-lability, increased oxidative stress, endothelial dys-function, fatty acid and lipoprotein metabolism, abnormal glucose, accelerated progression of ath-erosclerosis, and deranged adipokine profile [12].
Non-alcoholic fatty liver disease is mostly trig-gered by one or more features of the MetS, such as central obesity, hypertension, glucose intoler-ance or diabetes, IR, and dyslipidemia [2, 13–15]. There are a few studies reporting on the metabolic importance of NAFLD in non-obese, non-diabet-ic individuals. These studies have revealed that NAFLD has a closer relationship with IR and the markers of endothelial dysfunction and oxidative stress compared to the ATP III criteria in non-di-abetic, non-obese individuals [16–18]. The liter-ature shows that serum ANGPTL2 and ANGPTL6 levels are increased in obese and diabetic patients [5, 7, 8]. Therefore, we included non-obese non-di-abetic NAFLD patients in our study, and we found a significant difference in IR, HT, and MetS pres-ence among the three groups; these findings were consistent with the findings reported in the liter-ature [18, 19].
ANGPTL2 is a protein that is secreted and reg-ulates angiogenesis similarly to several other ANGPTLs [4]. ANGPTL2 is expressed in adipose tissue in large amounts [5]. In obese mice, both ANGPTL2 mRNA levels in adipose tissue and the protein levels in the circulation are increased. In humans, the circulating levels of ANGPTL2 are also increased in obesity (especially due to visceral obesity) and are closely associated with the levels of systemic IR and inflammation, and the circulat-ing levels of ANGPTL2 are reported to decrease in parallel with body weight loss [5]. Conversely, the ANGPTL2 expressed in adipose tissue exhibits vas-cular inflammation in transgenic mice and leads to elevated macrophage infiltration in adipose tissue and increased expression of inflammatory cyto-kines, despite them being non-obese [5].
In our study, we investigated the ANGPTL2 lev-el in NAFLD since ANGPTL2 is accompanied by systemic IR and increased inflammation in adi-pose tissue and circulation, and these findings have been demonstrated to have a key role in the pathogenesis of NAFLD and MetS [2, 12]. We excluded obese patients with DM since ANGPTL2 and ANGPTL6 have been shown to be increased in diabetes and obesity [5, 7, 8]. Nevertheless, no significant difference was found among the three groups with respect to ANGPTL2 levels. Moreover, there was no significant correlation among the de-mographic, biochemical or ultrasonographic find-ings and ANGPTL2 levels among the three groups. These results may be attributed to the limited number of patients in our study or may suggest that there may be mediators other than ANGPTL2
that may have a role in IR development in non- diabetic, non-obese NAFLD patients. We consider that further studies with large-scale designs are needed to validate these findings.
ANGPTL6, also known as AGF, is a protein be-longing to the ANGPTL family that is mainly se-creted from the hepatic tissue into the systemic circulation [6]. Oike et al. demonstrated that ANGPTL6-deficient mice presented remarkable fat concentration in the skeletal muscle and liver and IR with decreased energy consumption com-pared to controls. Similarly, several other studies have shown that mice with targeted activation of ANGPTL6 exhibit elevated insulin sensitivity and leanness caused by elevated energy consump-tion. These mice are also protected from high-fat diet-induced obesity as well as non-adipose tissue steatosis and IR [6].
A recent report revealed that human ANGPTL6 concentration in the circulation is increased in obesity or diabetes and ANGPTL6 concentration has a positive correlation with the fasting serum glucose levels [8]. Similarly, Kadomatsu et al. sug-gested that ANGPTL6 resistance is likely to occur in obesity or diabetes [4]. In our study, we exclud-ed diabetic and obese patients since ANGPTL6 concentration is increased in these patients. Moreover, we found that serum ANGPTL6 levels in patients with IR were significantly higher than those without IR.
In this study, no significant difference was found among the three groups with regard to ANGPTL6 levels. Nevertheless, serum ANGPTL6 level dis-played a positive correlation with FBG, serum ALT, ALP, GGT, fasting insulin, and HOMA-IR levels. The finding indicating the presence of a close associa-tion between serum ANGPTL6 level and FBG was consistent with the association found by Ebert et al. [8]. Ebert et al. revealed that the AGF level in the circulation is elevated in patients with DM type 2 and is associated with the method used in antidiabetic treatment but is not independently associated with insulin sensitivity and secretion indices, anthropometric measurements, or several other adipokines [20]. Similarly to the study con-ducted by Ebert et al., we also found no significant correlation between serum ANGPTL6 level and an-thropometric measurements.
This study is limited in several ways. First, we used USG instead of biopsy in the diagnosis of NAFLD. USG remains the method of choice in the diagnosis of asymptomatic patients with elevated liver enzyme levels and suspected NAFLD. Nev-ertheless, USG fails to provide quantitative data regarding fat accumulation, liver inflammation, or fibrosis [21]. Another limitation is that the control group was significantly younger than the patient group. Nevertheless, this was somewhat inevitable because we applied strict exclusion criteria, and
it was not possible for us to recruit control sub-jects without diabetes, obesity, insulin resistance or hepatosteatosis who would exactly match the patient group in terms of age. Finally, our study had a relatively small sample size.
In conclusion, MetS, IR, and HT were signifi-cantly higher in non-obese, non-diabetic NAFLD patients in comparison to healthy controls. ANGPTL2 level showed no significant correla-tion with MetS, IR, HT, or ultrasonographic and biochemical findings. Serum ANGPTL6 level was found to be significantly higher in patients with IR than in patients without IR and showed a positive correlation with FBG, ALT, ALP, GGT, fasting insulin, and HOMA-IR levels. Due to our relatively small sample size, these results need to be validated in larger study populations and in different ethnic groups. Further studies with large-scale designs are needed to elucidate the effects of ANGPTL2 and ANGPTL6 in the pathogenesis of NAFLD.
Acknowledgments
This study was financially aided by Gazi Uni-versity Research Foundation (Project Number: 01/2012-14).
Conflict of interest
The authors declare no conflict of interest. R e f e r e n c e s
1. Angulo P. GI epidemiology: nonalcoholic fatty liver dis-ease. Aliment Pharmacol Ther 2007; 25: 883-9. 2. Dowman JK, Tomlinson JW, Newsome PN. Systematic
review: the diagnosis and staging of non-alcoholic fatty liver disease and non-alcoholic steatohepatitis. Aliment Pharmacol Ther 2011; 33: 525-40.
3. Kotronen A, Yki-Jarvinen H. Fatty liver. A novel compo-nent of the metabolic syndrome. Arterioscler Thromb Vasc Biol 2008; 28: 27-38.
4. Kadomatsu T, Tabata M, Oike Y. Angiopoietin-like pro-teins: emerging targets for treatment of obesity and related metabolic diseases. FEBS J 2011; 278: 559-64. 5. Tabata M, Kadomatsu T, Fukuhara S, et al.
Angiopoie-tlike protein 2 promotes chronic adipose tissue in-flammation and obesity-related systemic insulin resis-tance. Cell Metab 2009; 10: 178-88.
6. Oike Y, Akao M, Yasunaga K, et al. Angiopoietin-related growth factor antagonizes obesity and insulin resis-tance. Nat Med 2005; 11: 400-8.
7. Li Q, Gong W, Yang Z, et al. Serum Angptl2 levels are independently associated with albuminuria in type 2 di-abetes. Diabetes Res Clin Pract 2013; 100: 385-90. 8. Ebert T, Bachmann A, Lössner U, et al. Serum levels of
angiopoietin-related growth factor in diabetes mellitus and chronic hemodialysis. Metabolism 2009; 58: 547-51. 9. Grundy SM, Cleeman JI, Daniels SR, et al.; American
Heart Association; National Heart, Lung, and Blood Institute. Diagnosis and management of the metabol-ic syndrome: an Amermetabol-ican Heart Association/National Heart, Lung, and Blood Institute Scientific Statement. Circulation 2005; 112: 2735-52.
10. Gokcel A, Ozsahin AK, Sezgin N, et al. High prevalence of diabetes in Adana, a southern province of Turkey. Diabe-tes Care 2003; 26: 3031-4.
11. Saverymuttu SH, Joseph AE, Maxwell JD. Ultrasound scanning in the detection of hepatic fibrosis and steato-sis. Br Med J (Clin Res Ed) 1986; 292: 13-5.
12. Bhatia LS, Curzen NP, Calder PC, et al. Non-alcoholic fatty liver disease: a new and important cardiovascular risk factor? Eur Heart J 2012; 33: 1190-200.
13. Olufadi R, Byrne CD. Clinical and laboratory diagno-sis of the metabolic syndrome. J Clin Pathol 2008; 61: 697-706.
14. Reynolds K, He J. Epidemiology of the metabolic syn-drome. Am J Med Sci 2005; 330: 273-9.
15. Papaetis GS, Papakyriaoku P, Panagiotou TN. Central obesity, type 2 diabetes and insulin: exploring a path-way full of thrones. Arch Med Sci 2015; 11: 463-82. 16. Musso G, Gambino R, Bo S, et al. Should nonalcoholic
fatty liver disease be included in the definition of met-abolic syndrome? A cross-sectional comparison with Adult Treatment Panel III criteria in nonobese nondia-betic subjects. Diabetes Care 2008; 31: 562-8.
17. Sinn DH, Gwak GY, Park HN, et al. Ultrasonographically detected non-alcoholic fatty liver disease is an indepen-dent predictor for iindepen-dentifying patients with insulin re-sistance in non-obese, non-diabetic middle-aged Asian adults. Am J Gastroenterol 2012; 107: 561-7.
18. Kim HJ, Kim HJ, Lee KE, et al. Metabolic significance of nonalcoholic fatty liver disease in nonobese, nondiabet-ic adults. Arch Intern Med 2004; 164: 2169-75. 19. Erkan G, Sayin I, Polat FB, et al. The relationship between
insulin resistance, metabolic syndrome and non-alco-holic fatty liver disease in non-obese non-diabetic Turk-ish individuals: a pilot study. Turk J Gastroenterol 2014; 25 (Suppl. 1): 63-8.
20. Ebert T, Kralisch S, Loessner U, et al. Relationship be-tween serum levels of angiopoietin-related growth fac-tor and metabolic risk facfac-tors. Horm Metab Res 2014; 46: 685-90.
21. Wieckowska A, Feldstein AE. Diagnosis of nonalcoholic fatty liver disease: invasive versus noninvasive. Semin Liver Dis 2008; 28: 386-95.