MANAS Journal of Social Studies 2018 Vol.: 7 No: 3
ISSN: 1624-7215
ANALYSIS OF SERVICE INNOVATION PERFORMANCE IN TURKISH
BANKING SECTOR USING A COMBINING METHOD OF FUZZY
MCDM AND TEXT MINING
Assoc. Prof. Hasan DİNÇER
İstanbul Medipol University, The School of Business
[email protected]
Asst. Prof. Serhat YÜKSEL
İstanbul Medipol University, The School of Business
[email protected]
Asst. Prof. Şenol EMİR
İstanbul University, The School of Business
[email protected]
Abstract
The purpose of the study is to examine the effecting factors for new service development capabilities in Turkish banking sector and to evaluate the performance of the banks in listed BIST based on the service innovation performance. The novelty of the study is to employ a two-step analysis considering the data mining and the hybrid MCDM respectively. The method is applied by using the data mining for extracting the literature based-criteria of service innovation. Accordingly, the fuzzy AHP is computed for weighting the criteria and the fuzzy TOPSIS is considered to rank the banks based on the service innovation performance. The results demonstrate that the service conditions for the customers are the most important factor in the service innovation performance while the employees are weakly considered to evaluate the new service development. In addition, it is seen that no bank type has a clear advantage over others. In other words, there are banks with both good and bad performance outcomes within each type of banking group. However, it is determined that foreign banks and private banks took place in the worst order. In this context, in order to achieve a competitive advantage, these low performing banks should focus on new services that take into account the customer expectations.
Keywords: Banking Sector, Service Innovation, Text Mining, Fuzzy AHP, Fuzzy TOPSIS TÜRK BANKACILIK SEKTÖRÜNDEKİ HİZMET YENİLİĞİ PERFORMANSININ
METİN MADENCİLİĞİ VE BULANIK ÇOK KRİTERLİ KARAR VERME YÖNTEMLERİ İLE ANALİZİ
Özet
Bu çalışmanın amacı, Türk bankacılık sektöründeki yeni hizmet geliştirme kabiliyetlerine etki eden faktörleri incelemek ve BIST'de işlem gören bankaların performansını, hizmet yeniliğine göre değerlendirmektir. Çalışmanın yeniliği, veri madenciliği ve hibrit çok kriterli karar verme yöntemlerini birlikte dikkate alan iki aşamalı bir analiz kullanmasıdır. Literatür tabanlı hizmet geliştirme kriterleri için veri madenciliği yöntemi uygulanmıştır. Buna göre, ölçütlerin ağırlıklandırılması için bulanık AHP, bankaların hizmet yeniliği performansına göre sıralanması için ise bulanık TOPSIS yöntemlerinden faydalanılmıştır. Elde edilen sonuçlara göre,
This paper is prepared within the scope of TÜBİTAK project (116K738) named by “Comparative Analysis of Balanced Scorecard Based New Service Development Competencies with Hybrid Multi-Criteria Decision Making Methods under the Fuzzy Environment: An Application on Turkish Banking Sector”. We would like to thank to TÜBİTAK for all support.
müşterilerin en önemli boyut olduğu belirlenmiştir. Buna karşın, çalışanların ise daha düşük önem ağırlığına sahip olduğu sonucuna ulaşılmıştır. Ek olarak, herhangi bir banka türünün diğerlerine kıyasla bariz bir üstünlüğü bulunmadığı görülmüştür. Diğer bir ifadeyle, her banka türü içerisinde hem iyi hem de kötü performans sonuçlarına sahip olan bankalar bulunmaktadır. Bununla birlikte, en son sıralarda yabancı ve özel bankaların yer aldığı belirlenmiştir. Bu bağlamda, rekabetçi avantaj elde edebilmek için performansı düşük olan bu bankaların müşteri beklentilerini dikkate alan yeni hizmetler geliştirmeleri yerinde olacaktır.
Anahtar Kelimeler: Bankacılık Sektörü, Hizmet Yeniliği, Metin Madenciliği, Bulanık AHP,
Bulanık TOPSIS
1. Introduction
Especially after the globalization, competition has increased almost all over the world.
The main reason is that companies took the opportunity to enter new markets because of
disappearing economic borders among the countries (Tunay and Yüksel, 2017:1628).
Although this situation has many benefits for the consumers, it makes very hard for the
companies to increase their profitability. Therefore, it becomes necessary for the companies to
take some actions so as to survive in such a competitive environment (Yüksel, 2016:42).
Innovation and new service development are some example actions for these
companies to reach this objective (Yüksel, 2017:2). With the help of innovative thinking,
companies can have a chance to increase their efficiency. Within this framework, the concept
of new service development plays a significant role to have a competitive power. In other
words, companies should develop new services to become different in comparison with their
rivals (Eti and İnel, 2016:470; Yüksel et al., 2016:1059).
Banking sector is also a market in which there is an important increase in the
competition. Since foreign trade has an increasing trend after globalization, the significance of
the banking sector went up considerably (Dinçer et al., 2018:203; Mukhtarov et al., 2018:65).
Hence, many international banks entered into different countries. This situation has an
increasing effect on the competition in this sector. Therefore, it is obvious that banks should
develop new services to attract the attention of the consumers. Owing to this aspect, it can be
much easier for them to survive in the market (Kartal, 2017:85; Ersin and Duran, 2017:110;
Yüksel and Zengin, 2016:495).
Similar to the issues emphasized above, the aim of this study is to evaluate the
performance of Turkish banks in listed BIST based on the service innovation performance. By
using data mining methodology to the similar studies in the literature, the criteria for service
innovation are identified. Additionally, the weights of the criteria are determined with the
help of fuzzy AHP method. Moreover, fuzzy TOPSIS approach is taken into the consideration
to rank the performance of the banks.
This study consists of 5 different sections. After the introduction part, the second
section gives information about the text mining approach to multi criteria decision making.
For this purpose, some similar studies in the literature are shared. Moreover, the third section
explains fuzzy AHP and fuzzy TOPSIS methodologies. Furthermore, the fourth section
focuses on the application on Turkish banking sector. Also, in the final part, the results and
the recommendations are given.
2. Text Mining Approach to Multi Criteria Decision Making
2.1. Text Mining
Text mining is an approach for mining useful and novel patterns in textual data.
Extracting these patterns is not an easy task because in contrast to numerical data, textual data
is not structured. Hence, it must be organized in a way that is suitable for analytical methods.
For this purpose, several preprocessing steps such as tokenizing, stemming, filtering stopword
are implemented to represent textual data quantitatively.
Information retrieval includes collecting data from the data source which can be text
files, reports, sheets, blogs, web pages, or social media and store collected data in the corpus.
In preprocessing textual data transformed into numerical values. Tokenizing (breaking
sentences into words), stemming (removing suffixes such as -ing or -er and obtaining the
root), filtering stopwords (removing words that have no meaning such as “the”, “is” etc.)
operations are executed (Karatzoglou & Feinerer, 2010:290). After this step, besides methods
that are commonly used for text related tasks such as topic identification, sentiment analysis
etc., standard data mining methods that are used for classification, clustering, and prediction
can also be implemented on transformed data. Thanks to text mining that it is now possible to
analyze voluminous textual data which is both online and offline data even if they are in very
different file formats. In data model phase suitable algorithms are run for the intended task for
example topic modeling or clustering. The result can be presented visually in visualization
phase by using word clouds, histograms or correlation maps. At the final stage, interpretation
of the results is performed.
Recent years number of studies that apply text mining methods has been increased. İt
is commonly used in diverse fields especially in biochemical research, computational biology,
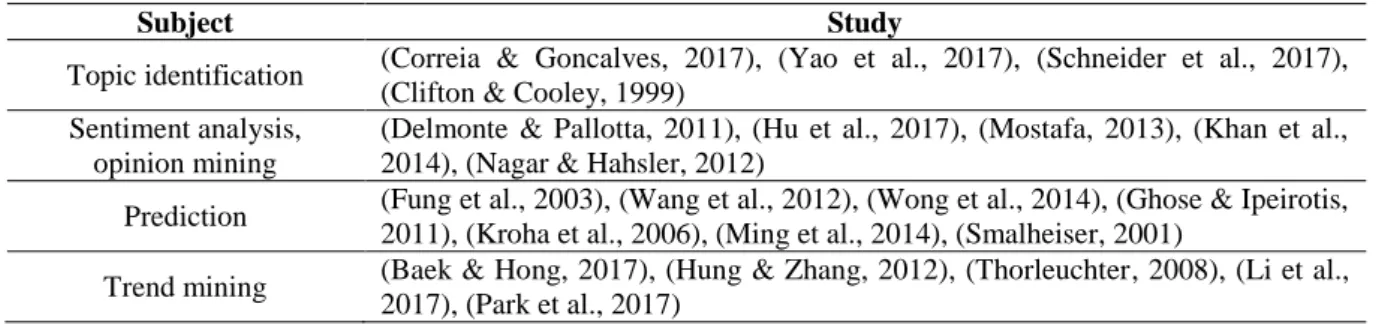
information science, engineering, business, and finance. Table 1 presents some of the studies
on the main application areas of text mining especially in finance and business domain.
Table 1. Selected studies on text mining
Subject Study
Topic identification (Correia & Goncalves, 2017), (Yao et al., 2017), (Schneider et al., 2017), (Clifton & Cooley, 1999)
Sentiment analysis, opinion mining
(Delmonte & Pallotta, 2011), (Hu et al., 2017), (Mostafa, 2013), (Khan et al., 2014), (Nagar & Hahsler, 2012)
Prediction (Fung et al., 2003), (Wang et al., 2012), (Wong et al., 2014), (Ghose & Ipeirotis, 2011), (Kroha et al., 2006), (Ming et al., 2014), (Smalheiser, 2001)
Trend mining (Baek & Hong, 2017), (Hung & Zhang, 2012), (Thorleuchter, 2008), (Li et al., 2017), (Park et al., 2017)
Text mining is also commonly used for bibliometric research namely analyzing the
literature of a specified domain and finding patterns, trends, clusters or forming a specified
dictionary for the field. For example, Delen & Crossland (2008) employed text mining to
identify clusters and trends of related research topics from three major journals in the
management information systems field. Garten & Altman (2009) developed a tool to assist in
extracting pharmacogenomic concepts from the literature (using full-text articles)
automatically. Scherf et al. (2005) used results from literature analysis in combination with
evidence from experiments and genome analysis to improve the accuracy of results. Natarajan
et al. (2006) reported that mining biological literature promises to play an increasingly
important role in biological knowledge discovery. Yu et al. (2017) inspected 7721
publications in Information Sciences from 1968 to 2016. They used text mining to find the
key contributors articles that have made a profound impact and illustrated salient patterns and
emerging trends. Moro et al. (2017) performed text mining on articles published between
1996- 2016 related to the tourism research to uncover trends and gaps in the literature.
Westergaard et al. (2018) presented the analysis results of 15 million English scientific
full-text articles published during the period 1823–2016. They described the development in
article length and publication sub-topics. They also extracted published protein-protein,
disease–gene, and protein subcellular associations.
2.2. Multi-Criteria Decision Making (MCDM)
A classical Multi-Criteria Decision Making (MCDM) approach is applied for ranking
decision alternatives based on predefined criteria. Criteria can be in conflict with each other.
The scores for each criterion and decision alternatives are obtained from domain experts
based on scales that are developed for selected MCDM method. In literature, there are
numerous different MCDM methods that have differences in their theoretical bases, areas that
they are particularly applied and the result that they produce. Some of these methods and
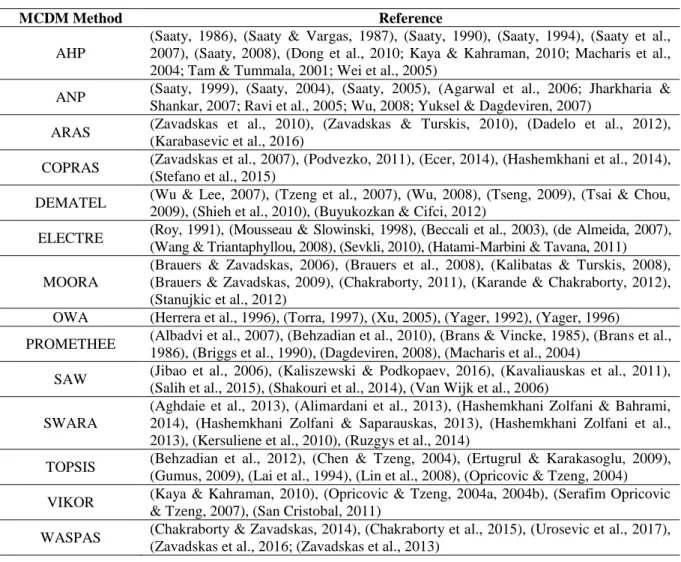
references are listed in Table 2.
Table 2. Selected methods on the MCDM
MCDM Method Reference
AHP
(Saaty, 1986), (Saaty & Vargas, 1987), (Saaty, 1990), (Saaty, 1994), (Saaty et al., 2007), (Saaty, 2008), (Dong et al., 2010; Kaya & Kahraman, 2010; Macharis et al., 2004; Tam & Tummala, 2001; Wei et al., 2005)
ANP (Saaty, 1999), (Saaty, 2004), (Saaty, 2005), (Agarwal et al., 2006; Jharkharia & Shankar, 2007; Ravi et al., 2005; Wu, 2008; Yuksel & Dagdeviren, 2007)
ARAS (Zavadskas et al., 2010), (Zavadskas & Turskis, 2010), (Dadelo et al., 2012), (Karabasevic et al., 2016)
COPRAS (Zavadskas et al., 2007), (Podvezko, 2011), (Ecer, 2014), (Hashemkhani et al., 2014), (Stefano et al., 2015)
DEMATEL (Wu & Lee, 2007), (Tzeng et al., 2007), (Wu, 2008), (Tseng, 2009), (Tsai & Chou, 2009), (Shieh et al., 2010), (Buyukozkan & Cifci, 2012)
ELECTRE (Roy, 1991), (Mousseau & Slowinski, 1998), (Beccali et al., 2003), (de Almeida, 2007), (Wang & Triantaphyllou, 2008), (Sevkli, 2010), (Hatami-Marbini & Tavana, 2011) MOORA
(Brauers & Zavadskas, 2006), (Brauers et al., 2008), (Kalibatas & Turskis, 2008), (Brauers & Zavadskas, 2009), (Chakraborty, 2011), (Karande & Chakraborty, 2012), (Stanujkic et al., 2012)
OWA (Herrera et al., 1996), (Torra, 1997), (Xu, 2005), (Yager, 1992), (Yager, 1996)
PROMETHEE (Albadvi et al., 2007), (Behzadian et al., 2010), (Brans & Vincke, 1985), (Brans et al., 1986), (Briggs et al., 1990), (Dagdeviren, 2008), (Macharis et al., 2004)
SAW (Jibao et al., 2006), (Kaliszewski & Podkopaev, 2016), (Kavaliauskas et al., 2011), (Salih et al., 2015), (Shakouri et al., 2014), (Van Wijk et al., 2006)
SWARA
(Aghdaie et al., 2013), (Alimardani et al., 2013), (Hashemkhani Zolfani & Bahrami, 2014), (Hashemkhani Zolfani & Saparauskas, 2013), (Hashemkhani Zolfani et al., 2013), (Kersuliene et al., 2010), (Ruzgys et al., 2014)
TOPSIS (Behzadian et al., 2012), (Chen & Tzeng, 2004), (Ertugrul & Karakasoglu, 2009), (Gumus, 2009), (Lai et al., 1994), (Lin et al., 2008), (Opricovic & Tzeng, 2004) VIKOR (Kaya & Kahraman, 2010), (Opricovic & Tzeng, 2004a, 2004b), (Serafim Opricovic
& Tzeng, 2007), (San Cristobal, 2011)
WASPAS (Chakraborty & Zavadskas, 2014), (Chakraborty et al., 2015), (Urosevic et al., 2017), (Zavadskas et al., 2016; (Zavadskas et al., 2013)
In this study, we applied text mining on the balanced scorecard literature to find out the
potential of text mining to extract sub-dimensions of the four dimensions of the balanced
scorecard. For this purpose, a total of 3756 scientific research abstracts were analyzed. By
inspecting automated text mining results, a group of three keywords was identified for each
dimension. These subdimensions were used to form criteria for solving the decision-making
problem. Frequencies of each subdimensions are interpreted as scores to be used for the further
steps of the analysis. Shortly, as a novel approach, criteria and scores were formed by text mining
backed literature analysis automatically instead of a classical way of utilizing expert opinion or
reviewing literature manually. In addition, results of the text mining combined with fuzzy AHP
and fuzzy TOPSIS methods to weight criteria and ranking alternatives respectively in a fuzzy
setting. In this manner, a hybrid decision making model is developed.
3. Methodology
In classical MCDM methods, experts use natural language expressions (linguistic
variables) such as “Good” or “Very Important” or “Extremely preferred” in order to convey
their subjective evaluations. Corresponding numerical values of these linguistic variables are
used for evaluation of criteria directly. However, due to the inherent uncertainty in natural
languages in addition to lack of enough information boundaries of these expressions are not
so well defined. This is a common problem in MCDM methods. For expressing linguistic
variables more appropriately, MCDM methods are occupied in fuzzy environments. Almost
for every MCDM method, there is a fuzzy variant to overcome this difficulty.
The fuzzy set theory developed by Zadeh (1965, 1976) gives the opportunity to
express linguistic variables to describe experts’ subjective judgment in a quantitative way by
using fuzzy numbers. Close interaction between fuzzy set theory and MCDM has resulted in a
new decision theory called fuzzy multi-criteria decision-making (F-MCDM) (Nădăban et al.,
2016:823). Considering benefits, F-MCDM is becoming more commonly used in literature in
spite of their computational complexities.
A usual fuzzy MCDM process flow consists of three main parts. These are
judgmental, analytical and evaluation parts. The judgmental part includes identifying
objectives, criteria or topic related to the subject of decision-making, identifying and selecting
experts, identifying and developing alternatives, weighting fuzzy criteria, defining the
hierarchy of objectives. The analytical part contains reviewing the quality of data and
information available for applying fuzzy weighting and hierarchy, selecting fuzzy
mathematical algorithms and procedures, collecting data and applying the fuzzy algorithm. In
the evaluation part reviewing data quality and criteria weighting, running several iterations,
interpreting fuzzy decision-making calculations and results, and finalizing recommendations
steps are carried out (Mardani et al., 2015:4126).
3.1. Fuzzy AHP
Saaty (1990, 1994) developed the analytic hierarchy process (AHP) to solve complex
decision-making problems. AHP uses a hierarchical structure of elements to incorporate expert’s
knowledge for the decision-making problem. Priorities for each criterion in terms of their
importance with respect to achieving objective are determined based on a scale. Similarly,
priorities form the alternatives on each criterion are derived. By using pairwise comparison of
criteria and alternatives a decision matrix is formed. To calculate the overall priorities for each
alternative based on how they help to achieve the objectives, a weighting process is employed. In
standard AHP all scores for comparisons are based on Saaty’s rating scale. However, in Fuzzy
AHP, all crisp scale values are transformed into triangular fuzzy numbers (fuzzification) so all
operations are based on these triangular fuzzy numbers. Ranking of alternatives is performed
after the defuzzification step (Özdağoğlu & Özdağoğlu, 2007:65)
Fuzzy AHP is applied in diverse fields such management, business, medicine,
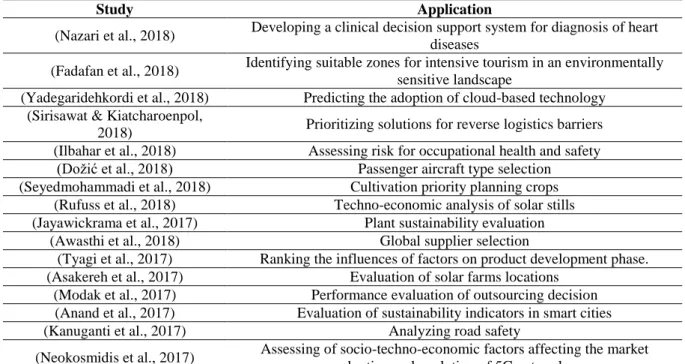
engineering, logistics, technology, tourism, and agriculture. Table 3 shows some of the most
recent studies that employed fuzzy AHP method as a tool for designing a decision-making
system.
Table 3. Selected studies on fuzzy AHP
Study Application
(Nazari et al., 2018) Developing a clinical decision support system for diagnosis of heart diseases
(Fadafan et al., 2018) Identifying suitable zones for intensive tourism in an environmentally sensitive landscape
(Yadegaridehkordi et al., 2018) Predicting the adoption of cloud-based technology (Sirisawat & Kiatcharoenpol,
2018) Prioritizing solutions for reverse logistics barriers (Ilbahar et al., 2018) Assessing risk for occupational health and safety
(Dožić et al., 2018) Passenger aircraft type selection (Seyedmohammadi et al., 2018) Cultivation priority planning crops
(Rufuss et al., 2018) Techno-economic analysis of solar stills (Jayawickrama et al., 2017) Plant sustainability evaluation
(Awasthi et al., 2018) Global supplier selection
(Tyagi et al., 2017) Ranking the influences of factors on product development phase. (Asakereh et al., 2017) Evaluation of solar farms locations
(Modak et al., 2017) Performance evaluation of outsourcing decision (Anand et al., 2017) Evaluation of sustainability indicators in smart cities
(Kanuganti et al., 2017) Analyzing road safety
(Neokosmidis et al., 2017) Assessing of socio-techno-economic factors affecting the market adoption and evolution of 5G networks
The flow of Fuzzy AHP steps are summarized as follows:
Step 1. Identifying the decision-making problem exactly and determining objectives,
criteria, and alternatives clearly.
Step 2. Transforming the complex decision-making problem into a hierarchical
structure with criteria and alternatives.
Step 3. Constructing pairwise comparisons between decision elements and so form
comparison matrices with fuzzy numbers.
To estimate the relative importance of elements pairwise comparisons are performed.
For all pairwise comparisons, triangular fuzzy numbers are used. A fuzzy number
on to
be a triangular fuzzy number if its membership function
is
The parameters of the membership function are (smallest possible value),
(the
most promising value) and (the largest possible value). The fuzzy pairwise comparison
matrix is denoted as
where
which are satisfied with
,
and
.
Triangular fuzzy numbers are helpful for capturing vagueness inherently exists in
linguistic scales that appraised by decision makers. Linguistic scales and their corresponding
Triangular Fuzzy Numbers (TFN), which are used for representing the relative importance of
criteria, are shown in Table 4.
Table 4. Linguistic variables for relative importance
Linguistic Scales Corresponding TFN (l, m, u)
Equally important (EI) (1/2, 1, 3/2) Moderately more important (MI) (1, 3/2, 2)
Strongly more important (SI) (3/2, 2, 5/2) Very strong more important (VSI) (2, 5/2, 3)
Extremely more important (EMI) (5/2, 3, 7/2)
Source: Chang, 1996:649; Lee, 2010:4941; Bozbura et. al., 2007:1100
Step 4. Using a fuzzy mathematical algorithm to build the relative weights of the
decision elements.
In literature, there exist different methods for relative weights of the decision
elements. These methods are listed in Table 5.
Table 5. Methods for computing local weights.
Method Reference
Fuzzy logarithmic least squares (Van Laarhoven and Pedrycz, 1983)
Geometric mean (Buckley, 1985)
Fuzzy extend analysis (Chang, 1996)
Fuzzy least squares priority (Xu, 2000)
Lambda-Max (Csutora and Buckley, 2001)
Fuzzy preference programming (Mikhailov, 2003)
In this study, Chang’s fuzzy extend analysis (Chang, 1996:649) which is the most
widely used of these methods is preferred. Details of the method are given below.
Let
be object set, and
be a goal set.
extent
analysis values for each object, with the following signs:
where all the
are triangular fuzzy numbers.
Step 4.1. The value of fuzzy synthetic extent with respect to the
object (
is
defined as:
For the triangular fuzzy numbers
and
fuzzy
addition, fuzzy multiplication and fuzzy inverse operators are defined
Considering these operations can be decomposed by following
Finally, can be expressed as
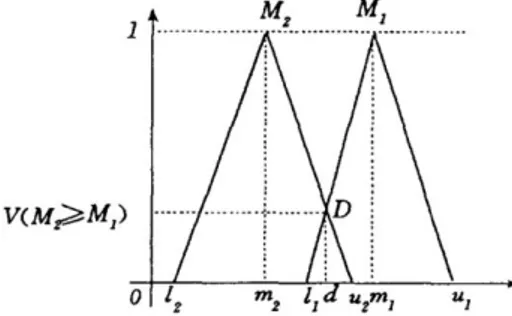
Step 4.2. The degree of possibility of
is defined as
Since
and
are convex fuzzy numbers we have
.
The degree of possibility of
is defined as
where is the ordinate of the highest intersection point between
and
and can be
Figure 2: The degree of possibility
(Chang, 1996:649)
To compare
and
, both the values of
and
is
employed.
Step 4.3. The degree of possibility for a convex fuzzy number to be greater than
convex fuzzy numbers
can be defined by
Assuming that
for
. Then the weight
vector is given by
Step 4.4. Via normalization, the normalized weight vectors are obtained.
is a nonfuzzy number.
Step 5. Consistency checking to be certain of the judgments of the decision makers are
consistent.
Step 6. Ranking the alternatives by aggregating the relative weights of decision elements.
3.2. Fuzzy TOPSIS
TOPSIS (Technique for Order Preference by Similarity to Ideal Solution) is one of
multi-criteria decision-making techniques developed by Hwang and Yoon (1981).
Alternatives are ranked by their similarity to the ideal solution. The main assumption of the
method is that the best alternative is the one that has the shortest distance from the positive
ideal solution and the furthest distance from the negative ideal solution (Aydoğan,
2011:3992). In this paper, we used fuzzy TOPSIS instead of traditional TOPSIS to be able to
model real-life problems that have uncertainty and imprecision inherently. Table 6 presents
some of the most cited studies that employ Fuzzy TOPSIS as a decision-making tool.
Table 6: Literature Review of Fuzzy TOPSIS
Study Application
(Amiri, 2010) Project selection for oil-fields development
(Buyukozkan and Cifci, 2012a) Strategic analysis of electronic service quality in the healthcare industry (Buyukozkan and Cifci, 2012b) Evaluating green suppliers
(Chu, 2002) Facility location selection
(Chu & Lin, 2003) Robot selection
(Dagdeviren et al., 2009) Weapon selection
(Ertugrul & Karakasoglu, 2009) Performance evaluation of cement firms
(Kannan et al., 2014) Green suppliers selection
(Kannan et al., 2009) Selection of reverse logistics provider
(Kaya & Kahraman, 2011) Energy planning
(Kutlu & Ekmekcioglu, 2012) Failure mode and effects analysis (Liao & Kao, 2011) Supplier selection in supply chain management (Oenuet & Soner, 2008) Transshipment site selection
(Secme et al., 2009) Performance evaluation in the banking sector
(Sun, 2010) Performance evaluation
(Taylan et al., 2014) Construction projects selection and risk assessment
(Wang et al., 2009 Supplier selection
(Yong, 2006) Plant location selection
Fuzzy TOPSIS steps are summarized below (Chen, 2000:2; Paksoy et. al., 2013:15):
Step 1. Construct fuzzy decision matrix.
denotes the fuzzy weight of
alternative for the
criterion of
expert.
is
a linguistic variable that is represented by triangular fuzzy numbers in the form of
. For a group of experts fuzzy weight of
alternative for the
criterion is
computed as:
For
alternatives
and criteria
fuzzy decision matrix
is shown as:
Step 2. Obtain the weights of criteria.
Let
denotes the fuzzy weight of
criterion according to
expert. For a group
of expert fuzzy weight of
criterion is calculated as:
represents the normalized fuzzy decision matrix formed from fuzzy
decision matrix by using:
or
Step 4. Construct the weighted normalized fuzzy decision matrix.
The weighted normalized fuzzy decision matrix is represented as
and
computed as
All the elements of
are normalized and weighted triangular fuzzy numbers that are
in [0,1] interval.
Step 5: Compute distances from fuzzy positive ideal and fuzzy negative ideal
solutions.
Fuzzy positive ideal solution and fuzzy negative ideal solution are represented by
and
respectively where
and
For each alternative distances from fuzzy positive ideal solution (
and
fuzzy negative ideal solution (
are computed respectively as follows:
and
Let
and
are two fuzzy triangular fuzzy numbers.
Then, Vertex method gives the distance as
Step 6. Compute closeness coefficient.
takes values between 0 and 1 and used for ranking alternatives. The alternative
having the maximum closeness coefficient is selected by the optimum alternative.
4. Analysis of Banking Sector
For identifying the three most important sub-dimensions for each dimension text
mining technique that is based on literature analysis is applied. For collecting data to achieve
domain analysis, search queries were executed on ScienceDirect portal. Only research articles
published after 2007 in (Business, Management and Accounting), (Decision Sciences), and
(Economics, Econometrics and Finance) subsections of ScienceDirect were taken into
consideration. Search keywords used for dimensions were "competition", "customer",
"organizational" and "financial". Abstracts of studies that resulted from each search were
ordered in relevance. Following these lists, for each dimension, a corpus that containing 939
abstracts were constructed. A total of 3756 research article abstracts were included in the
analysis. By following standard text mining steps such as transforming cases, tokenization,
filtering stopwords, stemming, generating n-grams, filtering token by the length the most
frequent keywords were determined for each dimension. Since there was the same number of
abstract for each dimension, no normalization procedure was applied on frequency results.
Resulting keywords were accepted as sub-dimensions (criteria for decision making problem).
Table 7 shows final dimensions and sub-dimensions.
Table 7. The most frequent keywords for each dimension resulting from domain analysis.
competition customer organizational financial
market price product service satisfaction value management innovation employee risk crisis growth
1145 579 484 1282 873 776 863 597 590 479 470 419
Annual reports of deposit banks that are listed in BIST-100 were collected from their
websites to analyze by text mining technique for identifying the frequency of each
sub-dimension keyword on these reports. Some of these banks had not on 2017 annual reports of
their websites so 2016 annual reports were used in the analysis. A normalization procedure is
applied because of the different sizes of annual reports. For a bank, the frequency of each
sub-dimension was divided by the frequency of most frequent sub-sub-dimension for this bank. Thus,
for each bank, the most frequent sub-dimension has the value of 1 and the others less than 1.
Resulting frequencies of sub-dimensions results are given and for gaining more
understandable scores that lie in [0, 1000] interval each score is multiplied by 1000 and
rounded to the nearest upper integer. Details of these operations are given in Table 8 and 9.
Table 8. Results of the normalized frequencies obtained from 2016 annual reports for
each bank
competition customer organizational financial
market price product service satisfaction value management innovation employee risk crisis growth S1 0,5895 0,0738 0,1940 0,3217 0,0125 0,5457 0,8811 0,0188 0,1414 1,0000 0,0038 0,0551 S2 0,3853 0,1068 0,1829 0,2591 0,0223 0,4234 0,6825 0,0102 0,1337 1,0000 0,0084 0,1031 P1 0,4624 0,1686 0,7494 0,1663 0,0501 0,4123 1,0000 0,0433 0,2483 0,6401 0,0046 0,0524 P2 0,4635 0,0527 0,1358 0,2099 0,0034 0,4961 0,5477 0,0123 0,1358 1,0000 0,0011 0,0606 P3 0,3264 0,0803 0,0903 0,1913 0,0060 0,3492 0,3946 0,0187 0,1110 1,0000 0,0033 0,0455 P4 0,4752 0,1031 0,1739 0,2912 0,0243 0,5399 0,7199 0,0374 0,1476 1,0000 0,0051 0,0708 F1 0,4327 0,0926 0,2670 0,6383 0,0258 0,3628 0,5404 0,1432 0,1421 1,0000 0,0000 0,0280 F2 0,3699 0,0881 0,1096 0,1977 0,0222 0,4885 0,4555 0,0107 0,0988 1,0000 0,0132 0,0280 F3 0,3282 0,0305 0,1145 0,2672 0,0267 0,0802 1,0000 0,0229 0,2061 0,5496 0,0000 0,0649 F4 0,3680 0,0596 0,2107 0,3021 0,0360 0,4532 0,5752 0,0554 0,1601 1,0000 0,0028 0,0603
Table 9. Results of the frequencies in [0, 1000] interval
competition customer organizational financial
market price product service satisfaction value management innovation employee Risk crisis growth S1 590 74 194 322 13 546 882 19 142 1000 4 56 S2 386 107 183 260 23 424 683 11 134 1000 9 104 P1 463 169 750 167 51 413 1000 44 249 641 5 53 P2 464 53 136 210 4 497 548 13 136 1000 2 61 P3 327 81 91 192 7 350 395 19 112 1000 4 46 P4 476 104 174 292 25 540 720 38 148 1000 6 71 F1 433 93 267 639 26 363 541 144 143 1000 0 28 F2 370 89 110 198 23 489 456 11 99 1000 14 29 F3 329 31 115 268 27 81 1000 23 207 550 0 65 F4 368 60 211 303 37 454 576 56 161 1000 3 61
For weighting the criteria using Fuzzy AHP. Initially, weights of dimensions have
been computed with the frequencies of each dimension in the data mining process and then,
linguistic evaluations have been obtained from the expert team to construct the pairwise
comparison matrices. Data mining results demonstrate that customer dimension is the most
importance factor in the balanced-scorecard perspectives while the finance is the relatively
weakest as seen in Table 10. The weights of dimensions have been considered to compute the
global weights of the criteria.
Table 10. Frequencies and weights of dimensions with data mining
Dimensions Defined Keywords Count Dimension Frequencies Weights
Finance (D1) Risk 479 1368 0.16 Crisis 470 Growth 419 Customer (D2) Service 1282 2931 0.34 Satisfaction 873 Value 776 Organization (D3) Management 863 2050 0.24 Innovation 597 Employee 590 Competition (D4) Market 1145 2208 0.26 Price 579 Product 484
Table 11. Fuzzy pair-wise comparison matrix for the criteria and weights
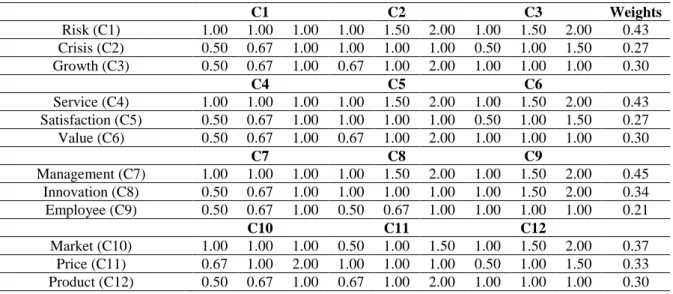
C1 C2 C3 Weights Risk (C1) 1.00 1.00 1.00 1.00 1.50 2.00 1.00 1.50 2.00 0.43 Crisis (C2) 0.50 0.67 1.00 1.00 1.00 1.00 0.50 1.00 1.50 0.27 Growth (C3) 0.50 0.67 1.00 0.67 1.00 2.00 1.00 1.00 1.00 0.30 C4 C5 C6 Service (C4) 1.00 1.00 1.00 1.00 1.50 2.00 1.00 1.50 2.00 0.43 Satisfaction (C5) 0.50 0.67 1.00 1.00 1.00 1.00 0.50 1.00 1.50 0.27 Value (C6) 0.50 0.67 1.00 0.67 1.00 2.00 1.00 1.00 1.00 0.30 C7 C8 C9 Management (C7) 1.00 1.00 1.00 1.00 1.50 2.00 1.00 1.50 2.00 0.45 Innovation (C8) 0.50 0.67 1.00 1.00 1.00 1.00 1.00 1.50 2.00 0.34 Employee (C9) 0.50 0.67 1.00 0.50 0.67 1.00 1.00 1.00 1.00 0.21 C10 C11 C12 Market (C10) 1.00 1.00 1.00 0.50 1.00 1.50 1.00 1.50 2.00 0.37 Price (C11) 0.67 1.00 2.00 1.00 1.00 1.00 0.50 1.00 1.50 0.33 Product (C12) 0.50 0.67 1.00 0.67 1.00 2.00 1.00 1.00 1.00 0.30After the pairwise comparison matrices of the criteria, the local weights of the criteria
have been computed as seen in Table 12.
Table 12. Local and Global weights of new service development factors
Dimensions Dimension Weights Criteria Local Weights Global Weights
Finance (D1) 0.16 Risk (C1) 0.43 0.069 Crisis (C2) 0.27 0.044 Growth (C3) 0.30 0.047 Customer (D2) 0.34 Service (C4) 0.43 0.147 Satisfaction (C5) 0.27 0.094 Value (C6) 0.30 0.102 Organization (D3) 0.24 Management (C7) 0.45 0.108 Innovation (C8) 0.34 0.082 Employee (C9) 0.21 0.050 Competition (D4) 0.26 Market (C10) 0.37 0.095 Price (C11) 0.33 0.085 Product (C12) 0.30 0.077
The weights of the new service development factors are shown in Table 12 and the
global weights illustrate that the service is the most important criteria in the balanced
scorecard-based factors of new service development. This result is also underlined in many
different studies in the literature (Lin et al., 2008; Cui and Wu, 2017; Romano et al., 2017).
On the other side, employee factor has the weakest importance in comparison with the others.
Table 13. Weighted normalized fuzzy decision matrix
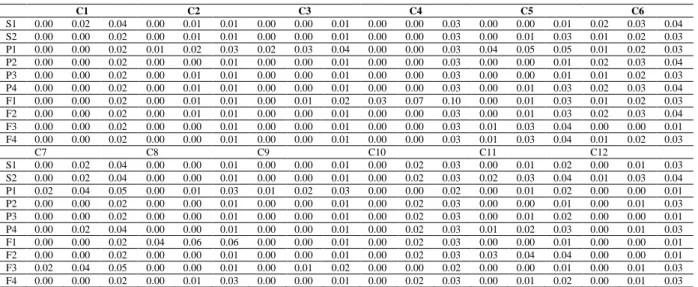
C1 C2 C3 C4 C5 C6 S1 0.00 0.02 0.04 0.00 0.01 0.01 0.00 0.00 0.01 0.00 0.00 0.03 0.00 0.00 0.01 0.02 0.03 0.04 S2 0.00 0.00 0.02 0.00 0.01 0.01 0.00 0.00 0.01 0.00 0.00 0.03 0.00 0.01 0.03 0.01 0.02 0.03 P1 0.00 0.00 0.02 0.01 0.02 0.03 0.02 0.03 0.04 0.00 0.00 0.03 0.04 0.05 0.05 0.01 0.02 0.03 P2 0.00 0.00 0.02 0.00 0.00 0.01 0.00 0.00 0.01 0.00 0.00 0.03 0.00 0.00 0.01 0.02 0.03 0.04 P3 0.00 0.00 0.02 0.00 0.01 0.01 0.00 0.00 0.01 0.00 0.00 0.03 0.00 0.00 0.01 0.01 0.02 0.03 P4 0.00 0.00 0.02 0.00 0.01 0.01 0.00 0.00 0.01 0.00 0.00 0.03 0.00 0.01 0.03 0.02 0.03 0.04 F1 0.00 0.00 0.02 0.00 0.01 0.01 0.00 0.01 0.02 0.03 0.07 0.10 0.00 0.01 0.03 0.01 0.02 0.03 F2 0.00 0.00 0.02 0.00 0.01 0.01 0.00 0.00 0.01 0.00 0.00 0.03 0.00 0.01 0.03 0.02 0.03 0.04 F3 0.00 0.00 0.02 0.00 0.00 0.01 0.00 0.00 0.01 0.00 0.00 0.03 0.01 0.03 0.04 0.00 0.00 0.01 F4 0.00 0.00 0.02 0.00 0.00 0.01 0.00 0.00 0.01 0.00 0.00 0.03 0.01 0.03 0.04 0.01 0.02 0.03 C7 C8 C9 C10 C11 C12 S1 0.00 0.02 0.04 0.00 0.00 0.01 0.00 0.00 0.01 0.00 0.02 0.03 0.00 0.01 0.02 0.00 0.01 0.03 S2 0.00 0.02 0.04 0.00 0.00 0.01 0.00 0.00 0.01 0.00 0.02 0.03 0.02 0.03 0.04 0.01 0.03 0.04 P1 0.02 0.04 0.05 0.00 0.01 0.03 0.01 0.02 0.03 0.00 0.00 0.02 0.00 0.01 0.02 0.00 0.00 0.01 P2 0.00 0.00 0.02 0.00 0.00 0.01 0.00 0.00 0.01 0.00 0.02 0.03 0.00 0.00 0.01 0.00 0.01 0.03 P3 0.00 0.00 0.02 0.00 0.00 0.01 0.00 0.00 0.01 0.00 0.02 0.03 0.00 0.01 0.02 0.00 0.00 0.01 P4 0.00 0.02 0.04 0.00 0.00 0.01 0.00 0.00 0.01 0.00 0.02 0.03 0.01 0.02 0.03 0.00 0.01 0.03 F1 0.00 0.00 0.02 0.04 0.06 0.06 0.00 0.00 0.01 0.00 0.02 0.03 0.00 0.00 0.01 0.00 0.00 0.01 F2 0.00 0.00 0.02 0.00 0.00 0.01 0.00 0.00 0.01 0.00 0.02 0.03 0.03 0.04 0.04 0.00 0.00 0.01 F3 0.02 0.04 0.05 0.00 0.00 0.01 0.00 0.01 0.02 0.00 0.00 0.02 0.00 0.00 0.01 0.00 0.01 0.03 F4 0.00 0.00 0.02 0.00 0.01 0.03 0.00 0.00 0.01 0.00 0.02 0.03 0.00 0.01 0.02 0.00 0.01 0.03Table 13 represents the weighted values of normalized decision matrix using the
results of the fuzzy AHP. Table 14 shows the distances of each alternative from the positive
and negative ideal solution as well as the values of the closeness coefficient.
Table 14. Ranking Results with Fuzzy TOPSIS
D+ D- Cci Ranking S1 11.859 0.187 0.0155 5 S2 11.838 0.205 0.0170 3 P1 11.775 0.261 0.0217 1 P2 11.896 0.148 0.0123 9 P3 11.903 0.142 0.0118 10 P4 11.853 0.192 0.0160 4 F1 11.789 0.250 0.0208 2 F2 11.855 0.186 0.0155 6 F3 11.874 0.168 0.0140 8 F4 11.867 0.177 0.0147 7
Ranking results demonstrate that P1 is the best bank in the balanced scorecard-based
new service development evaluations while P3 has the worst rank in the list. However, state
owned banks are listed in the third and fifth seats and foreign banks are in the second, sixth,
seventh, and eighth ranks. These results show that the best and worst performed banks are
owned by the private sector.
Moreover, it can be seen that no bank type has a clear advantage over others. In other
words, there are banks with both good and bad performance outcomes within each type of
banking group. However, it is determined that foreign banks and private banks took place in the
worst order. In this context, in order to achieve a competitive advantage, these low performing
banks should focus on new services that take into account the customer expectations. Yüksel et al.
(2017) also underlined the importance of the same issue in their study.
5. Discussions and Conclusions
With the effect of globalization, the competition in banking sector increased
significantly. Because banks play a significant role in foreign trade, a lot of international
banks entered to many different countries to increase their profitability (Oktar and Yüksel,
2016:31; Yüksel and Özsarı, 2017:16). Therefore, it can be said that banks must take
necessary actions to increase their competitive power. Otherwise, it may be impossible for
these countries to survive in this environment (Kartal et al., 2018:209). Generating new
services is a way of increasing competitive advantage because with the help of innovative
services, banks can attract the attention of the consumers (Terzioğlu, 2018:155; Girgin,
2018:621).
The aim of this study is to evaluate the performance of Turkish deposit banks with
respect to the service innovation performance. Within this context, by using content data
mining approach, similar studies in the literature are searched and the criteria for service
innovation are identified. In addition to this situation, by using fuzzy AHP method, the
weights of the criteria are determined. Furthermore, fuzzy TOPSIS approach is used to rank
the performance of these deposit banks.
As a result, it is defined that customer is the most important dimension whereas
finance has the least significance in comparison with the others. Additionally, service is
defined as the most important criterion, but crisis and growth have the lowest weights.
Moreover, it is determined that a private bank has the highest performance. Also, a foreign
bank is on the second rank and a state bank has the third highest performance. Furthermore,
two different private banks have the lowest performance.
While considering the results of this study, it is understood that no bank type has a
clear advantage over others. That is to say, there are banks with both good and bad
performance outcomes within each type of banking group. Nevertheless, it is defined that the
banks, which have the lowest performance, are the foreign banks and private banks. Within
this framework, with respect to the strategic policy, it is recommended that the low
performing banks should focus on new services that consider the customer expectations to
have a competitive advantage. By focusing on this important topic for banking sector, it is
aimed to make contribution to the literature. However, it is also believed that a new study
considering banking sectors in different countries at the same time will also very beneficial.
References
Agarwal, A., Shankar, R., & Tiwari, M. K. (2006). Modeling the metrics of lean, leagile and agile supply chain: An ANP-based approach. European Journal of Operational Research, 173(1), 211–225. https://doi.org/10.1016/j.ejor.2004.12.005
Aghdaie, M. H., Hashemkhani Zolfani, S., & Zavadskas, E. K. (2013). Decision Making in Machine Tool Selection: An Integrated Approach with SWARA and COPRAS-G Methods. Inzinerine Ekonomika-Engineering Economics, 24(1), 5–17. https://doi.org/10.5755/j01.ee.24.1.2822
Albadvi, A., Chaharsooghi, S. K., & Esfahanipour, A. (2007). Decision making in stock trading: An application of PROMETHEE. European Journal of Operational Research, 177(2), 673–683. https://doi.org/10.1016/j.ejor.2005.11.022
Alimardani, M., Hashemkhani Zolfani, S., Aghdaie, M. H., & Tamosaitiene, J. (2013). A Novel Hybrid Swara and Vikor Methodology for Supplier Selection in an Agile Environment. Technological and Economic Development of Economy, 19(3), 533–548. https://doi.org/10.3846/20294913.2013.814606
Amiri, M. P. (2010). Project selection for oil-fields development by using the AHP and fuzzy TOPSIS methods. Expert Systems with Applications, 37(9), 6218–6224. https://doi.org/10.1016/j.eswa.2010.02.103 Anand, A., Rufuss, D. D. W., Rajkumar, V., & Suganthi, L. (2017). Evaluation of Sustainability Indicators in
Smart Cities for India Using MCDM Approach. Energy Procedia, 141, 211–215. https://doi.org/10.1016/j.egypro.2017.11.094
Asakereh, A., Soleymani, M., & Sheikhdavoodi, M. J. (2017). A GIS-based Fuzzy-AHP method for the evaluation of solar farms locations: Case study in Khuzestan province, Iran. Solar Energy, 155, 342– 353. https://doi.org/10.1016/j.solener.2017.05.075
Awasthi, A., Govindan, K., & Gold, S. (2018). Multi-tier sustainable global supplier selection using a fuzzy AHP-VIKOR based approach. International Journal of Production Economics, 195, 106–117. https://doi.org/10.1016/j.ijpe.2017.10.013
Aydogan, E. K. (2011). Performance measurement model for Turkish aviation firms using the rough-AHP and TOPSIS methods under fuzzy environment. Expert Systems with Applications, 38(4), 3992–3998. https://doi.org/10.1016/j.eswa.2010.09.060
Baek, S.-C., & Hong, W.-H. (2017). Exploring convergence research trends of spatial information based on UAV using text mining technique. Spatial Information Research, 25(2), 315–322. https://doi.org/10.1007/s41324-017-0095-5
Beccali, M., Cellura, M., & Mistretta, M. (2003). Decision-making in energy planning. Application of the Electre method at regional level for the diffusion of renewable energy technology. Renewable Energy, 28(13), 2063–2087. https://doi.org/10.1016/S0960-1481(03)00102-2
Behzadian, M., Kazemadeh, R. B., Albadvi, A., & Aghdasi, M. (2010). PROMETHEE: A comprehensive literature review on methodologies and applications. European Journal of Operational Research, 200(1), 198–215. https://doi.org/10.1016/j.ejor.2009.01.021
Behzadian, M., Otaghsara, S. K., Yazdani, M., & Ignatius, J. (2012). A state-of the-art survey of TOPSIS applications. Expert Systems with Applications, 39(17), 13051–13069. https://doi.org/10.1016/j.eswa.2012.05.056
Bozbura, F. Tunc, B., & Kahraman, C. (2007). Prioritization of human capital measurement indicators using
fuzzy AHP. Expert Systems with Applications, 32, 1100–1112.
http://dx.doi.org/10.1016/j.eswa.2006.02.006
Brans, J., & Vincke, P. (1985). A Preference Ranking Organization Method - (the Promethee Method for Multiple Criteria Decision-Making). Management Science, 31(6), 647–656. https://doi.org/10.1287/mnsc.31.6.647
Brans, J., Vincke, P., & Mareschal, B. (1986). How to Select and How to Rank Projects - the Promethee Method. European Journal of Operational Research, 24(2), 228–238. https://doi.org/10.1016/0377-2217(86)90044-5
Brauers, W. K. M., & Zavadskas, E. K. (2006). The MOORA method and its application to privatization in a transition economy. Control and Cybernetics, 35(2), 445–469.
Brauers, W. K. M., Zavadskas, E. K., Turskis, Z., & Vilutiene, T. (2008). Multi-Objective Contractor’s Ranking by Applying the Moora Method. Journal of Business Economics and Management, 9(4), 245–255. https://doi.org/10.3846/1611-1699.2008.9.245-255
Brauers, W. K., & Zavadskas, E. K. (2009). Robustness of the Multi-Objective Moora Method with a Test for the Facilities Sector. Technological and Economic Development of Economy, 15(2), 352–375. https://doi.org/10.3846/1392-8619.2009.15.352-375
Briggs, T., Kunsch, P., & Mareschal, B. (1990). Nuclear Waste Management - an Application of the Multicriteria Promethee Methods. European Journal of Operational Research, 44(1), 1–10. https://doi.org/10.1016/0377-2217(90)90308-X
Buyukozkan, G., & Cifci, G. (2012). A novel hybrid MCDM approach based on fuzzy DEMATEL, fuzzy ANP and fuzzy TOPSIS to evaluate green suppliers. Expert Systems with Applications, 39(3), 3000–3011. https://doi.org/10.1016/j.eswa.2011.08.162
Buyukozkan, G., & Cifci, G. (2012a). A combined fuzzy AHP and fuzzy TOPSIS based strategic analysis of electronic service quality in healthcare industry. Expert Systems with Applications, 39(3), 2341–2354. https://doi.org/10.1016/j.eswa.2011.08.061
Buyukozkan, G., & Cifci, G. (2012b). A novel hybrid MCDM approach based on fuzzy DEMATEL, fuzzy ANP and fuzzy TOPSIS to evaluate green suppliers. Expert Systems with Applications, 39(3), 3000–3011. https://doi.org/10.1016/j.eswa.2011.08.162
Chakraborty, S. (2011). Applications of the MOORA method for decision making in manufacturing environment. International Journal of Advanced Manufacturing Technology, 54(9–12), 1155–1166. https://doi.org/10.1007/s00170-010-2972-0
Chakraborty, S., & Zavadskas, E. K. (2014). Applications of WASPAS Method in Manufacturing Decision Making. Informatica, 25(1), 1–20. https://doi.org/10.15388/Informatica.2014.01
Chakraborty, S., Zavadskas, E. K., & Antucheviciene, J. (2015). Applications of Waspas Method as a Multi-Criteria Decision-Making Tool. Economic Computation and Economic Cybernetics Studies and Research, 49(1), 5–22.
Chang, D.-Y. (1996). Applications of the extent analysis method on fuzzy AHP. European Journal of Operational Research, 95(3), 649–655.
Chen, C.T. (2000). Extensions of the TOPSIS for group decision-making under fuzzy environment. Fuzzy Sets and Systems, 114(1), 1–9. http://dx.doi.org/10.1016/S0165-0114(97)00377-1.
Chen, M. F., & Tzeng, G. H. (2004). Combining grey relation and TOPSIS concepts for selecting an expatriate host country. Mathematical and Computer Modelling, 40(13), 1473–1490. https://doi.org/10.1016/j.mcm.2005.01.006
Chu, T. C. (2002a). Facility location selection using fuzzy TOPSIS under group decisions. International Journal of Uncertainty Fuzziness and Knowledge-Based Systems, 10(6), 687–701. https://doi.org/10.1142/S0218488502001739
Chu, T. C., & Lin, Y. C. (2003). A fuzzy TOPSIS method for robot selection. International Journal of Advanced Manufacturing Technology, 21(4), 284–290. https://doi.org/10.1007/s001700300033
Clifton, C., & Cooley, R. (1999). TopCat: Data mining for topic identification in a text corpus. In J. M. Zytkow & J. Rauch (Eds.), Principles of Data Mining and Knowledge Discovery (Vol. 1704, pp. 174–183). Berlin: Springer-Verlag Berlin.
Correia, A., & Goncalves, A. (2017). Topics Discovery in Text Mining. In A. Rocha, A. M. Correia, H. Adeli, L. P. Reis, & S. Costanzo (Eds.), Recent Advances in Information Systems and Technologies, Vol 1 (Vol. 569, pp. 251–256). Berlin: Springer-Verlag Berlin.
Csutora, R. & Buckley, J. J. (2001). Fuzzy hierarchical analysis: The Lambda-Max method. Fuzzy Sets and Systems, vol. 120, pp. 181-195
Cui, A. S., & Wu, F. (2017). The impact of customer involvement on new product development: Contingent and substitutive effects. Journal of Product Innovation Management, 34(1), 60-80.
Dadelo, S., Turskis, Z., Zavadskas, E. K., & Dadeliene, R. (2012). Multiple Criteria Assessment of Elite Security Personal on the Basis of Aras and Expert Methods. Economic Computation and Economic Cybernetics Studies and Research, 46(4), 65–87.
Dagdeviren, M. (2008). Decision making in equipment selection: an integrated approach with AHP and PROMETHEE. Journal of Intelligent Manufacturing, 19(4), 397–406. https://doi.org/10.1007/s10845-008-0091-7
Dagdeviren, M., Yavuz, S., & Kilinc, N. (2009). Weapon selection using the AHP and TOPSIS methods under fuzzy environment. Expert Systems with Applications, 36(4), 8143–8151. https://doi.org/10.1016/j.eswa.2008.10.016
de Almeida, A. T. (2007). Multicriteria decision model for outsourcing contracts selection based on utility function and ELECTRE method. Computers & Operations Research, 34(12), 3569–3574. https://doi.org/10.1016/j.cor.2006.01.003
Delen, D., & Crossland, M. D. (2008). Seeding the survey and analysis of research literature with text mining. Expert Systems with Applications, 34(3), 1707–1720. https://doi.org/10.1016/j.eswa.2007.01.035 Delmonte, R., & Pallotta, V. (2011). Opinion Mining and Sentiment Analysis Need Text Understanding. In V.
Pallotta, A. Soro, & E. Vargiu (Eds.), Advances in Distributed Agent-Based Retrieval Tools (Vol. 361, pp. 81-+). Berlin: Springer-Verlag Berlin.
Dinçer, H., Yuksel, S., & Adalı, Z. (2018). Relationship Between Non-Performing Loans, Industry, and Economic Growth of the African Economies and Policy Recommendations for Global Growth. In
Dong, Y., Zhang, G., Hong, W.-C., & Xu, Y. (2010). Consensus models for AHP group decision making under row geometric mean prioritization method. Decision Support Systems, 49(3), 281–289. https://doi.org/10.1016/j.dss.2010.03.003
Dožić, S., Lutovac, T., & Kalić, M. (2018). Fuzzy AHP approach to passenger aircraft type selection. Journal of Air Transport Management, 68, 165–175. https://doi.org/10.1016/j.jairtraman.2017.08.003
Ecer, F. (2014). A hybrid banking websites quality evaluation model using AHP and COPRAS-G: a Turkey case. Technological and Economic Development of Economy, 20(4), 758–782. https://doi.org/10.3846/20294913.2014.915596
Ersin, İ., & Duran, S. (2017). Faizsiz Finans Döngüsünü Oluşturma Açısından Adil Ekonomik Düzen Söyleminin Kredileşme İlkeleri ve Uygulanabilirliğinin Değerlendirilmesi. Electronic Turkish Studies, 12(8), 109-132.
Ertugrul, I., & Karakasoglu, N. (2009). Performance evaluation of Turkish cement firms with fuzzy analytic hierarchy process and TOPSIS methods. Expert Systems with Applications, 36(1), 702–715. https://doi.org/10.1016/j.eswa.2007.10.014
Ertugrul, I., & Karakasoglu, N. (2009). Performance evaluation of Turkish cement firms with fuzzy analytic hierarchy process and TOPSIS methods. Expert Systems with Applications, 36(1), 702–715. https://doi.org/10.1016/j.eswa.2007.10.014
Eti, S., & İnel, M. N. (2016). A Research on Comparison of Regression Models Explaining the Profitability Base on Financial Data. International Journal of Business and Management, 4(10), 470-475.
Fadafan, F. K., Danehkar, A., & Pourebrahim, S. (2018). Developing a non-compensatory approach to identify suitable zones for intensive tourism in an environmentally sensitive landscape. Ecological Indicators, 87, 152–166. https://doi.org/10.1016/j.ecolind.2017.11.066
Fung, G. P. C., Yu, J. X., & Lam, W. (2003). Stock prediction: Integrating text mining approach using real-time news. New York: Ieee.
Garten, Y., & Altman, R. B. (2009). Pharmspresso: a text mining tool for extraction of pharmacogenomic concepts and relationships from full text. Bmc Bioinformatics, 10, S6. https://doi.org/10.1186/1471-2105-10-S2-S6
Ghose, A., & Ipeirotis, P. G. (2011). Estimating the Helpfulness and Economic Impact of Product Reviews: Mining Text and Reviewer Characteristics. Ieee Transactions on Knowledge and Data Engineering, 23(10), 1498–1512. https://doi.org/10.1109/TKDE.2010.188
Girgin, G. K. (2018). Tüketicilerin Ramazan Ayinda Televizyonlardaki Yiyecek-İçecek Reklamlarina Yönelik Görüşlerinin Belirlenmesi. Kırgızistan-Türkiye Manas Üniversitesi, 7(2), 621-635.
Gumus, A. T. (2009). Evaluation of hazardous waste transportation firms by using a two step fuzzy-AHP and TOPSIS methodology. Expert Systems with Applications, 36(2), 4067–4074. https://doi.org/10.1016/j.eswa.2008.03.013
Hashemkhani Zolfani, S., & Bahrami, M. (2014). Investment prioritizing in high tech industries based on SWARA-COPRAS approach. Technological and Economic Development of Economy, 20(3), 534–553. https://doi.org/10.3846/20294913.2014.881435
Hashemkhani Zolfani, S., & Bahrami, M. (2014). Investment prioritizing in high tech industries based on SWARA-COPRAS approach. Technological and Economic Development of Economy, 20(3), 534–553. https://doi.org/10.3846/20294913.2014.881435
Hashemkhani Zolfani, S., & Saparauskas, J. (2013). New Application of SWARA Method in Prioritizing Sustainability Assessment Indicators of Energy System. Inzinerine Ekonomika-Engineering Economics, 24(5), 408–414. https://doi.org/10.5755/j01.ee.24.5.4526
Hashemkhani Zolfani, S., Zavadskas, E. K., & Turskis, Z. (2013). Design of Products with Both International and Local Perspectives Based. Ekonomska Istrazivanja-Economic Research, 26(2), 153–166.
Hatami-Marbini, A., & Tavana, M. (2011). An extension of the Electre I method for group decision-making under a fuzzy environment. Omega-International Journal of Management Science, 39(4), 373–386. https://doi.org/10.1016/j.omega.2010.09.001
Herrera, F., Herrera-Viedma, E., & Verdegay, J. L. (1996). Direct approach processes in group decision making using linguistic OWA operators. Fuzzy Sets and Systems, 79(2), 175–190. https://doi.org/10.1016/0165-0114(95)00162-X
Hu, Y.-H., Chen, Y.-L., & Chou, H.-L. (2017). Opinion mining from online hotel reviews - A text summarization approach. Information Processing & Management, 53(2), 436–449. https://doi.org/10.1016/j.ipm.2016.12.002
Hung, J.-L., & Zhang, K. (2012). Examining mobile learning trends 2003-2008: a categorical meta-trend analysis using text mining techniques. Journal of Computing in Higher Education, 24(1), 1–17. https://doi.org/10.1007/s12528-011-9044-9
Ilbahar, E., Karaşan, A., Cebi, S., & Kahraman, C. (2018). A novel approach to risk assessment for occupational health and safety using Pythagorean fuzzy AHP & fuzzy inference system. Safety Science, 103, 124– 136. https://doi.org/10.1016/j.ssci.2017.10.025
Jayawickrama, H. M. M. M., Kulatunga, A. K., & Mathavan, S. (2017). Fuzzy AHP based Plant Sustainability Evaluation Method. Procedia Manufacturing, 8, 571–578. https://doi.org/10.1016/j.promfg.2017.02.073 Jharkharia, S., & Shankar, R. (2007). Selection of logistics service provider: An analytic network process (ANP) approach. Omega-International Journal of Management Science, 35(3), 274–289. https://doi.org/10.1016/j.omega.2005.06.005
Jibao, L., Huiqiang, W., & Liang, Z. (2006). Study of network security situation awareness model based on simple additive weight and grey theory. (Y. M. Cheung, Y. Wang, & H. Lium, Eds.). New York: Ieee. Kalibatas, D., & Turskis, Z. (2008). Multicriteria evaluation of inner climate by using MOORA method.
Information Technology and Control, 37(1), 79–83.
Kaliszewski, I., & Podkopaev, D. (2016). Simple additive weighting-A metamodel for multiple criteria decision analysis methods. Expert Systems with Applications, 54, 155–161. https://doi.org/10.1016/j.eswa.2016.01.042
Kannan, D., Lopes de Sousa Jabbour, A. B., & Chiappetta Jabbour, C. J. (2014). Selecting green suppliers based on GSCM practices: Using fuzzy TOPSIS applied to a Brazilian electronics company. European Journal of Operational Research, 233(2), 432–447. https://doi.org/10.1016/j.ejor.2013.07.023
Kannan, G., Pokharel, S., & Kumar, P. S. (2009). A hybrid approach using ISM and fuzzy TOPSIS for the selection of reverse logistics provider. Resources Conservation and Recycling, 54(1), 28–36. https://doi.org/10.1016/j.resconrec.2009.06.004
Kanuganti, S., Agarwala, R., Dutta, B., Bhanegaonkar, P. N., Singh, A. P., & Sarkar, A. K. (2017). Road safety analysis using multi criteria approach: A case study in India. Transportation Research Procedia, 25, 4649–4661. https://doi.org/10.1016/j.trpro.2017.05.299
Karabasevic, D., Zavadskas, E. K., Turskis, Z., & Stanujkic, D. (2016). The Framework for the Selection of Personnel Based on the SWARA and ARAS Methods Under Uncertainties. Informatica, 27(1), 49–65. https://doi.org/10.15388/Informatica.2016.76
Karande, P., & Chakraborty, S. (2012). Application of multi-objective optimization on the basis of ratio analysis (MOORA) method for materials selection. Materials & Design, 37, 317–324. https://doi.org/10.1016/j.matdes.2012.01.013
Karatzoglou, A., & Feinerer, I. (2010). Kernel-based machine learning for fast text mining in R. Computational Statistics & Data Analysis, 54(2), 290–297. https://doi.org/10.1016/j.csda.2009.09.023
Kartal, M. T. (2017). Türk Bankacılık Sektöründe Müşteri Şikâyetleri Yönetimi Üzerine Bir Değerlendirme.
İstanbul Üniversitesi İşletme İktisadı Enstitüsü Dergisi, 28(83), 85-108.
Kartal, M. T., Depren, S. K., & Depren, Ö. (2018). Türkiye’de Döviz Kurlarini Etkileyen Makroekonomik Göstergelerin Belirlenmesi: Mars Yöntemi İle Bir İnceleme. Kırgızistan-Türkiye Manas Üniversitesi, 7(1), 209-229.
Kavaliauskas, M., Deltuvas, R., & Cinga, G. (2011). Simple Additive Weighting Approach to Score the State Forest Enterprises in Lithuania. In Rural Development in Global Changes, Vol 5, Book 2 (Vol. 5, pp. 34–40). Akademija: Aleksandras Stulginskis University.
Kaya, T., & Kahraman, C. (2010). Multicriteria renewable energy planning using an integrated fuzzy VIKOR & AHP methodology: The case of Istanbul. Energy, 35(6), 2517–2527. https://doi.org/10.1016/j.energy.2010.02.051
Kaya, T., & Kahraman, C. (2010). Multicriteria renewable energy planning using an integrated fuzzy VIKOR & AHP methodology: The case of Istanbul. Energy, 35(6), 2517–2527. https://doi.org/10.1016/j.energy.2010.02.051
Kaya, T., & Kahraman, C. (2011). Multicriteria decision making in energy planning using a modified fuzzy TOPSIS methodology. Expert Systems with Applications, 38(6), 6577–6585. https://doi.org/10.1016/j.eswa.2010.11.081
Kersuliene, V., Zavadskas, E. K., & Turskis, Z. (2010). Selection of Rational Dispute Resolution Method by Applying New Step-Wise Weight Assessment Ratio Analysis (swara). Journal of Business Economics and Management, 11(2), 243–258. https://doi.org/10.3846/jbem.2010.12
Khan, K., Baharudin, B., Khan, A., & Ullah, A. (2014). Mining opinion components from unstructured reviews: A review. Journal of King Saud University - Computer and Information Sciences, 26(3), 258–275. https://doi.org/10.1016/j.jksuci.2014.03.009
Kroha, P., Baeza-Yates, R., & Krellner, B. (2006). Text mining of business news for forecasting. In Seventeenth International Conference on Database and Expert Systems Applications, Proceedings (pp. 171-+). Los Alamitos: Ieee Computer Soc.
Kutlu, A. C., & Ekmekcioglu, M. (2012). Fuzzy failure modes and effects analysis by using fuzzy TOPSIS-based fuzzy AHP. Expert Systems with Applications, 39(1), 61–67. https://doi.org/10.1016/j.eswa.2011.06.044
Lai, Y., Liu, T., & Hwang, C. (1994). Topsis for Modm. European Journal of Operational Research, 76(3), 486– 500. https://doi.org/10.1016/0377-2217(94)90282-8
Lee, S. (2010). Using fuzzy AHP to develop intellectual capital evaluation model for assessing their performance contribution in a university. Expert Systems with Applications, 37, 4941–4947. http://dx.doi.org/10.1016/j.eswa.2009.12.020
Li, G., Dai, J. S., Park, E.-M., & Park, S.-T. (2017). A study on the service and trend of Fintech security based on text-mining: focused on the data of Korean online news. Journal of Computer Virology and Hacking Techniques, 13(4), 249–255. https://doi.org/10.1007/s11416-016-0288-9
Liao, C.-N., & Kao, H.-P. (2011). An integrated fuzzy TOPSIS and MCGP approach to supplier selection in supply chain management. Expert Systems with Applications, 38(9), 10803–10811. https://doi.org/10.1016/j.eswa.2011.02.031
Lin, M.-C., Wang, C.-C., Chen, M.-S., & Chang, C. A. (2008). Using AHP and TOPSIS approaches in customer-driven product design process. Computers in Industry, 59(1), 17–31. https://doi.org/10.1016/j.compind.2007.05.013
Macharis, C., Springael, J., De Brucker, K., & Verbeke, A. (2004). PROMETHEE and AHP: The design of operational synergies in multicriteria analysis. Strengthening PROMETHEE with ideas of AHP. European Journal of Operational Research, 153(2), 307–317. https://doi.org/10.1016/S0377-2217(03)00153-X
Macharis, C., Springael, J., De Brucker, K., & Verbeke, A. (2004). PROMETHEE and AHP: The design of operational synergies in multicriteria analysis. Strengthening PROMETHEE with ideas of AHP. European Journal of Operational Research, 153(2), 307–317. https://doi.org/10.1016/S0377-2217(03)00153-X
Mardani, A., Jusoh, A., & Zavadskas, E. K. (2015). Fuzzy multiple criteria decision-making techniques and applications – Two decades review from 1994 to 2014. Expert Systems with Applications, 42(8), 4126– 4148. https://doi.org/10.1016/j.eswa.2015.01.003
Mikhailov, L. (2003). Deriving priorities from fuzzy pairwise comparison judgments. Fuzzy Sets and Systems, vol. 134, pp. 365-385
Ming, F., Wong, F., Liu, Z., & Chiang, M. (2014). Stock Market Prediction from WSJ: Text Mining via Sparse Matrix Factorization (pp. 430–439). IEEE. https://doi.org/10.1109/ICDM.2014.116
Modak, M., Pathak, K., & Ghosh, K. K. (2017). Performance evaluation of outsourcing decision using a BSC and Fuzzy AHP approach: A case of the Indian coal mining organization. Resources Policy, 52, 181– 191. https://doi.org/10.1016/j.resourpol.2017.03.002
Moro, S., Rita, P., & Cortez, P. (2017). A text mining approach to analyzing Annals literature. Annals of Tourism Research, 66, 208–210.
Mostafa, M. M. (2013). More than words: Social networks’ text mining for consumer brand sentiments. Expert Systems with Applications, 40(10), 4241–4251. https://doi.org/10.1016/j.eswa.2013.01.019
Mousseau, V., & Slowinski, R. (1998). Inferring an ELECTRE TRI model from assignment examples. Journal of Global Optimization, 12(2), 157–174. https://doi.org/10.1023/A:1008210427517
Mukhtarov, S., Yüksel, S., & Mammadov, E. (2018). Factors that increase credit risks of Azerbaijani banks. Journal of International Studies Vol, 11(2), 63-75.
Nădăban, S., Dzitac, S., & Dzitac, I. (2016). Fuzzy TOPSIS: A General View. Procedia Computer Science, 91, 823–831. https://doi.org/10.1016/j.procs.2016.07.088
Nagar, A., & Hahsler, M. (2012). Using Text and Data Mining Techniques to extract Stock Market Sentiment from Live News Streams. In 2012 International Conference on Computer Technology and Science (Vol. 47, pp. 91–95).
Nassirtoussi, A. K., Aghabozorgi, S., Teh, Y. W., & Ngo, D. C. L. (2015). Text mining of news-headlines for FOREX market prediction: A Multi-layer Dimension Reduction Algorithm with semantics and
sentiment. Expert Systems with Applications, 42(1), 306–324.
https://doi.org/10.1016/j.eswa.2014.08.004
Natarajan, J., Berrar, D., Dubitzky, W., Hack, C., Zhang, Y., DeSesa, C., … Bremer, E. G. (2006). Text mining of full-text journal articles combined with gene expression analysis reveals a relationship between sphingosine-I-phosphate and invasiveness of a glioblastoma cell line. Bmc Bioinformatics, 7, 373. https://doi.org/10.1186/1471-2105-7-373
Nazari, S., Fallah, M., Kazemipoor, H., & Salehipour, A. (2018). A fuzzy inference- fuzzy analytic hierarchy process-based clinical decision support system for diagnosis of heart diseases. Expert Systems with Applications, 95, 261–271. https://doi.org/10.1016/j.eswa.2017.11.001