Thermosonication processing of quince (Cydonia
Oblonga) juice: Effects on total phenolics, ascorbic acid,
antioxidant capacity, color and sensory properties
Processamento de termosonicação do suco de quince (Cydonia Oblonga): Efeitos nos fenólicos totais, ácido ascórbico, capacidade antioxidante, cor e propriedades sensoriais
Seydi Yıkmış1* , Harun Aksu2 , Başak Gökçe Çöl3 , Mehmet Alpaslan1
1Tekirdağ Namık Kemal University, Department of Nutrition and Dietetics, Değirmenaltı, Tekirdağ, Turkey 2Istanbul University-Cerrahpaşa, Department of Food Hygiene & Technology, Istanbul, Turkey
3Istanbul Gelisim University, Department of Nutrition and Dietetics, Istanbul, Turkey *Corresponding author: [email protected]
Received in August 20, 2019 and approved in October 22, 2019 AbsTrAcT
Quince (Cydonia oblonga) is an important fruit for the juice industry because of its nutritional properties that support health. In this study, the aim was to optimize the bioactive components (total phenolic content, ascorbic acid and total antioxidant capacity) and color values (L *, a * and b *) using thermosonication treatment, which is a mild ultrasound treatment, on quince juice. Sensory evaluation was also performed with optimization parameters. For this purpose, thermosonication treatment was completed at different temperatures (30, 35, 40, 45 and 50 °C), different amplitudes (40%, 45%, 50%, 55% and 60%) and at different times (2, 4, 6, 8 and 10 min). At the end of the thermosonication treatment, the optimization values for quince juice were 38.7 °C, 5.6 minutes and 50.9 amplitude. Total phenolic content was 591.15 mg GAE/L, ascorbic acid 3.78 mg/100 mL, DPPH 0.214 mg TEAC/mL and CUPRAC 0.149 mg TEAC/mL. Total phenolic and total antioxidant levels were higher in quince juice treated with thermosonication than in fresh quince juice. Thermosonication treatment decreased the amount of ascorbic acid. Thermosonation treatments applied to quince juices were successful in general microbiological evaluation. In sensory evaluation by panelists, the thermosonicated sample was found to be the most admired. As a result, quince juice treated with thermosonication is considered promising to improve bioactive components compared to thermal pasteurization.
Index terms: Non-thermal; ultrasound; pasteurization.
rEsUMO
O marmelo (Cydonia oblonga) é uma fruta importante para a indústria de suco, devido às suas propriedades nutricionais que sustentam a saúde. Neste estudo, o objetivo foi otimizar os componentes bioativos (conteúdo fenólico total, ácido ascórbico e capacidade antioxidante total) e os valores de cor (L *, a * eb) usando o tratamento termossônico, que é um tratamento ultrassônico leve, em suco de marmelo. A avaliação sensorial também foi realizada com parâmetros de otimização. Para esse fim, o tratamento com termossonicação foi concluído em diferentes temperaturas (30, 35, 40, 45 e 50 ° C), diferentes amplitudes (40%, 45%, 50%, 55% e 60%) e em diferentes tempos (2, 4, 6, 8 e 10 min). Ao final do tratamento térmico, os valores de otimização para o suco de marmelo foram 38,7 ° C, 5,6 minutos e amplitude de 50,9. O conteúdo fenólico total foi de 591,15 mg GAE / L, 3,78 mg / 100 mL de ácido ascórbico, 0,214 mg de TEAC / mL de DPPH e 0,149 mg de TEAC / mL de CUPRAC. Os teores totais de antioxidantes fenólicos e totais foram maiores no suco de marmelo tratado com termossonicação do que no suco fresco. O tratamento por termossonicação diminuiu a quantidade de ácido ascórbico. Os tratamentos de termossonação aplicados aos sucos de marmelo foram bem-sucedidos na avaliação microbiológica geral. Na avaliação sensorial pelos painelistas, a amostra termo-ressonante foi considerada a mais admirada. Como resultado, o suco de marmelo tratado com termossonication é considerado promissor para melhorar os componentes bioativos em comparação com a pasteurização térmica.
Termos para indexação: Não térmico; ultrassonografia; pasteurização.
INTrODUcTION
Quince (Cydonia oblonga), which naturally grows in the south of Asia and spread from here to the whole world, is now cultivated in southern Europe, Africa, the Far East, Australia and South America. Turkey is among
the leading countries for the production of quince (de Almeida Lopes et al., 2018; Kaya et al., 2007). Quince has antioxidant, antimicrobial, antiinflammatory, anticancer, antiallergic and antiulcerative properties, in addition to reducing the risk of osteoporosis in women, reducing
blood sugar and blood cholesterol, helping to stabilize the nervous system. It contains bioactive compounds and is considered to be an economic and important nutritional source that promotes health. Quince is a kind of soft-core fruit. Quince fruit is very acidic, bitter and hard when consumed fresh, so it is usually consumed by making jam or jelly. Quince fruit juice and nectar have also been used in the fruit juice industry in recent years (de Almeida Lopes et al., 2018; Pacifico et al., 2012; Silva et al., 2002).
According to many studies conducted in recent years, fruit juices are indispensable products for healthy nutrition. Accordingly, demand for less processed fruit juices is increasing day by day. Due to the tendency of consumers to favor natural products, the negative effects of thermal preservation methods (such as pasteurization and sterilization) on nutrients have started to be questioned. Consumer demand for high-quality, fresh and microbiologically safe foods and interest in the development of new technologies is growing. Therefore, it is important to inactivate pathogenic microorganisms to levels that do not pose a health hazard with the use of low process temperatures, low energy consumption, while maintaining nutritional and sensory quality (Anaya-Esparza et al., 2017; Mosqueda-Melgar; Raybaudi-Massilia; Martín-Belloso, 2008). One of the alternative technologies used for preservation of nutritional value and sensory properties of fruit juice is ultrasound technology.
The term ultrasonication is defined as the generation of energy by sound waves with 20,000 or more vibrations per second (Lima et al., 2015; Liu et al., 2016). Devices developed for ultrasonication can be used at frequencies ranging from 20 kHz to 10 MHz. The most important advantage of ultrasonication compared to heat treatment is that it ensures the inactivation of degrading and pathogenic microorganisms and undesirable enzymes, while the process temperature is low, resulting in better preservation of the taste, odor, texture and nutrients of the product, and yielding a product very close to its fresh state (Chandrapala et al., 2012; Leighton, 2007; McClements, 1995; Tiwari; Mason, 2012). Single use ultrasonication requires high intensity sound, energy and time use (Chemat; Zill-E-Huma; Khan, 2011). Thermosonication is a new and applicable technique used in place of conventional heat treatments. Ultrasonication was reported to be more effective when combined with moderate heat. This combined process enhances enzymatic and microbial inactivation by heat and cavitation and is reported to be successful without causing changes to fruit juice (Anaya-Esparza et al., 2017).
There is no study on the effect of thermosonication on quince juice and bioactive compounds (total phenolic content, ascorbic acid, total antioxidant), color values (L *, a * and b *), microbiology and sensory properties. The aim of this study was to apply the thermosonication process at different times (2, 4, 6, 8, 10 minutes), at moderate temperature conditions (30 °C, 35 °C, 40 °C, 45 °C, 50 °C), and different amplitude values (40%, 45% 50%, 55%, 60%) to quince juice and optimize the conditions using the surface response method.
MATErIAL AND METHODs
Juice sample preparation and thermosonication treatments
Quince was collected from a local producer (Tekirdag, Turkey) and kept at 4 °C until the experiments were performed. Stems, seeds and ripened parts were discarded. A blender (Waring Commercial Blender Model HGB2WTS3, USA) was used for pulping. After crushing, the quince was filtered through sterilized double layer muslin fabric. Quince juice was mixed with vortex and selected as control (C). The juice was filled into sterilized 100 mL airtight bottles. It was pasteurized for 30 seconds at 90 °C in a water bath (Wisd-Model WUC-D06H, Daihan, Wonju, Korea) and cooled to 20 °C, and denoted as pasteurized quince juice (PQ). Sonication treatments were performed directly after fresh juice was extracted. Quince juice was treated at 26 kHz frequency for different times (2, 4, 6, 8 and 10 minutes), at different temperatures (30, 35, 40, 45 and 50 °C) and amplitudes (40%, 45%, 50%, 55% and 60%). Sonication was performed with an ultrasonic processor (Model UP200St, Hielscher Ultrasonics, Berlin, Germany). Samples were stored at -20 °C until analysis.
Experimental design
Quince juice was analyzed by using Minitab Statistical Analysis Software (Minitab 18.1, Minitab, Inc, USA, 2017) to optimize the effect of ultrasound. The Response Surface Method (RSM) was used. Central Composite Design (CCD) was chosen as the experimental design and a five-level, three-factor experimental design was created. There are 20 test points for optimization (Table 1 and Table 2). Model competence, R2 and corrected
-R2 coefficients, lack-of-fit tests and ANOVA results
were evaluated. Dependent variables were determined as total phenolic content (TPC), ascorbic acid, antioxidants (DPPH and CUPRAC) and color values. The second
where quality Y is the dependent variable, βo is intersection
term, βi is first order (linear) equation coefficient, βii is
quadratic coefficient of coefficient, βij is two-factor
cross-correlation coefficient, and Xi and Xj are independent
variables.
Independent variable Factor levels
(-1.68) (-1) 0 (+1) (+1.68) Temperature (X1) (°C) 30 35 40 45 50
Time (X1) (min.) 2 4 6 8 10
Amplitude (X3) (%) 40 45 50 55 60 Table 1: Independent variables and their levels in RSM.
3 3 2 3 0 1 1 1 3 1 i i ii i i ij i j i j i i j y
X
X
X X
(1) Color AnalysisL *, a * and b * values of fruit juices were
measured with a Hunter colorimeter (Color Measuring Device PCE-CSM-5, Spectrum Instruments, Meschede, Germany). L * is a measure of light and darkness between 0-100. 0 corresponds to black and 100 corresponds to white. In the color measurement system, the positive (+) values of the a * value indicate redness and the negative (-) values indicate greenness. The positive (+) values of the b * value indicate jaundice and the negative (-) values represent blue (Ordóñez-Santos; Martínez-Girón; Arias-Jaramillo, 2017).
Determination of total polyphenols, ascorbic acid and antioxidant activity
Total phenolic content analysis was performed according to the Folin-Ciocalteu method (Singleton; Rossi, 1965). Juice samples of 0.5 mL were diluted with an appropriate proportion of purified water, then 2.5 mL of 0.2 N Folin-Ciocalteu reagent was added and after 3 minutes 2 mL 7.5% (w / v) Na2CO3 solution was added. The tubes were incubated for 30 minutes at room temperature in the dark. The absorbance was then measured on a UV-VIS spectrophotometer (SP-UV / VIS-300SRB, Spectrum Instruments, Melbourne, Australia) at a wavelength of 760 nm. The total amount of phenolic agent is expressed in gallic acid (mg GAE/L). The analyses were performed in 3 parallels.
Determination of ascorbic acid
Calculation of the amount of ascorbic acid in samples used AOAC 961.27 vitamin preparation and ascorbic acid in fruit juices 2,6-dichlorophenol indophenol method-titrimetric method with three experiments repeated spectrophotometrically (AOAC, 2012). The results obtained were expressed as milligrams of ascorbic acid per 100 mL sample, and the calculation was done as stated below:
Ascorbic acid mg/100 mL = (titer x dye factor x concentration x 100)/(extract aliquot used for estimation x volume of sample use for estimation).
Determination of DPPH
Antioxidant activity was determined according to the method based on inhibition of DPPH (2,2-diphenyl-1-picrylhydrazyl) (Sigma-Aldrich, USA). Antioxidant capacity was determined by the DPPH method with some modifications (Grajeda-Iglesias et al., 2016). First, 2.9 mL of 0.1 mM DPPH solution (prepared in ethanol) was added to 0.1 mL fruit juice sample, vortex mixed and left at room temperature for 30 minutes in the dark. The absorbance was then measured on a UV-VIS spectrophotometer (SP-UV / VIS-300SRB, Spectrum Instruments, Melbourne, Australia) at a wavelength of 517 nm. The DPPH radical scavenging activity was calculated as in Equation 2:
where A0 is the absorbance of the control, and A1 is the
absorbance of the juice.
Determination of cUPrAc
The Cu(II) ion reducing antioxidant capacity (CUPRAC) method was used to determine the antioxidant capacity (Apak et al., 2006). Tubes containing 1 mL CuCl2.2H2O (Sigma-Aldrich, USA), 1 mL Neocuprin (Sigma Aldrich, Germany), 1 mL NH4Ac solution (Sigma-Aldrich, USA) in each tube with 3 parallels had 0.1 mL of appropriately diluted quince water in 1 mL of distilled water added and vortexed and allowed to incubate for 1 hour in a dark environment. The absorbance was then measured on a UV-VIS spectrophotometer (SP-UV / VIS-300SRB, Spectrum Instruments, Melbourne, Australia) at a wavelength of 450 nm. Calculations were made by using the standard calibration curve prepared with Trolox (Merck, Germany).
order-polynomial equation, which is shown in the equation below, was used to create the model in Equation 1:
0 1
0% / ) 100
DPPH radical scavenging activity A A A x
Table 2:
Measured responses used in experimental design for RSM.
Sample
Encoded Independent Variables
Dependent Variables Temperature (X1 ) Time (X 2 ) Amplitude (X 3 )
Total phenolic content (mg
GAE/L) Ascorbic acid content (mg/100 mL) DPPH (mg TEAC/mL) CUPRAC (mg TEAC/mL) L* a* b* PW 479.71 2.86 0.160 0.116 42.46 15.8 25.1 C 538.14 3.92 0.186 0.127 44.19 16.54 26.45 1 1.68 (50) 0 (6) 0 (50) 560.76 3.14 0.197 0.138 43.90 15.86 21.51 2 1 (45) -1 (4) 1 (55) 564.02 3.05 0.205 0.141 45.79 17.74 23.10 3 -1 (35) 1 (8) 1 (55) 551.27 3.88 0.201 0.141 44.85 17.59 27.82 4 -1 (35) -1 (4) -1 (45) 608.64 3.79 0.208 0.150 43.42 17.81 24.34 5 1 (45) 1 (8) -1 (45) 546.23 3.42 0.181 0.147 42.18 16.57 26.32 6 1 (45) 1 (8) 1 (55) 609.61 3.84 0.207 0.146 44.44 16.34 23.63 7 1 (45) -1 (4) -1 (45) 557.14 3.53 0.215 0.137 44.68 16.62 27.13 8 0 (40) 0 (6) 0 (50) 585.42 3.72 0.214 0.148 46.95 17.08 27.86 9 -1 (35) 1 (8) --1 (45) 558.42 3.27 0.191 0.147 44.82 17.37 25.49 10 -1 (35) -1 (4) 1 (55) 562.17 3.60 0.190 0.148 42.25 19.31 25.76 11 0 (40) 0 (6) 0 (50) 588.01 3.80 0.216 0.148 46.74 17.29 28.19 12 0 (40) 0 (6) 0 (50) 591.32 3.79 0.215 0.150 46.37 17.43 27.98 13 0 (40) 0 (6) 0 (50) 593.54 3.78 0.216 0.150 47.06 17.15 28.12 14 0 (40) 0 (6) -1.68 (40) 553.53 3.60 0.197 0.146 43.42 16.68 26.63 15 0 (40) -1.68 (2) 0 (50) 560.65 3.46 0.196 0.142 43.28 19.03 26.35 16 0 (40) 0 (6) 1.68 (60) 584.47 3.75 0.208 0.144 44.55 18.26 24.85 17 -1.68 (30) 0 (6) 0 (50) 553.58 3.55 0.187 0.147 43.08 17.83 22.93 18 0 (40) 0 (6) 0 (50) 594.17 3.77 0.214 0.149 46.65 17.31 27.96 19 0 (40) 0 (6) 0 (50) 596.51 3.76 0.214 0.149 46.62 17.21 28.03 20 0 (40) 1.68 (10) 0 (50) 557.94 3.62 0.172 0.145 43.30 17.05 27.66 C: untreated quin ce juice; PQ: pasteurized quince juice; GAE: Gallic acid equivalent; DDPH: radical scavenging activity; CUPRAC: Cupric Reducing Antioxidant Capacity;
L*: represents luminance value
a*: represents red and green;
Microbiological analysis
Serial dilutions of juice were prepared in peptone water solution for the microbial count. Colony forming units (CFU) were determined by standard spreading and pouring plate methodologies. PCA (Plate Count Agar-Merck) was used for total aerobic plate count (TAPC). Samples were incubated at 30 °C for 48 h. For yeast and mold count (YMC), PDA (Potato Dextrose Agar-Merck) was used. Samples were incubated at 24 °C for 3-5 days. Total Enterobacteriaceae count (TEC) was determined in VRBG (Violet Red BileGlucose Agar-Merck) incubated at 37 °C for 24 h. Results are given as log colony forming units (CFU) per milliliter of juice (Cruz et al., 2007).
Sensory analysis
As a result of the optimization, sensory evaluation of C and PQ samples and UQ samples were performed. The acceptance test was performed for color, texture (viscosity), taste, aroma and overall acceptance, using a 9-point structured hedonic scale ranging from (1) dislike extremely to (9) like extremely. A total of 10 (5 females, 5 male) panelists evaluated the juices. Scale scores were excellent, 9; very good 8; good, 7; acceptable, 6; and poor (first odorless, tasteless development) <6. Sub-points were accepted as 6. Prior to sensory evaluation, the juice samples were cooled, randomly coded with three-digit numbers, and the order of presentation was completely randomized for each panelist. The evaluation was carried out in the Department of Nutrition and Dietetics at Tekirdağ Namık Kemal University (Tekirdag, Turkey).
Statistical analysis
All values were obtained in triplicate and expressed as mean ± standard deviation (SD). The significant differences between mean values of quince juice samples were determined by analysis of variance (one way-ANOVA) using Tukey’s HSD (Honestly Significant Difference) test at a significance level of p < 0.05. Statistical analysis was conducted using SPSS 22.0 software (SPSS Inc., Chicago, USA). 3D graphs of the obtained models were obtained by using SigmaPlot 12.0 Statistical Analysis Software (Systat Software, Inc., San Jose, California, USA). Pearson correlation coefficients were determined using OriginPro version 2017 (OriginLab, Northampton, Massachusetts, USA.).
rEsULTs AND DIscUssION
Effect of thermosonication on total phenolic content
Phenolic compounds have protective effects on human health due to their strong antioxidant properties against free radicals that occur in the body (Yao et al., 2004). The results of the analysis of variance of the total phenolic content values (mg GAE / L) of quince juice with different temperature, duration and amplitude factors applied are given in Table 2. As a result of the response surface analysis (RSM) according to the trial design, the equation of the polynomial model indicating the effect of temperature, time and amplitude factors on the total phenolic content of quince juice samples is as follows in Equation 3.
(3)
1 2 2 2 3 1 2 2 3 1 2 1 3 2 3 / 21262 1 1.40 84.6 8.48 0.3333 2.013 0.2250 1 .198 * 0.6194 * 1 .198 * TPC mg GAE L X X X X X X X X X X X XThe model used in the study was found to be compatible for TPC (R2 = 96.41%) (Table 3). The linear
effects of quince juice samples on TPC values were not statistically significant (p> 0.05), and the amplitude effect was statistically significant (p <0.01). The effects of factors on cross-interactions and 2-way interaction of the treatments were statistically significant (p <0.001). The variation of TPC with respect to temperature, duration and amplitude is shown in Figure 1 (A). When the model was examined, a linear increase in TPC amount was observed as temperature, duration and amplitude increased. The highest TPC value was 459 °C, and 609.61 mg GAE/L was detected in application 6 treated with 55% amplitude for 8 minutes (Table 2). There was a significant positive correlation between the antioxidant amount of TPC and quince juice samples (p <0.05), but there was a low positive correlation with a * and b * color values, but it was also not statistically significant (p> 0.05) (Table 4). The application of thermosonication process to quince juice had positive effects on TPC values. As a result of optimization, TPC was found to be 591.15 mg GAE/L at 38.7 °C, 5.6 minutes and 50.9 amplitude treatment (Table 5). It was found that quince juice (UQ) treated with thermosonication caused an increase of 9% compared to sample C. When PQ and C samples were compared, a decrease of 58.53 mg GAE/L was found at the end of pasteurization. As in this study, carrot, grapefruit, casturi lime, blueberry and Chokanan
mango juices were reported to have improved TPC values after ultrasound treatments (Aadil et al., 2013; Bhat et al., 2011; Jabbar et al., 2014; Santhirasegaram; Razali; Somasundram, 2013; Zou; Hou, 2017). The cause of these improvements can be attributed to the disintegration of the cell wall by the pressure created by cavitation during ultrasound. Also, the binding of hydroxyl radicals (OH-)
produced by ultrasound to the aromatic ring of phenolic compounds can be a reason for the increase in phenolic substances (Aadil et al., 2013).
Effect of thermosonication on ascorbic acid
Ascorbic acid can oxidize many species that have the potential to cause diseases in humans. Ascorbic acid has an important role in collagen tissue synthesis, metabolism of metal ions, development of immune system, reducing the risk of cardiovascular diseases and
nervous disorders, and preventing free radical-induced DNA damage (Daud; Ismail; Sarmadi; 2016). The results of the variance analysis for the ascorbic acid values (mg / 100 mL) of quince juice with different levels of temperature, duration and amplitude factors are given in Table 2. As a result of the RSM according to the trial design, the equation of the polynomial model indicating the effect of temperature, time and amplitude factors on the ascorbic acid value of quince juice samples is as follows in Equation 4. Source DF TPC (mg GAE/L) Ascorbic acid content (mg/100 mL) DPPH (mg
TEAC/mL) (mg TEAC/mL)CUPRAC L* a* b*
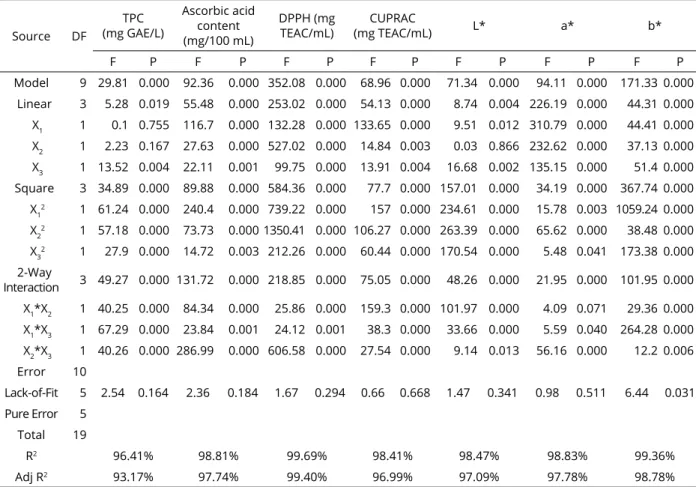
F P F P F P F P F P F P F P Model 9 29.81 0.000 92.36 0.000 352.08 0.000 68.96 0.000 71.34 0.000 94.11 0.000 171.33 0.000 Linear 3 5.28 0.019 55.48 0.000 253.02 0.000 54.13 0.000 8.74 0.004 226.19 0.000 44.31 0.000 X1 1 0.1 0.755 116.7 0.000 132.28 0.000 133.65 0.000 9.51 0.012 310.79 0.000 44.41 0.000 X2 1 2.23 0.167 27.63 0.000 527.02 0.000 14.84 0.003 0.03 0.866 232.62 0.000 37.13 0.000 X3 1 13.52 0.004 22.11 0.001 99.75 0.000 13.91 0.004 16.68 0.002 135.15 0.000 51.4 0.000 Square 3 34.89 0.000 89.88 0.000 584.36 0.000 77.7 0.000 157.01 0.000 34.19 0.000 367.74 0.000 X12 1 61.24 0.000 240.4 0.000 739.22 0.000 157 0.000 234.61 0.000 15.78 0.003 1059.24 0.000 X22 1 57.18 0.000 73.73 0.000 1350.41 0.000 106.27 0.000 263.39 0.000 65.62 0.000 38.48 0.000 X32 1 27.9 0.000 14.72 0.003 212.26 0.000 60.44 0.000 170.54 0.000 5.48 0.041 173.38 0.000 2-Way Interaction 3 49.27 0.000 131.72 0.000 218.85 0.000 75.05 0.000 48.26 0.000 21.95 0.000 101.95 0.000 X1*X2 1 40.25 0.000 84.34 0.000 25.86 0.000 159.3 0.000 101.97 0.000 4.09 0.071 29.36 0.000 X1*X3 1 67.29 0.000 23.84 0.001 24.12 0.001 38.3 0.000 33.66 0.000 5.59 0.040 264.28 0.000 X2*X3 1 40.26 0.000 286.99 0.000 606.58 0.000 27.54 0.000 9.14 0.013 56.16 0.000 12.2 0.006 Error 10 Lack-of-Fit 5 2.54 0.164 2.36 0.184 1.67 0.294 0.66 0.668 1.47 0.341 0.98 0.511 6.44 0.031 Pure Error 5 Total 19 R2 96.41% 98.81% 99.69% 98.41% 98.47% 98.83% 99.36% Adj R2 93.17% 97.74% 99.40% 96.99% 97.09% 97.78% 98.78%
DF: degree of freedom. *: multiplication. The term is significant at p ≤ 0.05. The term is significant at p ≤ 0.01. The term is significant at p ≤ 0.001. TPC: total phenolic content, GAE: Gallic acid equivalent; DDPH: radical scavenging activity; CUPRAC: Cupric Reducing Antioxidant Capacity; L*: represents luminance value a*: represents red and green; b*: represents yellow and blue.
Table 3: Analysis of variance (ANOVA) of responses for experiments.
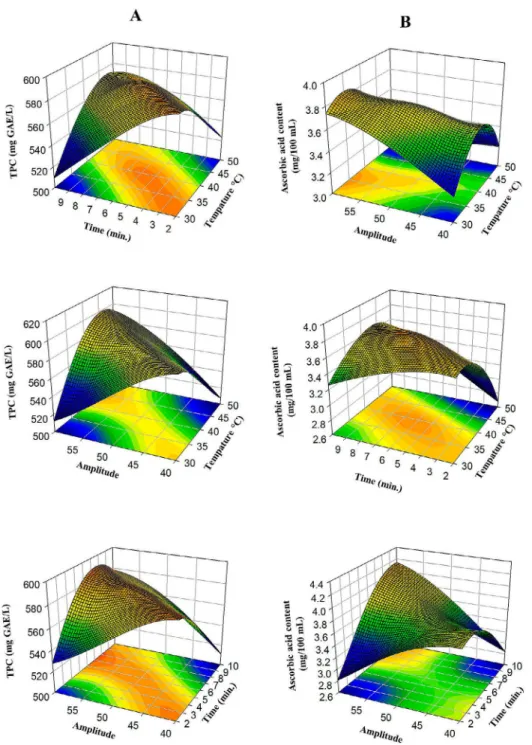
1 2 2 3 1 2 2 2 3 1 2 1 3 2 3 / 2.07 0.3852 1 .3175 0.0874 0.004387 0.01519 0.001086 0.01152 * 0.002449 * 0.02125 * TPC mg GAE L X X X X X X X X X X X X (4)Figure 1: Response surface plots (3D) of TPC (A) and ascorbic acid (B) analysis as a function of significant interaction factors.
The model used in the study was found to be compatible with the level of ascorbic acid (R2 = 98.81%)
(Table 3). Linear effects of different temperatures, times and amplitudes on ascorbic acid values of quince juice samples were found to be statistically significant (p
<0.001). Cross-interactions of temperature and time were found to be statistically significant (p <0.001). At the same time, the effects of the factors in 2-way interaction were found to be statistically significant from the linear effects on ascorbic acid values (p <0.001).
The variation of ascorbic acid amounts with respect to temperature, time and amplitude is shown in Figure 1 (B). When the model is examined, it was found that ascorbic acid decreases with increasing temperature, duration and amplitude. The minimum change value was 3.88 mg/100 mL in treatment number 3 treated with 35 °C and 55% for 8 minutes (Table 2). Ascorbic acid content of quince juice samples showed low correlation with L * and a * color values and was not significant (p> 0.05). It was found that there was a significant low correlation with other parameters (p <0.05) (Table 4). As a result of optimization, ascorbic acid was found to be 3.78 mg/100 mL with 38.7 °C, 5.6 minutes and 50.9 amplitude treatment (Table 5). When PQ and C
samples were compared, a decrease of 1.06 mg/100 mL was observed at the end of pasteurization. In the studies where ultrasound was applied, it was determined that ascorbic acid content decreased and Chokanan mango (Santhirasegaram; Razali; Somasundram, 2013) and kiwi juice (Wang et al., 2019a) showed parallelism with our study. In contrast, ascorbic acid increased after ultrasound treatment applied to strawberry juice (Wang; Vanga; Raghavan, 2019b). The amount of amino acid in the juice dissolves in the presence of gases (O2), the ascorbic acid compound reacts with free radicals, and can be reduced by factors such as acoustic power and temperature effects (Merouani et al., 2015; Santhirasegaram; Razali; Somasundram, 2013).
Analysis TPC (mg GAE/l) Ascorbic acid content(mg/100 mL) (mg TEAC/mL)DPPH (mg TEAC/mL)CUPRAC L* a* b*
TPC (mg GAE/l) 1 0.641* 0.821* 0.810* 0.583* 0.284 0.154 Ascorbic acid content (mg/100 mL) 0.641* 1 0.533* 0.501* 0.382 0.234 0.526* DPPH (mg TEAC/mL) 0.821* 0.533* 1 0.585 0.786* 0.194 0.281 CUPRAC (mg TEAC/mL) 0.810* 0.501* 0.585* 1 0.364 0.451* 0.230 L* 0.583* 0.382 0.786* 0.364 1 -0.042 0.470* a* 0.284 0.234 0.194 0.451* -0.042 1 0.085 b* 0.154 0.526* 0.281 0.230 0.470* 0.085 1
2-tailed test of significance is used. *Correlation is significant at the 0.05 level. TPC: total phenolic content, GAE: Gallic acid equivalent; DDPH: radical scavenging activity; CUPRAC: Cupric Reducing Antioxidant Capacity; L*: represents luminance value
a*: represents red and greenery; b*: represents yellow and blue.
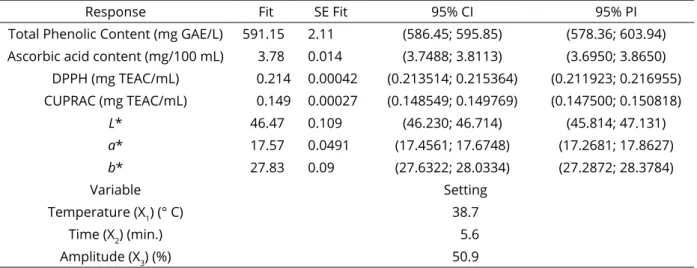
Table 4: Maximum optimization values, according to the response surface method.
Response Fit SE Fit 95% CI 95% PI
Total Phenolic Content (mg GAE/L) 591.15 2.11 (586.45; 595.85) (578.36; 603.94) Ascorbic acid content (mg/100 mL) 3.78 0.014 (3.7488; 3.8113) (3.6950; 3.8650)
DPPH (mg TEAC/mL) 0.214 0.00042 (0.213514; 0.215364) (0.211923; 0.216955) CUPRAC (mg TEAC/mL) 0.149 0.00027 (0.148549; 0.149769) (0.147500; 0.150818) L* 46.47 0.109 (46.230; 46.714) (45.814; 47.131) a* 17.57 0.0491 (17.4561; 17.6748) (17.2681; 17.8627) b* 27.83 0.09 (27.6322; 28.0334) (27.2872; 28.3784) Variable Setting Temperature (X1) (° C) 38.7 Time (X2) (min.) 5.6 Amplitude (X3) (%) 50.9
Table 5: Predicted mathematical models for TPC, Ascorbic acid, DPPH, CUPRAC, L*, a*, b* values after ultrasound treatment.
Effect of thermosonication on total antioxidant
Antioxidants are molecules which prevent oxidation caused by free radicals and have the ability to capture and stabilize free radicals. The main effect of antioxidants on human health is the active role of binding free radicals. They also have antibacterial, anticarcinogenic and protective effects on cardiovascular diseases in the body (Srdić-Rajić; Konić Ristić, 2016). Table 2 shows the results of variance analysis of quince juice DPPH (mg TEAC/mL) and CUPRAC (mg TEAC/mL) values for the temperature, duration and amplitude factors applied at different levels. As a result of RSM according to the experimental design, the equation for the polynomial model indicating the effect of temperature, time and amplitude factors on the DPPH and CUPRAC values of quince juice samples is as follows in Equations 5 and 6.
The model used in the study was found to be compatible for DPPH (R2 = 99.69%) and CUPRAC (R2 =
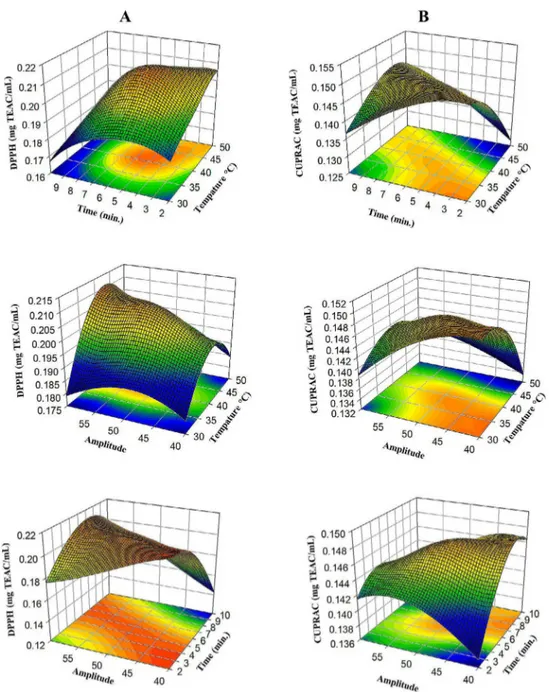
98.41%) (Table 3). Linear effects of different temperatures, times and amplitudes on DPPH values were found to be statistically significant (p <0.001). Linear effects of different times and amplitudes of sonication applied to quince juice samples were found to be statistically significant (p <0.01). Cross-interactions of factors and 2-way interaction were statistically significant on DPPH and CUPRAC antioxidant levels (p <0.001). The variation of DPPH and CUPRAC antioxidant amounts according to temperature, duration and amplitude is shown in Figure 2 (A, B). When the model is examined, it was found that there was linear increase in antioxidant amounts of DPPH and CUPRAC as temperature, duration and amplitude increased. The highest DPPH values were found to be 0.216 mg TEAC/mL in treatments 11 and 13 treated with
1 2 2 3 1 2 2 2 3 1 2 1 3 2 3 / 0.1813 0.01631 0.01809 0.00432 0.000228 0.001924 0.000122 0.000189 * 0.000073 * 0.000914 * DPPH mg TEAC mL X X X X X X X X X X X X
1 2 3 2 2 2 1 2 3 1 2 1 3 2 3 / 0.0953 + 0.000253 0.00133 0.002512 0.000069 0.000356 0.000043 0.000309 * 0.000061 * 0.000128 * CUPRAC mg TEAC mL X X X X X X X X X X X X (5) (6)50% at 40 °C for 6 minutes (Table 2). The highest CUPRAC values were found to be 0.150 mg TEAC/mL in 4, 12 and 13 treatments treated with 50% at 40 °C for 6 minutes (Table 2). There was a positive correlation (r = 0.821) between DPPH and TPC amounts of quince juice samples (p <0.05). However, it was found that there was a low positive correlation with a * and b * color values but this was not statistically significant (p> 0.05) (Table 4). There was a positive correlation (r = 0.810) between CUPRAC and TPC amounts of quince juice samples (p <0.05). However, L * and b * color values were found to show a low positive correlation which was not significant (p> 0.05) (Table 4).
The application of the thermosonication process to quince juice had positive effects on DPPH and CUPRAC values. As a result of optimization, DPPH was determined as 0.214 mg TEAC/mL and CUPRAC 0.149 mg TEAC/mL for 38.7 °C, 5.6 minutes and 50.9 amplitude treatment (Table 5). Quince juice (UQ) treated with thermosonication caused a 13.1% increase in DPPH antioxidant amount compared to C sample. It was determined that CUPRAC antioxidant amount increased by 14.8%. When PQ and C samples were compared, it was found that after pasteurization, DDPH decreased in value to 0.026 mg TEAC/mL and CUPRAC to 0.011 mg TEAC/mL.
It was reported that total antioxidant capacity increases in purple cactus pear (Zafra-Rojas et al., 2013), Kasturi lime (Bhat et al., 2011), blueberry (Mohideen et al., 2015) and grapefruit juice (Aadil et al., 2013) when ultrasound treatments are applied. Increasing the amount of phenolic compounds as a result of cavitation caused by shear force due to ultrasound treatment may lead to an increase in total antioxidant capacity. It was also reported that by increasing the application time in ultrasound treatments, the cleaning ability of Maillard reaction products for the oxygen radical is increased (Aadil et al., 2013; Mohideen et al., 2015; Zhang; Yang; Zhao, 2015).
Effect of thermosonication on color
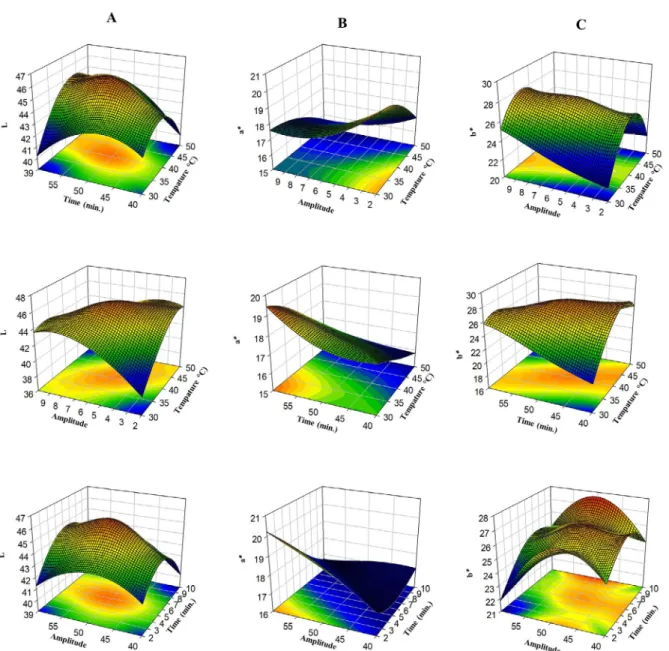
Color is a visual marker that plays an important role in consumer satisfaction (Aadil et al., 2013). The results of variance analysis of L *, a * and b * values for quince juice with different levels of temperature, duration and amplitude factors are given in Table 2. As a result of RSM according to the experimental design, the equation of the polynomial model indicating the effect of temperature, time and amplitude factors on L *, a * and b * values of quince juice samples is as follows in Equations 7, 8 and 9.
The model used in the study was found to be compatible with L * (R2 = 98.47%) and a * (R2 = 98.83%)
and b * (R2 = 99.36%) color levels (Table 3). It was
determined that the effects of different times applied to quince juice L * color value were not statistically significant (p>0.05). Linear effects of different temperatures, times and amplitudes on a * and b * color values of quince juice samples were found to be statistically significant (p<0.001). The cross-interactions of the factors on L *,
a * and b * color values were statistically significant
(p<0.05). Time and amplitude 2-way interaction were found to be statistically significant for L * color values (p<0.05). a * color value was not statistically significant for the temperature and time 2-way interaction (p>0.05).
There was a positive correlation (r = 0.786) between
L * and DPHH amounts of quince juice samples (p<0.05).
However, there was a significant negative correlation (r = -0.042) with a * color values (p>0.05). There was a positive correlation between a * and CUPRAC amounts and a low correlation with b* (r = 0.451) (p<0.05). There was a positive significant low correlation with b * color value, ascorbic acid and L * color value (p<0.05) (Table 4). The variation of L *, a
* and b * color values according to temperature, duration and
amplitude is shown in Figure 3 (A, B, C). When the model was examined, it was found that there were variations in L
*, a * and b * color values as the temperature, duration and
amplitude amount increased.
The highest L * value was found to be 47.06 with application 13, treated with 40 °C and 50% at 6 minutes (Table 2). The highest a * value was found to be 19.31 at
35 °C in application 13 treated with 55% for 4 minutes. The highest b * value was found to be 19.31 in application 11 treated with 50% at 40 °C for 6 minutes. As a result of the optimization, color values of L * (46.47), a * (17.57) and b * (27.83) were determined for 38.7 °C, 5.6 minutes and 50.9 amplitude treatment (Table 5).
Small changes in redness and yellowness in fruit juices can be explained by the oxidation of color pigments (Adekunte et al., 2010). Increases in L * values can be caused by precipitation of unstable particles in the juice (Tiwari et al., 2009). The decrease in color values may be due to the increase in TPC amount in fruit juice samples as a result of cavitation (Tomadoni et al., 2017). A decrease in
a * values of fruit juices may be related with anthocyanin
degradation and increased maillard reaction products (Aguiló-Aguayo et al., 2009). On the other hand, one of the reasons for the color changes may be caused by the hydroxyl radicals formed as a result of cavitation affecting the color values (Aguilar et al., 2017). Although changes in L *, a * and b * values of quince juice were detected, these changes could not be detected with the naked eye.
Effect of thermosonication on microbiological analysis
In this study, significant decrease in microbial count was observed in quince juice samples after thermosonation and thermal treatment (Table 6). In control quince water, TAPC was determined as 2.14 log CFU / ml. No colony was detected after thermosonication and thermal pasteurization applied to the control sample. Non-thermal treatments have been reported to be effective in minimizing the presence of foodborne pathogens in tomato juices in mango, pineapple, grape and cranberry juices (Adekunte et al., 2010; Bermúdez-Aguirre; Barbosa-Cánovas, 2012; Santhirasegaram; Razali; Somasundram, 2013). Reduction in microbial load may result from cavitation as a result of physical effects and chemical reactions that occur during cavitation (Abid et al., 2014). General microbiological analyzes were found to comply with the Turkish Food Codex Regulation on Microbiological Criteria (Anonymous, 2011).
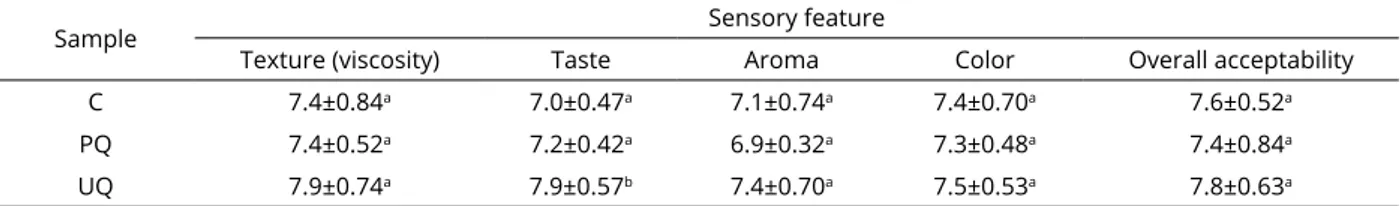
Effect of thermosonication on sensory analysis
This is a scientific discipline that is used to detect, measure, analyze and interpret the food’s effect on the five sensory organs and their perceived characteristics (Kapsalis, 1987). For sensory analysis, ultrasound treated quince juice (UQ) and C and PQ samples were compared under optimization conditions determined by RSM. The results for sensory evaluation of quince juice are shown in Table 7 and Figure 4. No statistically significant differences
1 2 3 2 2 2 1 2 3 1 2 1 3 2 3 * 60.8 2.190 5.131 1 .841 0.03358 0.2224 0.02863 0.09812 * 0.02255 * 0.02938 * L X X X X X X X X X X X X 1 2 3 2 2 2 1 2 3 1 2 1 3 2 3 * 4.71 0.359 0.451 0.204 0.003932 0.05011 0.002318 0.00887 * 0.00415 * 0.03287 * a X X X X X X X X X X X X 1 2 2 2 3 1 2 2 3 1 2 1 3 2 3 * 229.61 7.533 1 .357 4.235 0.05912 0.0704 0.02392 0.04362 * 0.05235 * 0.02813 * b X X X X X X X X X X X X (7) (8) (9)
Figure 2: Response surface plots (3D) of DPPH (A) and CUPRAC (B) analysis as a function of significant interaction factors.
were found in the texture, aroma, color and overall acceptability evaluations of the quince juice treatments (p>0.05). Taste was found to be statistically different from other samples (p>0.05). The best results of the panelists’ general evaluations were obtained by the UQ sample with average scores of texture (7.9), taste (7.9), aroma (7.4), color (7.5) and overall acceptability (7.8). Cavitation may be related to reducing oxygen in fruit juice which may improve the sensory properties with ultrasound treatments
(Samani et al., 2015). Researchers reported that ultrasound treatments applied to orange (Samani et al., 2015), soursop (Dias et al., 2015), cranberry (Jambrak et al., 2017) and carrot-grape (Nadeem et al., 2018) juices did not cause a significant difference in the panelists’ acceptance range compared to control (non-ultrasound) samples. In our study, the results were in parallel with the findings in the literature and ultrasound did not affect or even improve sensory properties.
Figure 3: Response surface plots (3D) of L* values (A), a* values (B) and b* values (C) as a function of significant interaction factors.
Sample
Microbiological analysis Total Enterobacteria count
(log CFU/ml) Total aerobic plate count(log CFU/ml) Yeast and mould count(log CFU/ml)
C ND 2.14±0.04a <1
PQ ND ND ND
UQ ND ND ND
Values followed by different letters within the same column are significantly different (p < 0.05) (n = 3 ± SD). C: untreated quince juice; PQ: Pasteurized quince juice; UQ: thermosonication treated quince juice; ND: not detected; CFU: colony-forming unit. Table 6: Results of microbiological analysis for quince juices.
cONcLUsIONs
The optimization of the response surface methodology (RSM) for the thermosonication process was shown to be an effective process on total phenolic content, ascorbic acid content, total antioxidant capacity and color values. Predictive regression models were developed and showed good correlation with experimental data at 95% confidence level. It was found that thermosonication of quince juice improves total phenolic, DPPH and CUPRAC antioxidant capacities and improves color values. Ascorbic acid, one of the bioactive components, is negatively affected, but it is more successful when compared with thermal pasteurization. Thermosonation was successful in reducing the microbial load of quince juice. Sensory
evaluation by panelists was generally positive. When the results were evaluated, the thermosonication process can be used successfully according to panelists because it favored the improvement of the process in terms of bioactive properties. It was concluded that more pilot scale research is needed for the successful application of thermosonication at the industrial level and to pasteurize quince juice as an alternative to conventional thermal pasteurization.
AcKNOWLEDGMENTs
This study was supported by Tekirdağ Namık Kemal University-Scientific Research Coordination Unit under Project Number: NKUBAP.48.DS.19.207.
Sample Sensory feature
Texture (viscosity) Taste Aroma Color Overall acceptability
C 7.4±0.84a 7.0±0.47a 7.1±0.74a 7.4±0.70a 7.6±0.52a
PQ 7.4±0.52a 7.2±0.42a 6.9±0.32a 7.3±0.48a 7.4±0.84a
UQ 7.9±0.74a 7.9±0.57b 7.4±0.70a 7.5±0.53a 7.8±0.63a
Figure 4: Sensory analysis values chart for quince juices. Table 7: Results of sensory analysis for quince juices.
Values followed by different letters within the same column are significantly different (p < 0.05) (n = 3 ± SD). C:untreated quince juice; PQ: Pasteurized quince juice; UQ:thermosonication treated quince juice.
rEFErENcEs
AADIL, R. M. et al. Effects of ultrasound treatments on quality of grapefruit juice. Food Chemistry, 141(3):3201-3206, 2013. ABID, M. et al. Thermosonication as a potential quality
enhancement technique of apple juice. Ultrasonics Sonochemistry, 21(3):984-990, 2014.
ADEKUNTE, A. et al. Effect of sonication on colour, ascorbic acid and yeast inactivation in tomato juice. Food Chemistry, 122(3):500-507, 2010.
AGUILAR, K. et al. Ascorbic acid stability in fruit juices during thermosonication. Ultrasonics Sonochemistry, 37:375-381, 2017.
AGUILó-AGUAYO, I. et al. Avoiding non-enzymatic browning by high-intensity pulsed electric fields in strawberry, tomato and watermelon juices. Journal of Food Engineering, 92(1):37-43, 2009.
ANAYA-ESPARzA, L. M. et al. Thermosonication: An alternative processing for fruit and vegetable juices. Trends in Food Science & Technology, 61:26-37, 2017.
ANONYMOUS. Turkish Food Codex Regulation on Microbiological Criteria. Law of Authorization: 5996. Official Gazette of Publication: 29.12.2011-28157. 2011. ASSOCIATION OF OFFICIAL ANALYTICAL CHEMISTS - AOAC.
Official methods of analysis of AOAC International. 19ed. Gaithersburg: AOAC International, 2012.
APAK, R. et al. The cupric ion reducing antioxidant capacity and polyphenolic content of some herbal teas. International Journal of Food Sciences and Nutrition, 57(5-6):292-304, 2006.
BHAT, R. et al. Sonication improves kasturi lime (Citrus
microcarpa) juice quality. Ultrasonics Sonochemistry, 18(6):1295-1300, 2011.
BERMúDEz-AGUIRRE, D.; BARBOSA-CáNOVAS, G. V. Inactivation of Saccharomyces cerevisiae in pineapple, grape and cranberry juices under pulsed and continuous thermo-sonication treatments. Journal of Food Engineering, 108(3):383-392, 2012
CHANDRAPALA, J. et al. Ultrasonics in food processing – Food quality assurance and food safety. Trends in Food Science & Technology, 26(2):88-98, 2012.
CHEMAT, F.; zILL-E-HUMA; KHAN, M. K. Applications of ultrasound in food technology: Processing, preservation and extraction. Ultrasonics Sonochemistry, 18(4):813-835, 2011.
CRUz, N. et al. Ultra high pressure homogenization of soymilk: Microbiological, physicochemical and microstructural characteristics. Food Research International, 40(6): 725-732, 2007.
DAUD, z. A. M.; ISMAIL, A.; SARMADI, B. Ascorbic acid: Physiology and health effects. Encyclopedia of Food and Health, 266-274, 2016.
DE ALMEIDA LOPES, M. M. et al. Quince-Cydonia oblonga. In: RODRIGUES, S.; SILVA, E.; BRITO, E. S. de. (Eds.), Exotic fruits reference guide. London: Academic Press, 2018. v.1, p.363-368.
DIAS, D. R. C. da. et al. Effect of sonication on soursop juice quality. LWT - Food Science and Technology, 62(1):883-889, 2015. GRAJEDA-IGLESIAS, C. et al. Antioxidant activity of
protocatechuates evaluated by DPPH, ORAC, and CAT methods. Food Chemistry, 194:749-757, 2016.
JABBAR, S. et al. Study on combined effects of blanching and sonication on different quality parameters of carrot juice. International Journal of Food Sciences and Nutrition, 65(1):28-33, 2014.
JAMBRAK, A. R. et al. Aromatic profile and sensory characterisation of ultrasound treated cranberry juice and nectar. Ultrasonics Sonochemistry, 38:783-793, 2017. KAPSALIS, J. G. Objective methods in food quality assessment.
Florida: CRC Press, 1987. 275p.
KAYA, A. et al. An experimental study on the drying kinetics of quince. Desalination, 212(1-3):328-343, 2007.
LEIGHTON, T. G. What is ultrasound?. Progress in Biophysics and Molecular Biology, 93(1-3):3-83, 2007.
LIMA, M. et al. Phenolic compounds, organic acids and antioxidant activity of grape juices produced in industrial scale by different processes of maceration. Food Chemistry, 188:384-392, 2015.
LIU, F. et al. Potential of pressure processing and high-temperature/short-time thermal processing on microbial, physicochemical and sensory assurance of clear cucumber juice. Innovative Food Science & Emerging Technologies, 34:51-58, 2016.
MCCLEMENTS, D. J. Advances in the application of ultrasound in food analysis and processing. Trends in Food Science & Technology, 6(9):293-299, 1995.
MEROUANI, S. et al. New interpretation of the effects of argon-saturating gas toward sonochemical reactions. Ultrasonics Sonochemistry, 23:37-45, 2015.
MOHIDEEN, F. W. et al. Effect of continuous ultra-sonication on microbial counts and physico-chemical properties of blueberry (Vaccinium corymbosum) juice. LWT - Food Science and Technology, 60(1):563-570, 2015.
MOSQUEDA-MELGAR, J.; RAYBAUDI-MASSILIA, R. M.; MARTíN-BELLOSO, O. Non-thermal pasteurization of fruit juices by combining high-intensity pulsed electric fields with natural antimicrobials. Innovative Food Science & Emerging Technologies, 9(3):328-340, 2008.
NADEEM, M. et al. Effect of ultrasound and chemical treatment on total phenol, flavonoids and antioxidant properties on carrot-grape juice blend during storage. Ultrasonics Sonochemistry, 45:1-6, 2018.
ORDóñEz-SANTOS, L. E.; MARTíNEz-GIRóN, J.; ARIAS-JARAMILLO, M. E. Effect of ultrasound treatment on visual color, vitamin C, total phenols, and carotenoids content in Cape gooseberry juice. Food Chemistry, 233:96-100, 2017. PACIFICO, S. et al. Antioxidant properties and cytotoxic effects
on human cancer cell lines of aqueous fermented and lipophilic quince (Cydonia oblonga Mill.) preparations. Food and Chemical Toxicology, 50(11):4130-4135, 2012. SAMANI, B. H. et al. Analysis of the combinative effect of
ultrasound and microwave power on Saccharomyces
cerevisiae in orange juice processing. Innovative Food Science & Emerging Technologies, 32:110-115, 2015. SANTHIRASEGARAM, V.; RAzALI, z.; SOMASUNDRAM, C. Effects
of thermal treatment and sonication on quality attributes of Chokanan mango (Mangifera indica L.) juice. Ultrasonics Sonochemistry, 20(5):1276-1282, 2013.
SILVA, B. M. et al. Phenolic profile of quince fruit (Cydonia
oblonga Miller) (pulp and peel). Journal of Agricultural and Food Chemistry, 50(16):4615-4618, 2002.
SINGLETON, V.; ROSSI, A. Colorimetry of total phenolics with phosphomolybdic-phosphotungstic acid reagent.
American Journal of Enology and Viticulture, 16(3):144-158, 1965.
SRDIć-RAJIć, T.; KONIć RISTIć, A. Antioxidants: Role on health and prevention. Encyclopedia of Food and Health, 227-233, 2016. TIWARI, B. K. et al. Stability of anthocyanins and ascorbic acid in sonicated strawberry juice during storage. European Food Research and Technology, 228(5):717-724, 2009. TIWARI, B. K.; MASON, T. J. Ultrasound Processing of Fluid
Foods. In Novel Thermal and Non-Thermal Technologies for Fluid Foods. London: Elsevier Science, 2012. p.135-165. TOMADONI, B. et al. Effect of ultrasound and storage time on quality attributes of strawberry juice. Journal of Food Process Engineering, 40(5):1-8, 2017.
WANG, J. et al. Influence of high-intensity ultrasound on bioactive compounds of strawberry juice: Profiles of ascorbic acid, phenolics, antioxidant activity and microstructure. Food Control, 96:128-136, 2019a.
WANG, J.; VANGA, S. K.; RAGHAVAN, V. High-intensity ultrasound processing of kiwifruit juice: Effects on the ascorbic acid, total phenolics, flavonoids and antioxidant capacity. LWT - Food Science and Technology, 107:299-307, 2019b. YAo, L. H. et al. Flavonoids in food and their health benefits.
Plant Foods for Human Nutrition, 59(3):113-122, 2004. zAFRA-ROJAS, Q. Y. et al. Effects of ultrasound treatment in
purple cactus pear (Opuntia ficus-indica) juice. Ultrasonics Sonochemistry, 20(5):1283-1288, 2013.
zHANG, H.; YANG, J.; zHAO, Y. High intensity ultrasound assisted heating to improve solubility, antioxidant and antibacterial properties of chitosan-fructose Maillard reaction products. LWT - Food Science and Technology, 60(1):253-262, 2015. zOU, Y.; HOU, X. Sonication enhances quality and antioxidant activity of blueberry juice. Food Science and Technology, 37(4):599-603, 2017.