CFD Based Wind Assesment in West of Turkey
I1hami COLAK
Istanbul Gelisim University, Faculty of Engineering and Architecture, Istanbul, Turkey
Melike Selcen A Y AZ Faculty of Technology Dep.of Energy Systems Eng. Gazi University
Kurtulu� BORAN Faculty of Technology Dep.of Energy Systems Eng. Gazi University
Ankara, Turkey
Abstract-Wind is an important renewable source which has a large potential all around the world. Recently, wind energy has been quite popular and owns a growing market in Turkey. This expansion brings more investigation around the country, to specify the most suitable sites for wind development. In this study, a CFD
(Computational Fluid Dynamics) software for wind resource assessment, called Meteodyn, is used to make an assessment in the west of Turkey. Meteodyn uses Navier-Stokes equations while making the calculations. This study is focused on the wind mapping of a particular region called Kocatepe, Manisa. The reference meteorological data is supplied from a met mast 65 meters height, measured for one year time period. The wind characteristics of the site is investigated by using the meteorological wind data from wind sensors at 30m and 50m levels of the measurement mast, and the software calculates the wind parameters of the selected site. Therefore the appropriate locations for installation of the wind turbines will be selected.
Keywords-component; wind energy, Turkey wind assesment, CFD wind modelling
I. INTRODUCTION
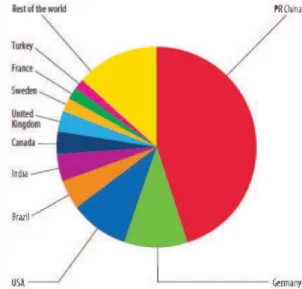
The rise in renewable energy power plants is appearing to be stronger day to day, while the amount of conventional energy sources like coal, oil and gas have been diminishing. The reports show that oil reserves will drain away in 50 years, gas reserves in 70 years and coal reserves are consumed away completely in 200 years. The lack of energy sources in the future, lead the world wind energy sector to make a move from the beginning of the year 1996. The leader countries in the world wind energy sector is China, United States and Germany, who are followed by Spain and India. Table 1 shows the latest global cumulative installed wind capacity statistics.
'IlI.oooMW
351J,000 ... ... ... ... ... .... · ... · ... ... ... iJ8,I96·
300,000
...
.... ·-11l,l�1 ..
��
2
�
·
==
;.i
iiii
'l
ll
l
1997 I9'JI 1999 1000 2001 1001 1003 l� IOGI 111110 1007 111118 1009 1010 lOll 101! lOll
,""
Fig. 1. Global Cumulative Installed Wind Capacity 1997-2014
Ankara, Turkey
In Turkey the wind energy assessment started from the year 1997, correspondingly to the world market. Today, total installed power capacity in Turkey is above 55 GW consisting of coal, gas, renewables, etc. Besides the total capacity, wind energy has a small but ever increasing share. From Table 2, it is seen that Turkey has entered the wind energy scale with a rate of 1.6 in the year 2014.
PRChlna
India
Brazil
USA '--- Germany
Fig. 2. Top 10 New Installed Capacity in World (Jan-Dec 2014)
It is estimated by Turkey's General Directorate of Renewable Energy that Turkey has 48 GW techno-economic wind energy potential. According to Turkish Wind Energy Association 2014 Report, total installed wind power capacity is at % 6 of overall potential, corresponding to 3.2 GW. Turkey's 2023 target in energy is to rise the electric generation with more participation of renewable up to 30%, especially wind power expected to increase 20 GW capacity [1].
II. METHODOLOGY
A. The Navier-Stokes equations
The CFD wind resource assesment software Meteodyn WT, makes the calculations of Fluid Mechanics, with the Navier Stokes equations for the mass and momentum conservations.
4th International Conference on Renewable Energy Research and Applications Palermo, Italy, 22-25 Nov 2015
The flow is assumed steady and the fluid incompressible, therefore the equations are:
� +.!!!.... + aw =0
ax ay az (I)
On a cartesian frame consisting of x, y (horizontal) and z (vertical) coordinates, U, V, W are the mean wind vector constituents. u, v, and w are the turbulence fluctuations constituents where P is the mean pressure value and p the air density [2].
The other important calculation used in the software is the turbulence kinetic energy transport equation which is given by:
(5)
Where the turbulent viscosity (VT), is accepted equal to the square root of the turbulent kinetic energy (k) multiplied by a turbulent length scale (LT), which changes with stability[3].
VT = k1/2LT (6)
The dissipation is given by:
- C uT k d P -v:
(
aUi aUj)
aUjE- 11- an -
-+--Li ' k T axj axi axj (7)
Where CIl is a coefficient depending on the atmospheric stability through Richardson flux number[4].
B. Site Modeling
In this study, the wind characteristics of the site is investigated by using the meteorological wind data from wind sensors at 2 different levels on the met mast; 30 m, 50 m and 65 m, and wind direction at two levels 28 m and 63 m. Meteodyn WT CFO software is used to create a wind map of the site. International available roughness (CLC 2006) and topographical data (SRTM) were used for this study[5],[6]. CLC database (Corine Land Cover, CLC2006, 20 m resolution) which provides reliable information on land cover variations since a long time through Europe. SRTM exists of a specific radar system that completed an eleven day tour on the Space Shuttle Endeavour in February, 2000. SRTM is an international project organized by the National Geospatial-Intelligence Agency (NGA) and the
characteristics according to the methodology. The vertical wind profile is calculated through using three levels measurement data, considering thermal stability of the site. For the wind farm configuration the wind regime at the location up to 100 meters of the wind turbine are calculated.
a) Location of the Site
Figure 1 illustrates the coordinates of the met mast location, at the west of Turkey, Kiraz village in Manisa province. A map with a radius of 10 km was created (with the center being the center of the projected wind farm) with iso-elevation lines of 10 m at Google Earth program. The width of the area is selected larger from the mat mast point, in order to make better calculations at the roughness level and when investigating a complex terrain. The mast is located at a hill which is representing the site.
Fig. 3. Kocatepe, Manisa site location
b) Roughness and Terrain Data
The topography data comes from the Shuttle Radar Topography Mission (SRTM) where the nearest global scale's elevation data is selected to product the Earth's high-resolution digital topographic databes [6]. Figure 2 represents the orography map of the site. The red points illustrate the horizontal and vertical axe coordinaates of the measurement masts. The legend shows the elevation above the sea level, coloured dark green 156-200 meters (from the lowest altitute) to the dark brown 1000-1030 meters (the highest altitute).
Fig. 4. Orography map ofthe site
The roughness of the land surface is an important parameter in calculating the wind flow. Usually, if the roughness of the earth's surface increases, the wind will also slow down. Forests and large cities obviously slow the wind down considerably, while smoother surfaces will have less influence on the wind. For this study a roughness map was created using Corine Land Cover (CLC) and modified while calibrating the site. A map with a radius of 16 km was created and can be found
in Figure 3. The legend shows the roughness level, coloured from dark green (the highest value) to the brown (the lowest value).
Fig. 5. Roughness map of site
2) Data Analysis
a) Direction of the wind
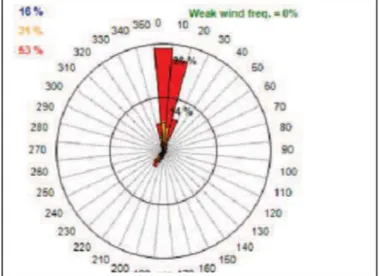
A wind rose is a short but the point to specify the wind speed and direction and how it is distributed at a specific site. The wind rose illustrates the frequency of winds blowing from different directions In a rounded graph. The length of each "spoke" around the graph is associated with the frequency of time that the wind blows from a specific direction [7]. Figure 6 illustrates the helps to find the most efficient direction to place the turbines. The blue color represents the wind speed frequency between 0-4 mis, orange color 4-8 mls and the red color 8 mls and above. These wind roses also provide details on speeds from different directions. As shown, the prevailing wind direction is between 0-20 degrees.
Fig. 6. Wind rose ofthe site
b) Wind Speed Histogram
The wind speed histogram corresponds to the frequency distribution of wind speed. Figure 7 compares the wind frequency versus the wind speed. The blue color represents the wind speed between 0-4 mis, orange color 4-8 mls and the red color 8 mls and above. The green line shows the appropriate Weibull distribution line, constituted from the weibull parameters shape and scale. The mapping is defined as a regular grid where you will obtain your results. Mean wind speed of all data is calculated 8.3 mls for all directions.
4th International Conference on Renewable Energy Research and Applications Palermo, Italy, 22-25 Nov 2015 '" 10 D 1 1 3 • I I 7 , • 10 11 12 11 14 " 11 11 I. tI lO 21 Z2 "' .. Fig. 7. data
Wind speed histogram and best Wei bull fit for the measurement
III. WIND MAPPING
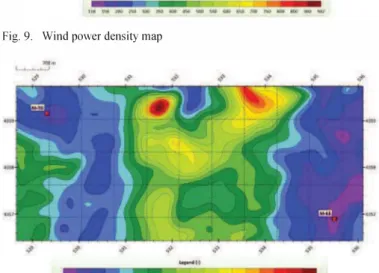
The wind mapping is defined as a regular grid where the results can be obtained. The wind maps are essential to clarify the suitability for installing the turbines. They are consisted of contour lines, which can determine the velocity profile, power The wind mapping is defined as a regular grid where you will obtain your results. The wind maps are essential to clarify the suitability for installing the turbines. They are consisted of contour lines, which can determine the velocity profile, power density profile and turbulence intensity profile of the site. Figure 8 represents the mean wind speed map of the site. The legend starts with the lowest wind velocity coloured with purple, from the value 4.7 m/s. This value increases up to the value of 9.7 m/s for this site. It is clearly seen from Figure 8, the met mast is situated in the most efficient area for the installation. Figure 9 represents the wind power density between the values 118- 942 W/m2. The met mast is located in the most efficient area of the site location. Finally Figure 10
re
���
.��
�ts the turbulence intensity map.Fig. 8. Mean wind speed map
"'.
L... ___ .... J
Fig. 9. Wind power density map
Fig. 10. Turbulence intensity map
IV. CONCLUSIONS
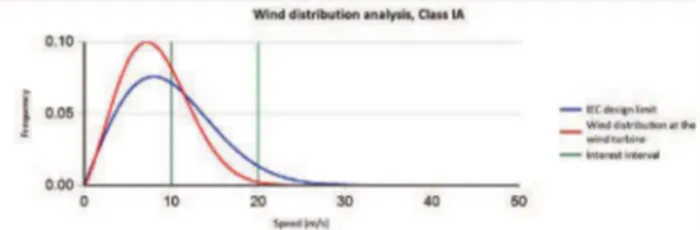
In this study, the main variable of the turbines, wind, is investigated through the program named Meteodyn with CFD calculations. It is a vital step to consider the site wind velocity, power density, turbulence intensity and wind direction parameters before the installation of the turbine. According to Meteodyn, the wind distribution class of this selected site is determined as Class IA according to IEC standarts. Figure 11 illustrates the wind distribution at the selected site with red line and the IEC design limit with the blue line. The figure shows that the selected site is a quite suitable location for the turbine according to the distribution analysis between frequency and speed parameters. The site is possible to be included into Class lA, and when the wind velocity exceeds 13 m/s it may be considered in a lower level, class lB. In both conditions, the wind class of this location is carried out to be convenient for the wind investment. With this study, the feasability work is completed in a large extent. Turkey has a big potential in wind, and to broaden the installed wind capacity, it is a neccesity to make more investigations in this area.
Fig. 11. Wind Distribution Analysis
ACKNOWLEDGMENT
This research was supported/partially supported by Ucyel Energy, Ankara, Turkey. We thank our colleagues from Ucyel Energy who provided insight and expertise that greatly assisted the research by their knowledge and products.
REFERENCES [1]
2015. [2] [3]
TWEA. "Wind Energy Statistics Report_January 2015," Meteodyn, 'Technical note - meteodyn WT."
C. Bezault, G. Dupont, and C. Weaver, "Use of CFD Model for vertical wind extrapolation in complex terrain," no. 1, pp. 1--6. [4] T. Clarenc, W . . Tian, and K. Fahssis, "Validation of Meteodyn wt on a hebei province wind farm project(China)," pp. 1-7. [5] European Environment Agency, "Corine Land Cover 2006 seamless vector data." [Online]. Available: http://www .eea. europa.eu/ data-and -maps/ datal cl c-2006-vector-data version-3.
[6] NASA, "Shuttle Radar Topography Mission." [Online]. Available: http://www2.jpl.nasa.gov/srtmlturkey.html.
[7] NRCS, "Wind Rose Data." [Online]. Available: http://www.wcc.nrcs.usda.gov/climate/windrose.html.