THE COMPETITIVENESS OF
THE TURKISH IRON AND STEEL INDUSTRY
IN THE PROCESS OF MEMBERSHIP
TO THE EUROPEAN UNION
KORAY GÜNAY
IŞIK UNIVERSITY 2008 K. GÜNAY Ph.D. Thesis 2008THE COMPETITIVENESS OF
THE TURKISH IRON AND STEEL INDUSTRY
IN THE PROCESS OF MEMBERSHIP TO THE EUROPEAN UNION
KORAY GÜNAY
B.S., Metallurgical and Materials Engineering, Middle East Technical University, 1996 M.A., Business Administration, Işık University, 2002
Submitted to the Graduate School of Social Sciences in partial fulfillment of the requirements for the degree of
Doctor of Philosophy in
Contemporary Management
IŞIK UNIVERSITY 2008
THE COMPETITIVENESS OF THE TURKISH IRON AND STEEL INDUSTRY IN THE PROCESS OF MEMBERSHIP TO THE EUROPEAN UNION
Abstract
The iron and steel industry is one of the leading industries in Turkey. By means of capacity and volume in international trade, Turkey is among the leading countries in the world. Therefore sustaining the competitiveness of the Turkish iron and steel industry has an utmost importance.
This thesis investigates several issues related to the competitiveness of the Turkish steel industry especially while Turkey is on the way to be a member of the European Union. The main aim of this thesis is to develop a competitiveness model and to prove the relations between the factors of the model and competitiveness. Further than that, the importance of each factor of the model is tried to be find out. Another aim of the thesis is to find ways and means to increase the competitiveness of the Turkish steel industry.
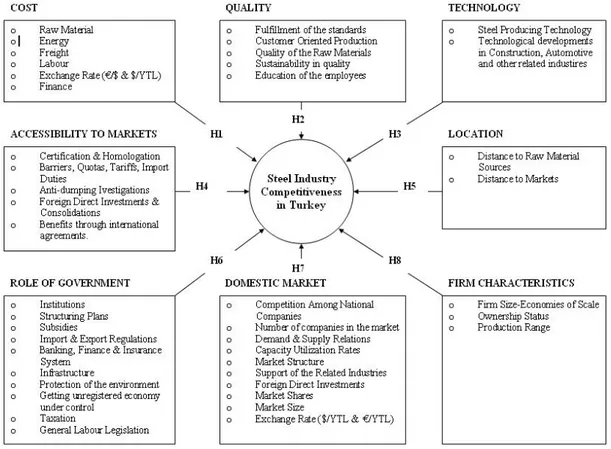
Based on the literature survey on competitiveness, a competitiveness model for the steel industry in general is developed. The factors are: Cost; Quality; Technology; Accessibility to Markets; Location; Role of Government; Domestic Market and Firm Characteristics. The relation of these factors and the competitiveness is investigated through a 21 question-questionnaire, that the executives of the Turkish steel industry have attended.
According to the findings, all eight factors are find to be in positive relation with the competitiveness of the Turkish steel industry. In addition to that the importance of each factor for the crude steel producers and Re-rollers are found. It is also found, that the Turkish steel industry has to focus more on the higher value-added products, invest to balance the long-flat production ratio, reduce energy costs, and focus on vertical integration to supply its own raw materials for Re-rollers and integrated mills.
AVRUPA BİRLİĞİNE ÜYELİK SÜRECİNDE TÜRK DEMİR ÇELİK SEKTÖRÜNÜN REKABETÇİLİĞİ
Özet
Demir çelik sektörü Türkiye’nin önde gelen sektörleri arasındadır.Gerek kapasite gerekse de uluslarası pazarlardaki ticaret hacmi ile dünyanın sayılı demir çelik endüstrileri arasında yer almaktadır. Bu yüzden Demir Çelik sektörünün rekabetçiliğini koruması aşırı önem arz etmektedir.
Bu tez, Demir Çelik endüstrisinin, özellikle Avrupa Birliğine giriş sürecinde, rekabetçiliğini incelemektedir. Tezin esas amacı rekabet gücünü etkileyen faktörleri bularak bunlardan bir model oluşturmak, aralarındaki pozitif ilişkiyi ispatlamak ve daha da önemlisi her bi faktörün rekabetçiliği ne oranda etkiledigini bulmaktır. Tezin diğer bir amacı ise Türkiye’nin sektörel rekabetçiliğini arttırmak için olası çözümler getirmektir.
Literatür araştırması sonucunda rekabet modeli oluşturulmuştur. Modeli oluşturan faktörler Maliyet, kalite, Teknoloji, Pazarlara Erişim, Lokasyon, Devletin Rolü, İç Pazar, ve Firma Karakteristikleridir. Bu faktörlerle rekabet gücü arasındaki ilişki, sektörün üst düzey yöneticilerine gönderilen 21 soruluk bir anket yardımı ile araştırılmıştır.
Araştırmanın sonuçları tüm faktörlerin Türk Demir Çelik sektörünün rekabet gücünü pozitif yönde etkilediğini göstermiş olup, her bir faktörün çelik üreticileri ve haddeciler açısından etkisi saptanmıştır. Bunun yanısıra sektörün rekabet gücünü arttırmak için daha katma değerli ürünler üretilmesi, uzun-yassı ürün dengesizliğini giderecek yatırımlar yapılması, eneji maliyetlerini düşürecek değişiklikler yaptırılması ve özellikle haddeciler ve entegre fabrikalar için kendi hammaddelerini tedarik edebilecekleri yatırımlara gidilmesini gerektiği ortaya çıkmıştır.
Acknowledgements
I am deeply indebted to my supervisor Prof. Dr. Sema Kalaycıoğlu, whose help, driving force, suggestions and encouragement helped me in all the time of research and writing this thesis.
I would like to give my special thanks to my family. Without their understanding and support I could not come so far. And I would like to thank to our General Manager Mr. Uğur Dalbeler and Dr. Veysel Yayan, the Secretary General of the Turkish Iron and Steel Producers Association, for their support and sharing necessary information for the thesis.
I would like to express my gratitude to Prof Dr. Sıddık Yarman for broadening my vision.
And I would like to express my thanks to the representatives of the Turkish steel industry for their interest and sharing their valuable knowledge by responding to the survey.
Table of Contents
Abstract ii
Özet iii
Acknowledgements iv
Table of Contents v
List of Figures ix
List of Tables
xii
List of Abbreviations xvi
1. Introduction 1
1.1. Research Question ... 3
1.2. Hypothesis ... 3
1.3. Model ... 4
2. Theories and Approaches of Competitiveness 6
2.1. Competitiveness in General ... 6
2.2. Theories about the National Competitiveness ... 7
2.2.1. Comparative Advantage Theory – by David Ricardo (1817) ... 7
2.2.2. Factor Endowments Theory – by Heckscher & Ohlin (1933) ... 9
2.2.3. Leontief Paradox – by Wassily Leontief (1953) ... 11
2.2.4. Revealed Comparative Advantage – by Bela Balassa (1965) ... 12
2.2.5. Product Cycle Theory – by Raymond Vernon (1966) ... 14
2.2.6. Country Similarity Theory – by Stefan Linder (1961)... 16
2.2.7. The Economies of Scale Theory – by Krugman & Lancaster (1979) .... 18
2.2.8. Location Theory – by Alfred Weber (1909) ... 21
2.2.9. The Diamond Model – by Michael Porter (1990) ... 24
2.3. Factors Affecting National Competitiveness ... 27
2.4. Methods to Measure the National Competitiveness ... 29
2.4.1. Trade and International Market-Share Indicators ... 29
2.4.1.1. Revealed Comparative Advantage (RCA) ... 29
2.4.1.2. The Michaely Index ... 30
2.4.1.3. Contribution to the Trade Balance (CTB) ... 30
2.4.1.4. Comparative Export Performance (CEP) ... 31
2.4.1.6. Export Similarities (ES) ... 32
2.4.2. Productivity and Cost Indicators ... 32
2.4.2.1. Total Factor Productivity (TFP) ... 33
2.4.2.2. Unit Labour Cost (ULC) ... 33
2.4.2.3. Relative Unit Labour Cost (RULC) ... 33
3 The EU Steel Industry 34
3.1 The EU Steel Industry in General ... 34
3.2 Current State of the EU Steel Industry ... 39
3.2.1 Position of the European Union Steel Industries from Global Perspective ... 41
3.2.2 Production in the EU steel Industry ... 49
3.2.2.1 Production Techniques (Technology Base) ... 49
3.2.2.2 Quantities produced ... 52
3.2.2.3 Capacity Utilization Rates... 53
3.2.2.4 Productivity levels ... 54
3.2.2.5 Area of Focus on the Steel Production in EU ... 58
3.2.3 Consumption in the EU ... 58
3.2.3.1 Customer Base in the EU Steel Industry ... 61
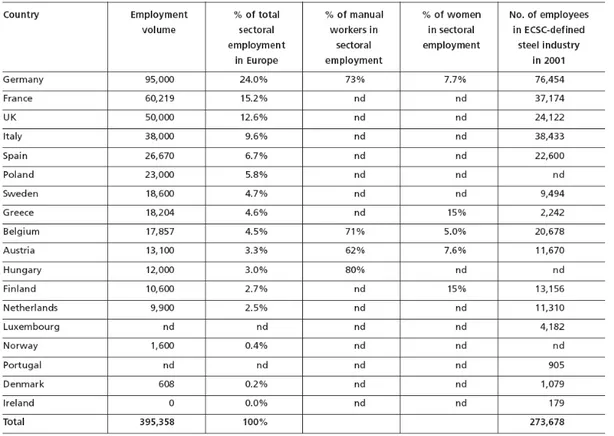
3.2.4 Employment in the EU Steel Industry ... 62
3.2.4.1 Structure and volume of employment ... 62
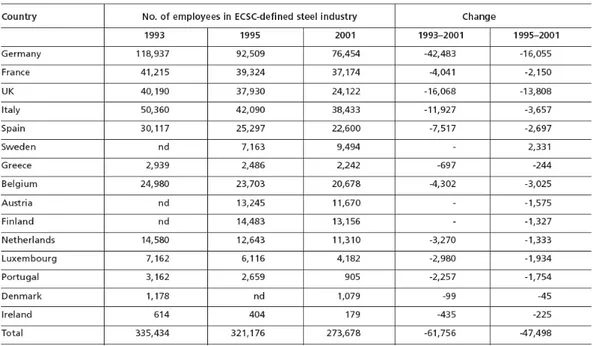
3.2.4.2 Job Losses in the Industry ... 64
3.2.5 Factors Affecting the Cost of the Product in the European Steel Industry ... 67 3.2.5.1 Raw Material ... 67 3.2.5.2 Energy ... 72 3.2.5.3 Freight ... 76 3.2.5.4 Labour ... 77 3.2.5.5 Exchange Rate ... 79 3.2.6 Company structure ... 80
3.2.7 Role of the Government ... 81
3.2.7.1 Deregulation ... 81
3.2.7.2 Support Measures During Restructuring (Subsidies) ... 83
3.2.7.3 Initiatives on CO2 Emissions ... 85
3.2.7.4 Relationships with Social Partners ... 88
3.2.8 Enlargement of the European Union and the Effect of New Members on the European Steel Industry ... 89
3.3 Accessibility to the European Market ... 93
3.3.1 Certification & Homologation ... 94
3.3.2 Quotas, Import Duties & Anti-Dumping Duties ... 100
3.4 Main Challenges for the EU Steel Industry ... 102
3.4.1 The Growing Impact of Globalisation ... 102
3.4.2 Matching Steel Supply and Demand ... 104
3.4.3 New EU Environmental Regulations ... 108
3.4.4 EU Enlargement ... 110
3.5 Actions to Enhance a Sustainable Competitiveness within a Global Perspective ... 112
3.5.1 Reinforcing the Human and Technological Bases for a more Innovating
Steel Industry ... 112
3.5.2 Ensuring a Level Playing Field within the EU and Globally ... 113
3.5.3 Promoting Industrial Co-operation with Third Countries ... 114
3.5.4 Improving Co-operation between Main Stakeholders ... 114
3.6 Substitutes for Steel... 116
4
The Turkish Steel Industry 118
4.1 The Turkish Steel Industry in General ... 118
4.1.1 Industry Segmentation in the Turkish Steel Industry ... 123
4.2 The Current State of the Turkish Steel Industry ... 126
4.2.1 Demand and Supply in the Turkish Steel Industry ... 126
4.2.2 Production ... 128
4.2.2.1 Quantities produced ... 129
4.2.2.2 Capacity Utilization Rates... 130
4.2.2.3 Productivity Levels ... 132
4.2.2.4 Area of Focus on the Steel Production in Turkey ... 134
4.2.3 Consumption ... 136
4.2.3.1 Customer Base in the Turkish Steel Industry ... 138
4.2.4 Employment in the Turkish Steel Industry ... 138
4.2.5 Factors affecting the Cost of the Product ... 139
4.2.5.1 Raw Material ... 139
4.2.5.2 Energy ... 142
4.2.5.3 Freight ... 146
4.2.5.4 Labour ... 147
4.2.5.5 Exchange Rate ... 148
4.2.6 Role of the Government ... 149
4.2.6.1 The Institutional Framework of the Turkish Industry ... 149
4.2.6.2 Deregulation ... 151
4.2.6.3 Support Measures During Restructuring (Subsidies) ... 153
4.2.7 Effects of the EU Accession Period on the Turkish Steel Industry ... 155
4.2.7.1 National Restructuring Program ... 155
4.2.7.2 Harmonization with the Customs Tariff System of EU ... 156
4.2.7.3 Harmonization with Environmental Standards ... 156
4.2.7.4 Climate Change Framework Convention ... 157
4.2.8 The State of the Turkish Steel Industries in Foreign Trade ... 158
4.3 Accessibility to Markets ... 163
4.3.1 Certification & Homologation ... 163
4.3.2 Quotas, Import Duties & Anti-Dumping Duties ... 165
4.4 Main Challenges for the Turkish Steel Industry and SWOT Analysis .... 168
4.5 Actions to Enhance a Sustainable Competitiveness... 170
5
Research on the Turkish Iron and Steel Industry 174
5.1 Research Design and Methodology ... 174
5.1.1 Research Objectives ... 174
5.1.2 Research Questions ... 174
5.1.3 Model ... 175
5.1.5 Questionnaire Development and Data Collection Method ... 176
5.1.6 Sampling ... 179
5.1.7 Data Analysis Methodology ... 182
5.2 Findings of the Research ... 185
Conclusion 229
References
243
Appendix A Figures and Tables
254
Appendix B Questionnaire
261
List of Figures
Figure 1.1 Competitiveness Model of the Turkish Steel Industry ... 4
Figure 1.2 Competitiveness Model of the Turkish Steel Industry in detail ... 5
Figure 3.1 Geographical Distribution of Steel Production and Consumption, 2006 41 Figure 3.2 World crude steel production (mt) ... 42
Figure 3.3 Demand growth in steel - Forecast 2006 – 2015 ... 43
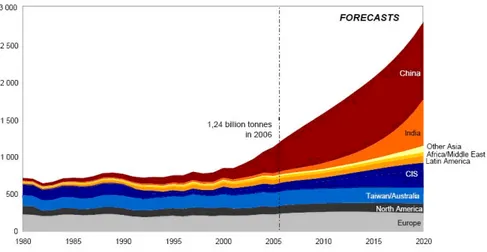
Figure 3.4 Crude Steel production 1980 – 2020f (mt) ... 44
Figure 3.5 Net Export Position of China (mt) ... 47
Figure 3.6 Crude Steel Production Growth Rate (%) ... 47
Figure 3.7 EU15 Manufacturing Industries, Value Added (€ million) 1981&2001 .. 55
Figure 3.8 EU15 Persons Employed by Manufacturing Sector (in thousands) 1981&2001 ... 55
Figure 3.9 Turnover per Person Employed (€ 000) – EU25 1999 - 2003 ... 57
Figure 3.10 Gross Value Added per Person Employed (€ 000) – EU25 1999-2003 . 57 Figure 3.11 Apparent Steel Consumption (million tones) 1996 – 2007 ... 60
Figure 3.12 Main Uses of steel in the EU - 2005 ... 62
Figure 3.13 EU Receipts of Imported Iron Ore... 67
Figure 3.14 Seaborne Iron Ore Demand ... 68
Figure 3.15 Seaborne Metallurgical Coal Demand ... 69
Figure 3.16 EU Scrap Consumption (million tones) ... 70
Figure 3.17 Scrap Imports and Exports (million tones) ... 70
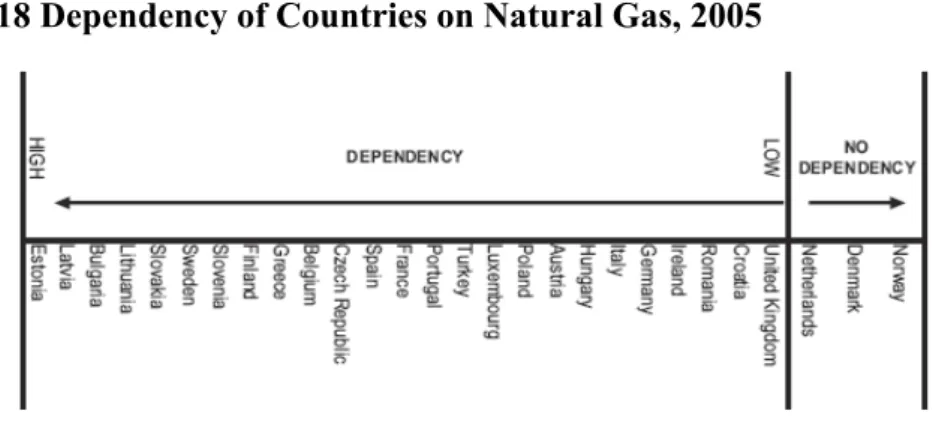
Figure 3.18 Dependency of Countries on Natural Gas, 2005 ... 74
Figure 3.19 Dependency of Countries on Electricity, 2005 ... 74
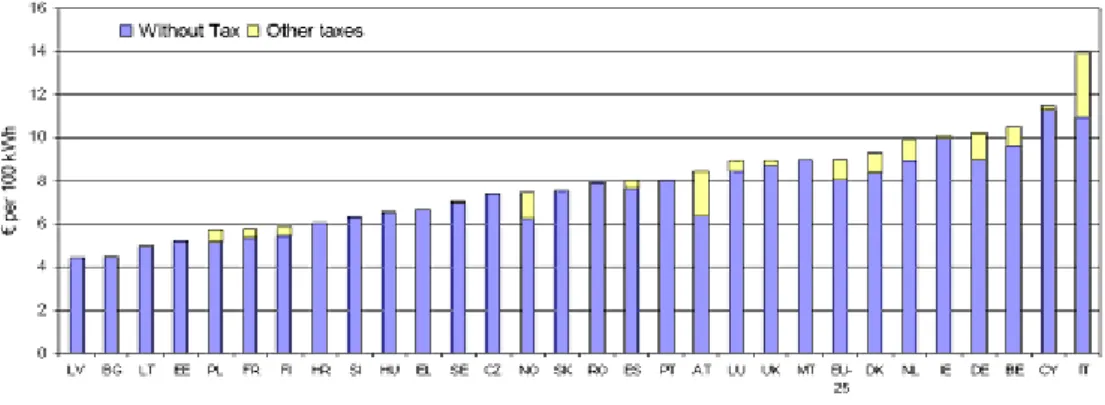
Figure 3.20 Composition of Electricity Prices for Industrial Consumers on 1 July 2006 ... 75 Figure 3.21 Composition of the gas prices for industrial consumers on 1 July 2006 75
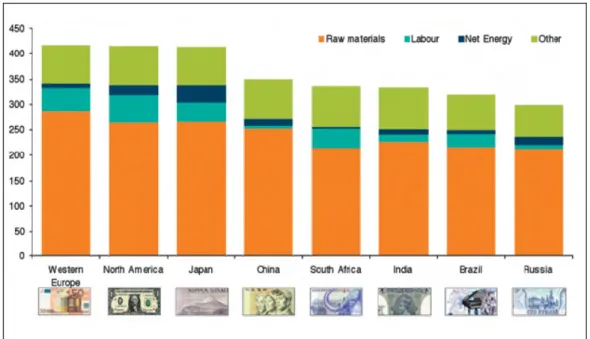
Figure 3.22 Differences of costs among main steel producing countries for hot rolled
coil production ... 77
Figure 3.23: Hourly labour costs manufacturing (US$)/(Euros) ... 78
Figure 3.24 Producer Breakdown by Ownership – 2000 & 2007 ... 80
Figure 3.25 EU Crude Steel Production - 2006 ... 90
Figure 3.26 GDP and Steel Demand, 1995 - 2005 ... 105
Figure 3.27 Steel Demand Growth by Region, 2000 - 2005 ... 106
Figure 3.28 Announced Crude Steel Capacity Expansion in million metric tones, by Region ... 107
Figure 3.29 EU Crude Steel Production 2006 ... 110
Figure 4.1 Development of Steel Production Capacity in Turkey ... 119
Figure 4.2 Steel Industry Value Chain ... 124
Figure 4.3 Distribution of the hot-rolling capacity by process ... 125
Figure 4.4 Distribution of the Hot-Rolling Capacity by Products ... 126
Figure 4.5 Product Mix – End Product by Country (%) ... 128
Figure 4.6 Hot-rolling Capacity by Region (2005) ... 129
Figure 4.7 Total Factor Productivity Analysis for the Turkish Steel Industry ... 133
Figure 4.8 Labour Productivity and Employment by Sector ... 134
Figure 4.9 Finished steel consumption and production - 2007 ... 137
Figure 4.10 Crude steel consumption per capita 2001- 2006... 137
Figure 4.11 Scrap Prices in Rotterdam on FOB Basis (USD/mt) 2006 - 2008 ... 141
Figure 4.12 Imports of Scrap 2001- 2007 ... 141
Figure 4.13 Industrial and Residential Electricity Prices in Turkey ... 144
Figure 4.14 Energy demand and supply in Turkey (1973-2020) ... 145
Figure 4.15 Gas Prices for Industrial Consumers in IEA Countries (2003) ... 145
Figure 4.16 Iron ore Freight Rates (1996 – 2007) ... 146
Figure 4.17 Automotive Diesel Prices and Taxes ... 147
Figure 4.18 Exchange Rate Adjusted Unit Labour Costs in the Manufacturing Sectors ... 148
Figure 4.19 The Labour Costs per Hour in the Steel Industry ... 148
Figure 4.20 USD/YTL and EUR/YTL Exchange Rate Statistics ... 149
Figure 4.21 World Top Steel Exporters and Importers ... 158
Figure 4.22 Export of Steel Products in Turkey ... 159
Figure 4.24 Export of Steel Products and Distribution of Long Products Exports by
Regions ... 164
Figure 5.1 Competitiveness Model of the Turkish Steel Industry ... 175
Figure 5.2 Competitiveness Model of the Turkish Steel Industry in detail ... 175
Figure 5.3 Mathematical Model for an n-Dimensional System ... 182
Figure 5.4 Shematic Illustration of the Equation for the Steel Industry Competitiveness Model ... 183
List of Tables
Table 2.1 International Trade Figures of Turkey with EU(25) Countries ... 17
Table 3.1 World Steel Trade by Area (million metric tones), 2005 ... 44
Table 3.2 World Iron Ore Trade by Area (million metric tones), 2006 ... 45
Table 3.3 Crude Steel Production in EU 25 1997 – 2006 ... 52
Table 3.4 Crude Steel Production in Europe except EU 1997 – 2006 ... 52
Table 3.5 Crude Steel Production in World 1997 – 2006 ... 53
Table 3.6 Capacity Utilisation in crude steel production plants in EU (15) 1993 – 2002 ... 54
Table 3.7 Crude Steel Consumption (kg/person) in EU (15) 1999 – 2003 ... 60
Table 3.8 Production and Apparent Steel Consumption (million mt) in EU-2005 .... 61
Table 3.9 Employment in European Steel Sector - 2005 ... 63
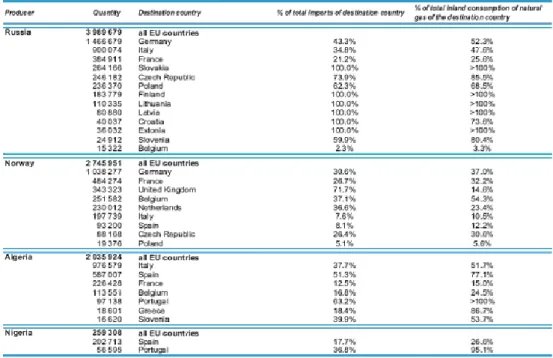
Table 3.10 Employment Change in the EU15 Steel Sector between 1993 and 2001 65 Table 3.11 Main Natural Gas suppliers to the European Union, 2004 (in TJ-GCV) . 73 Table 3.12 Consumption of Finished Steel Products, 2003 – 2009 and 2014 – The World ... 91
Table 3.13 Finished Steel Consumption per Capita, 2003 – 2014 – The World ... 92
Table 3.14 European National Standards for Reinforcing Bars ... 95
Table 3.15 Some Differences in the Rebar Performance Parameter Ranges ... 95
Table 3.16 Mandatory and Voluntary Clauses in EN 10080 ... 97
Table 4.1 The Ranking of top 20 Countries in 2006 and 2007 acc. to their Crude Steel Productions ... 120
Table 4.2 Installed Capacity Distribution by Products (000 tons) ... 121
Table 4.3 Export – Import Figures for 2006 – 2007 on the Basis of Products ... 123
Table 4.4 Production and Consumption of Finished Steel Products 1991 – 2007 ... 127
Table 4.6 Turkey’s Crude Steel Production Capacity and Capacity Utilisation Rate
2000-2007 ... 131
Table 4.7 Employment in Steel Making Industry ... 139
Table 4.8 Scrap Import of Turkey by Countries 2002 – 2007 ... 140
Table 4.9 Turkey’s Import of Raw Materials 2002 – 2007 ... 142
Table 4.10 Average Electricity Price for Industrial Consumers (2005)... 144
Table 4.11 Estimated Cost of Restructuring Process and Required State Aid ... 154
Table 4.12 The Export and Import of Total Iron and Steel Products ... 160
Table 4.13 Iron and Steel Exports of Turkey by means of Harmonised System Codes (million USD) ... 161
Table 4.14 Iron and Steel Imports of Turkey by means of Harmonized Tariff Schedule Codes (million USD) ... 161
Table 4.15 Intra-industry Trade Index Scores for the Turkish Iron and Steel Industry by means of Harmonized Tariff Schedule Codes ... 162
Table 4.16 Customs Duty Rates for Iron and Steel Products in Turkey ... 167
Table 5.1 Capacities of companies in the Turkish Steel Industry ... 179
Table 5.2 Capacities of companies in the Turkish Steel Industry responded to the survey ... 180
Table 5.3 Companies responded to the survey ... 181
Table 5.4 Sample Table to Compute the Weighted Average of Factor Preferencies Wi ... 184
Table 5.5 Usage of Raw Materials by Producer Groups ... 186
Table 5.6 Products by Producer Groups ... 187
Table 5.7 Age of the Company Cross-Tabulation ... 188
Table 5.8 Production Capacity Cross-Tabulation ... 190
Table 5.9 Number of Employees in Companies Cross-Tabulation ... 190
Table 5.10 Legal Structures of Companies Cross- Tabulation ... 191
Table 5.11 Percentage Share of Raw Material among Sources Cross-Tabulation .. 192
Table 5.12 Percentage Shares of Markets for the Sales and Type of Producer Cross- Tabulation ... 193
Table 5.13 Ranking of Foreign Raw Material Sources for Crude Steel Producers . 194 Table 5.14 Ranking of Foreign Raw Material Sources for Re-rollers ... 194
Table 5.15 The Arithmetic Means of Percentage of Raw Material Sources and Sales Markets for Crude Steel Producers and Re-rollers ... 195
Table 5.16 Percentage Shares of Raw Material Sources and Sales Markets of Crude
Steel Producers and Re-rollers ... 196
Table 5.17 Independent t-test for Percentages on Raw Material Sources and Sales Markets of Crude Steel Producers and Re-rollers ... 196
Table 5.18 Import Markets of Crude Steel Producers and Re-rollers ... 197
Table 5.19 Independent t-test for Import Markets of Crude Steel Producers and Re-rollers ... 198
Table 5.20 Ranking of Export Markets for Crude Steel Producers ... 198
Table 5.21 Ranking of Export Markets for Re-Rollers ... 199
Table 5.22 Export Markets of Crude Steel Producers and Re-rollers ... 200
Table 5.23 Independent t-test for Export Markets for Producer Groups ... 200
Table 5.24 Percentage Shares of Cost Items for Producer Groups ... 201
Table 5.25 Independent t-test for Percentages of Cost of Steel Producers and Re-rollers ... 201
Table 5.26 Percentage Shares of Cost Items ... 202
Table 5.27 Effect of Cost Items on the Competitiveness ... 203
Table 5.28 Importance of Cost Items by Producer Groups ... 203
Table 5.29 Effect of Quality Factors on the Competitiveness ... 205
Table 5.30 Importance of Quality Factors by Producer Groups ... 205
Table 5.31 Effect of Accessibility to the Markets Factors on the Competitiveness 206 Table 5.32 Importance of Accessibility to the Markets Factors by Producer Groups ... 207
Table 5.33 Effect of Technology Factors on the Competitiveness ... 207
Table 5.34 Importance of Technology Factors by Producer Groups ... 207
Table 5.35 Effect of Domestic Market Factors on the Competitiveness ... 209
Table 5.36 Importance of Domestic Market Factors by Producer Groups ... 209
Table 5.37 Effect of Role of Government Factors on the Competitiveness ... 212
Table 5.38 Importance of Role of Government Factors by Producer Groups ... 212
Table 5.39 Effect of Firm Characteristics Factors on the Competitiveness ... 213
Table 5.40 Importance of Firm Characteristics Factors by Producer Groups ... 214
Table 5.41 Importance of Location ... 216
Table 5.42 Importance of each Variable by Producer Groups ... 216
Table 5.44 Major Sectoral Constraints in Competitiveness for Crude Steel Producers and Re-rollers ... 219 Table 5.45 Sample Table to Compute the Weighted Average of Factor Preferencies Wi ... 220 Table 5.46 Scores and Weights of Factors in Competitiveness for Crude Steel
Producers and Re-rollers ... 221 Table 5.47 Weights of Factors in Competitiveness for Crude Steel Producers and Re-rollers ... 222 Table 5.48 Weights of Variables in the Competitiveness Model for Crude Steel Producers ... 224 Table 5.49 Weights of Variables in the Competitiveness Model for Re-rollers ... 225 Table 5.50 Solutions to enhance the competitiveness of the Turkish Steel Industry ... 227
List of Abbreviations
(AFCAB) Association Française de Certification des Armatures de Béton (ASW) Allied Steel and Wire
(BAT) Best Available Techniques
(BOF) Basic Oxygen Furnace
(BORÇELİK) Borcelik Çelik Sanayi Ticaret A.Ş
(CEEMET) The Council of European Employers of the Metal, Engineering and Technology-based Industries
(CEP) Comparative Export Performance (CET) EU Common External Tariff
(CIS) Common Wealth of Independent States (CTB) Contribution to the Trade Balance (ÇED) Çevresel Etki Değerlendirilmesi (ÇOLAKOĞLU) Çolakoğlu Metalurji A.Ş.
(DCUD) Turkish Iron and Steel Producers Association
(DRI) Direct Reduced Iron
(EAF) Electric Arc Furnace
(ECSC) European Coal and Steel Community (EESC) European Economic and Social Committee
(EFILWC) European Foundation for the Improvement of Living and Working
(EMF) European Metalworkers’ Federation (ERDEMİR) Ereğli Iron and Steel Works
(ES) Export Similarities
(ESTEP) European Steel Technology Platform (EU ETS) Emission Trading Scheme
(Eurofer) European Confederation of Iron and Steel Industries (GCC) Gulf Corporation Council
(HBI) Hot Briquette Iron
(IGQ) Instituto Italiano de Garanzia della Qualità per i Prodotti Metallurgici
(IISI) International Iron & Steel Institute
(IIT) Intra-Industry Trade
(IMMIB) Istanbul Mine and Metal Exporters Union (IPPC) Integrated Pollution Prevention and Control (ISDEMIR) İskenderun Iron and Steel Works
(ITC) U.S. International Trade Commission (KARDEMIR) Karabük Demir Çelik Sanayi ve Ticaret A.Ş.
(KOSGEB) Small and Medium Industry Development Organisation (MKEK) Makina Kimya Endüstrisi Kurumu
(NAP) National Allocation Plan (NRP) National Restructuring Plan
(OCAB) Organisation pour le Contrôle des Aciers pour Béton Armé
(OHC) Open Hearth Furnace
(PA) Privatization Administration (PHC) Privatization High Council
(RC) Revealed Competitiveness
(RCA) Revealed Comparative Advantage (RMA) Relative Import Advantage
(RTA) Relative Trade Advantage
(RTD) Research and Technological Developments (RULC) Relative Unit Labor Cost
(RXA) Relative Export Advantage
(SAC) Steel Aid Code
(SAW) Simple Additive Weight Method (SBS) Svensk Bygestalkontoll Stiftelse (SEE) State Economic Enterprises (SPO) State Planning Organization
(TDCI) Türkiye Demir ve Çelik İşletmeleri Genel Müdürlüğü A.Ş. (TESK) Confederation of Turkish Craftsmen and Tradesmen
(TFP) Total Factor Productivity (TSE) Turkish Standards Institution
(TÜBİTAK) The Scientific and Technical Research Council of Turkey (TÜSİAD) Turkish Industrialists’ and Businessmen’s Association (UKCARES) UK Certification Authority for Reinforcing Steels
(ULC) Unit Labor Cost
Chapter
1. Introduction
Iron and Steel industries have always played vital roles on the industrial and economic development of each country. The relationship between economic development and the iron and steel industry comes from the fact that steel products are used as inputs in almost all industrial areas. In addition to its own share in the economy, the iron & steel industry stands at the hub of many industrial sectors, such as construction, automotive, railways, naval construction, agricultural tooling, home appliance manufacturing, tubes, metalware and to the production of many appliances and goods.
Iron and Steel industry has not only been regarded as a key element in industrial development, but it has also made an important contribution to the establishment of the European Integration, which started as sectoral cooperation with the promise of creating cost advantages and scale economies. The European Union grew out of the European Coal and Steel Community (ECSC), which was founded in 1951 (Treaty of Paris), by France, West Germany, Italy, Belgium, Luxembourg and the Netherlands to pool the steel and coal resources of its member-states, thus preventing another European war. The ECSC served as the foundation for the later development of the European Economic Community (later renamed the European Community by the Maastricht Treaty), and then the European Union.
The iron & steel industry has also been playing an important role in the acceleration of Turkey’s industrial development. The foundations of Turkish industrialization were laid in the 1930s in parallel with the establishment of first the integrated Iron and Steel Works. Also today, the iron and steel industry has a big share in Turkish economy. Beginning from 1930’s with the developments on its iron & steel industry,
Turkey is ranking today as the 11th country on crude steel production among the world and is among the top three in Europe.
While Turkey is aiming to be a member of the European Union, its Iron & Steel Industry must be harmonized with the European Steel Industry according to the legislations of the Union. The basic principles of free trade on European Coal and Steel Community (ECSC) products between Turkey and ECSC were established by Turkey-ECSC Free Trade Agreement, which was signed in July 25, 1996. The ECSC Treaty has been expired in July 2002, but provisions of the Turkey-ECSC Free Trade Agreement are still under implementation as no new decision has been taken.
The objective of this thesis is to find the competitiveness of the Turkish Steel Industry on the way to be a member of the European Union (EU). The main idea is to find out the factors affecting the competitiveness in the steel industry in general, highlight the advantages and disadvantages of Turkish and European Steel Industries in particular, to find out whether the Turkish steel industry has comparative advantage or not. In this study the scope of the steel industry is kept limited to the definition in the ECSC Treaty, which involved the production of crude steel, semi-products, hot-rolled finished semi-products, continuously cast semi-products, cold-rolled sheets and plates, and coated sheets.
This thesis is composed of five chapters. The first chapter details the elements of competitiveness in the steel industry. The competitiveness theories, factors affecting the competitiveness of the steel industry and the methods to measure the competitiveness of the related industry are investigated.
The second chapter is devoted to the state of steel industry in EU. This chapter aims to give the historical background of the establishment of the cooperation among the steel industries of the member states. The current situation in main steel producing countries of EU, accessibility to the European Union, main challenges for the European steel industry in general, necessary planned actions to enhance a sustainable competitiveness, long-term vision of the European steel sector and even the position of the substitute materials are also examined in this chapter.
The third chapter investigates the state of the iron and steel industry in Turkey and the Turkish national restructuring plan of the industry. The main objective is to find
out the factors where Turkish Steel Industry has competitive advantages for today and also in the near future.
The fourth chapter tries to find out the factors affecting the competitiveness of the Turkish steel industry through a survey. In the survey, a 21 question-questionnaire was given to the members of the Iron and Steel Producers Association and to the re-rollers as the sampling frame.
The fifth and final chapter is devoted to the conclusion. The advantages and disadvantages of the Turkish Steel Industry in comparison with the European Steel Industry are highlighted. The other aim is to find out the challenges and the opportunities on the harmonization phase with European Steel Industry.
1.1. Research Question
1. What are the factors affecting the steel industry competitiveness of the steel industry in Turkey?
2. How can the Turkish Steel Industry increase its competitiveness?
1.2. Hypothesis
H1: There is a positive relationship between cost and steel industry competitiveness in Turkey
H2: There is a positive relationship between quality and steel industry competitiveness in Turkey
H3: There is a positive relationship between technology and steel industry competitiveness in Turkey
H4: There is a positive relationship between accessibility to markets and steel industry competitiveness in Turkey
H5: There is a positive relationship between location and steel industry competitiveness in Turkey
H6: There is a positive relationship between role of government and steel industry competitiveness in Turkey
H7: There is a positive relationship between domestic market and steel industry competitiveness in Turkey
H8: There is a positive relationship between firm characteristics and steel industry competitiveness in Turkey
1.3. Model
Figure 1.1 Competitiveness Model of the Turkish Steel Industry
Figure 1.2 Competitiveness Model of the Turkish Steel Industry in detail
Chapter
2. Theories and Approaches of Competitiveness
2.1. Competitiveness in General
The competitiveness is the key factor of the market economy system. National companies no longer only compete in their own domestic markets with each other. Due to the outward orientation and globalisation, national companies now compete with their global counterparts. As the volume of the international trade increases, each country must try to increase its share in international markets. Therefore the concept of competition among the companies is spilled over the national level, which creates the concept of national competitiveness. At national level competition among companies are highly affected by regulations of the governments. Countries which have the necessary resources and better conditions for their companies have better chance for competitiveness in global arena.
The concept of competitiveness can be investigated at three levels: National, Sectoral and Company.
Globalization has generated an intensified competition between countries. Countries must strive to be more competitive than their rivals in order to survive in the global marketplace. As Krugman mentioned, “a nation’s competitiveness is the degree to which it can, under free and fair market conditions, produce goods and services that meet the test of international markets while simultaneously expanding the real incomes of its citizens, usually reflected as “prosperity” of the country”. Therefore, national competitiveness is an intermediate goal towards a more fundamental aim for socio-economic well-being for residents of a country. Competitiveness is associated with rising living standards, expanding employment opportunities, and the ability of a nation to maintain its international obligations. It is not just a measure of the nation’s ability to sell abroad, and to maintain trade equilibrium. “Growth rate in
living standards is essentially determined by the growth rate of productivity.”
(Martin, p.2)
The same argument is also valid for industries or companies. The competitiveness of the individual companies in a local or regional market can be assessed by a comparison with local or regional rivals. The competitiveness of an industry can be assessed by a comparison with their regional and international counterparts. Thus, a competitive industry can be defined as a collection of interregionally or internationally competitive companies. (McFetridge, 1995, p.11)
Competitiveness is achieved when individual companies within an industry have the ability to produce and sell their products at a price and quality better than their local, national and global counterparts. Competitiveness at industry level is therefore taken to be synonymous with the broad economic performance of the companies comprising that industry. Therefore, competitiveness should be viewed in terms of economic efficiency or productivity. Porter states that “the only meaningful concept of competitiveness is productivity” (Porter, 1990, p.84). Productivity is defined as the output per unit of input, including both capital and labour inputs. In Porter’s terminology, productivity in the internationally traded goods and services sector determines national competitiveness.
In a homogeneous-product industry, the lower a firm's marginal or incremental cost relative to those of its competitors, the larger is its market share, and, other things being equal, the more profitable it is. Thus, market share reflects input cost and (or) productivity advantages. At the firm level, profitability, cost, productivity and market share are all indicators of competitiveness. And most of the measures of competitiveness that can be calculated at the company level can also be calculated at the industry level. (McFetridge, 1995, p.4)
2.2. Theories about the National Competitiveness
2.2.1. Comparative Advantage Theory – by David Ricardo (1817)
The theory of comparative advantage was first explained by David Riccardo in 1817 in his book “Principles of Political Economy and Taxation”. Until that time the main
accepted theory was Adam Smith’s “Absolute Advantage Theory”. Absolute Advantage Theory was focusing on the type of products to be traded between two countries. Each country should focus and specialise on the production of the goods, on which it has the absolute advantage. In that sense each country should trade those products for goods produced in other countries when it is less efficient than any other country in producing it. The main obstacle of this theory is that it does not explain what will happen if a country has an absolute advantage in the production of all goods. According to this theory, that particular country might drive no benefit from international trade.
According to David Ricardo’s theory of comparative advantage, countries must specialise in the production of those goods that it produces most efficiently and to buy the goods that it produces less efficiently from other countries. This international trade makes sense even if the production in the importing country is more efficient than the exporting country for all products. The rudimentary thought before Ricardo was that the free trade could be advantageous for countries was based on the concept of absolute advantages in production. Ricardo’s theory of comparative advantage offers an explanation in terms of international differences in labour productivity. Ricardo assumed that the resources move freely from the production of one good to another within a country, constant returns to specialisation and trade does not change a country’s stock of resources or the efficiency with which those resources are utilised.
According to David Ricardo customers in all nations can consume more if there are no restrictions on trade. This might occur even in countries that lack an absolute advantage in the production of any good. The theory of comparative advantage suggests that trade is a positive-sum game and all participants in trade benefit from economic gains. “It is the principle of comparative advantage that underlies the advantages of labor, whether between individuals, regions, or nations” (Cho and
Moon, 2000, p.8). Therefore the theory of comparative advantage became perhaps
the most important theory in international trade theories. Even though Ricardo failed to produce a consistent mechanism to show how trade between two countries is formed and how the alleged benefits of trade are distributed, he persuasively pointed out the possibility of trade between two countries, even where one of them produces both capital and labor commodities cheaper than the other. (Subasat, 2002, p. 149)
As mentioned above the theory of comparative advantage has some missing points. One of the main concerns is that the theory is based on the differences in productivity levels, but it does not explain why these differences exist. Only the labour productivity is mentioned as the source of these differences, whereas especially the labour cost has a very low percentage on the steel production nowadays.
According to Dong-Sung Cho and Hwy Chang Moon the major problem in David Ricardo’s Comparative Advantage Theory is that it predicts an extreme degree of specialisation (Cho and Moon, 2000, p.9). But in practice countries produce not one but many different products including import-competing products and in fact constant returns to specialisation does not happen in practice. As resources are shifted from one sector to another, the opportunity cost of each additional unit of another sector changes. Therefore in practice diminishing returns to scale occur and increasing return is also a possibility. Such changing costs may arise because factors of production vary in quality and in suitability for producing different commodities
(Cho and Moon, 2000, p.9). Therefore each country may specialise up to the point
where the gains from specialisation will be equal to the increasing costs of specialisation. Due to that reason countries doe not specialise their production completely.
2.2.2. Factor Endowments Theory – by Heckscher & Ohlin (1933)
In the middle of the twentieth century another important international trade theory is developed by two Swedish Economists and it is known as the Heckscher–Ohlin (H-O) Model. H-O argued that the comparative advantage arises from differences in factor endowments of countries. There are two basic characteristics of countries and products. Countries differ from each other according to the relative physical factors of production they possess. Goods differ from each other according to the factors of production that are required in their production (Cho and Moon, 2000, p.9).
Like Ricardo’s comparative advantage model, the H-O Model is also based on some assumptions. (1) commodities are freely mobile internationally, (2) all countries use the same technology in production, (3) factors of production are mobile domestically but immobile internationally, (4) tastes are the same in all countries, (5) there are no economies of scale, (6) there is perfect competition in all markets, (7) there are no
transportation costs, (8) all resources are fully employed, and (9) countries have different factor endowments and thus factor prices. (Subasat, 2002, p. 150)
Based on those assumptions, the theory asserts that a nation will export the commodity that makes intensive use of the country’s relatively abundant and cheap factor and import the commodity whose production requires the intensive use of relatively scarce and expensive factor. The logic is that the more abundant a factor, the lower is its cost. Therefore, differences in the factor endowments of various countries explain differences in factor costs, which result in different comparative advantages (Cho and Moon, 2000, p.10).
There are two main factors of production, capital and labour in the H-O Model. According to the theory, in labor-abundant countries, where the wage rates are low, labor-intensive goods can be produced relatively cheaply and these products could be exported to countries, where goods are produced with more capital content. And these labor-abundant countries will import capital-intensive commodities. The theory assumes that the relative prices of these two particular commodities (capital and labor) are determined by their relative factor endowments. The supplies of factors of production lie in the analysis of endowments. All countries are endowed with different quantities of factors of production. Since these endowments are naturally determined, countries employ the best combination of these factors to produce commodities in the most efficient way. To determine if a country is capital or labor endowed (or abundant), we need to look at the comparative physical availability in each country, namely, capital-labor ratios. If one country has a higher capital-labor ratio than another, that country is endowed with capital, or is capital abundant
(Subasat, 2002, p. 150). In addition to factor endowments and innovative actions,
Ghosal emphasizes that “capital-labor ratio of a country has a significantly inverse relationship between demand uncertainty and in positive relationship with firm size”. He emphasizes that larger firm size counteracts the negative influence of demand uncertainty. (Ghosal, 1991, p.158)
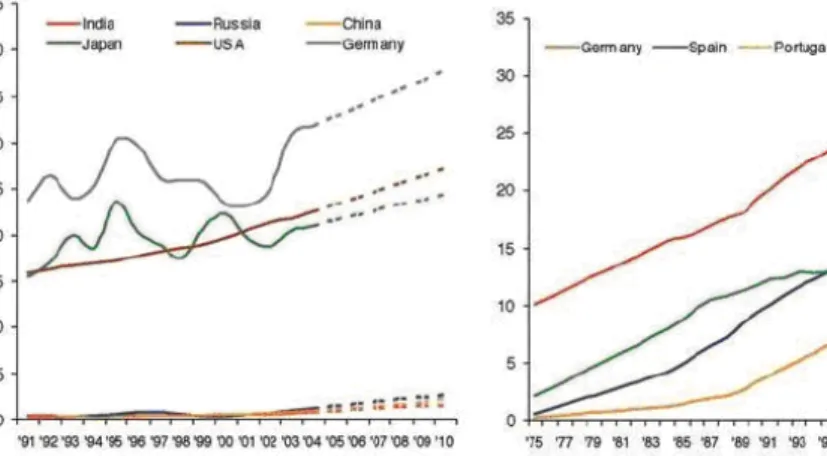
Steel is a capital-intensive product. It is also mainly produced in developed countries with a few exceptions. According to the annual report of Iron Steel Producers Association the top ten steel producing countries in 2006 were China, Japan, United States of America, Germany, South Korea, Russia, Ukraine, Brazil, India and Italy. As it could be seen some of the developing countries like China, India, Brazil and
Russian Federation are also taking place among the top ten steel producing countries. The main reason for that is the high demand in their domestic markets due to their high populations and the large firm sizes in their markets.
The Heckscher-Ohlin model is seen as an improvement on the Ricardian model with its alleged ability to predict the pattern of trade between low- and high-income countries. Since low-income countries are capital scarce, under free trade they find it more profitable to export labor-intensive commodities and import capital-intensive commodities (Subasat, 2002, p. 150).Relative prices of the labor-intensive commodities are lower in low-income countries, and this, in turn, means they have a comparative advantage in labor-intensive commodities.
Both Ricardo’s Comparative Advantage Theory and Heckscher–Ohlin’s Factor Endowment Theory are based on the comparative advantage among countries which is either due to labor productivity or due to factor endowments, so that there could be a difference on the prices among two countries before the international trade. And the commodities flow from the low-cost country to the high-cost one. According to both theories prices of the goods before the trade must be compared to find out the relative comparative advantage among those countries. But practically this is not possible for all the goods and all the countries. Furthermore there are also many different prices among companies in the same market for the same product.
2.2.3. Leontief Paradox – by Wassily Leontief (1953)
According to the factor endowment theory of Heckscher & Ohlin it is expected that the labour-abundant countries export labour intensive commodities, while the capital-abundant countries export capital intensive ones to import labour intensive products in return. Contrary to this expectation, with the studies of Leontief in 1953 it was observed that a in a capital abundant country like United States import-competing goods required 30 percent more capital per worker than U.S. export goods
(Cho and Moon, 2000, p.12). This observation is known as the Leontief Paradox.
Many economists including Leontief himself tried to explain this paradox by means of productivity levels of workers, natural resources or factor intensity reversals. But none of those explanations was significant enough to find out the reason of this paradox. Some economists have developed alternative theories of international trade
because the H-O Model does not explain the trade in the real world sufficiently. Recognizing the increasing diversity of international trade, new theories are useful in explaining some special cases of international trade. These theories include Revealed Comparative Advantage, Product Cycle, Country Similarity, and Trade Based on Economies of Scale (Cho and Moon, 2000, p.14).
2.2.4. Revealed Comparative Advantage – by Bela Balassa (1965)
Ideally, measures of comparative advantage should reflect regional or cross country differences in a hypothetical pre-trade environment, known as autarky. Autarky is the condition where equilibrium prices are unaffected by influences external to an economy (Leishmann and et all, 1999, p.4). In reality all countries engage in some level of international trade. Therefore true comparative advantages cannot be directly observed. In 1965, Bela Balassa introduced the concept of “Revealed Comparative Advantage” (RCA) as a way to approximate comparative advantage in autarky. According to Balassa, “the concept of Revealed Comparative Advantage pertains to the relative trade performances of individual countries in particular commodities. On the assumption that the commodity pattern of trade reflects inter-country differences in relative costs as well as in non-price factors, this is assumed to reveal the comparative advantage of trading countries” (Balassa, 1977, p. 128). As long as the trade pattern is determined by comparative advantage, then direct observations of trade performance should reveal the comparative advantage. The stronger a country’s relative trade performance in a certain commodity, the greater the comparative advantage in the production of that commodity.
The comparison between export performances of Turkey and major European Union countries show that Turkey has the major revealed comparative advantage on raw-material intensive goods and labor intensive goods. For the capital intensive goods including also the steel products Turkey has a lower export volume than the above mentioned sectors. (Appendix A, Table.1) (Erlat, 2001, p.5)
Although the concept of RCA is known as the Balassa theory, the first empirical study on this subject was done by Liesner in 1958. The measuring of the RCA was based on the simple comparison among the exports of countries. In 1965 the original RCA index was formulated by Balassa himself, which measures a country’s exports
of a commodity (or industry) relative to its total exports and to the corresponding exports of a set of countries, e.g. the EU. (Utkulu and Seymen, 2004, p.9). The proposed simple measure of RCA by Liesner is the following: RCA = Xij / Xnj where
X represents exports, i is a country, j is a commodity (or industry), and n is a set of
countries (e.g. the EU).
A value of less than unity implies that the country has a revealed comparative disadvantage in the product. Similarly, if the index exceeds unity, the country is said to have a revealed comparative advantage in the product. The RCA indicates whether a country is in the process of extending the products in which it has a trade potential. It can also provide useful information about potential trade prospects with new partners. Countries with similar RCA profiles are unlikely to have high bilateral trade intensities unless intra industry trade is involved.
The concept of Revealed Comparative Advantage (RCA) is grounded in traditional international trade theory and based on export specialisation. Although variations have been propounded and tested in the literature, the original RCA index was formulated by Balassa in 1965. The studies of Balassa evaluate the measurement of RCA as bilateral trade between two countries or trading partners. He emphasized four formulas for the comparison of comparative advantages among countries. The first one is RCA = (Xij / Xit) / (Xnj / Xnt) = (Xij / Xnj ) / (Xit / Xnt) where X represents exports, i is a country, j is a commodity (or industry), t is a set of commodities (or industries) and n is a set of countries. This formula measures a country’s exports of a product relative to its total exports and to the corresponding exports of a set of countries. Balassa’s second formula is aiming to make reference to the own country trade performance only. RCA= (Xij - Mij) / (Xij + Mij). The third equation is RCA = (Xij / Xit) / (Mij / Mit) = (Xij / Mij) / (Xit / Mit) where X and M represents exports and imports respectively. i is a country, j is a commodity (or industry), t is a set of commodities (or industries). But the most common version of Balassa equation is the fourth one as given below.
There are four equations derived by Balassa to measure the RCA including the equation to measure the “own” country trade performance only. The studies of
Balassa evaluate the measurement of RCA as bilateral trade between two countries or trading partners.
Three additional versions of the RCA were offered by Vollrath. In 1991 Vollrath also made studies on revealed comparative advantages and offered mainly three alternative ways of measurement of a country’s RCA. These alternative specifications of the RCA are called the relative trade advantage (RTA), the logarithm of the relative export advantage (ln RXA), and the revealed competitiveness (RC) (Utkulu and Seymen, 2004, p.9). These studies of Vollrath measure the RCA at the global level.
• RTA = RXA – RMA where RXA = (Xij/ Xit) / (Xnj/ Xnt) and RMA = (Mij/
Mit) / (Mnj/ Mnt).
• ln RXA = ln ((Xij/ Xit) / (Xnj/ Xnt)) • RC = ln RXA - ln RMA
The first formula of Balassa and the formulas of Vollrath are to measure the competitiveness on global level, whereas the other formulas are to measure it on bilateral level. On the global level, the global competitiveness of Turkey and the EU are compared assuming that both Turkey and the EU are exporting to and importing from the world. On the bilateral level, however, trade between Turkey and the EU are taken into account only. The import and export figures are likely to be affected from the government policies and interventions like import–export duties, anti-dumping duties, quotas, barriers and tariffs. Therefore RCA indices may misrepresent underlying comparative advantages.
2.2.5. Product Cycle Theory – by Raymond Vernon (1966)
Raymond Vernon argued that many manufacturing goods go through a product cycle of introduction, growth, maturity and decline. Thus, comparative advantages of these goods shift over time from one country to another (Cho and Moon, 2000, p.14). Innovative companies in developed countries scan their domestic markets and create products mainly according to the demand in their domestic market. The demand in the domestic market has a very big influence on the decisions and innovations of
companies. The effect of the Demand Conditions on the competitive advantage plays also an important role on Michael Porter’s Diamond Model.
New products shaped by the demand of the domestic market are sold in the market with relatively high prices in the introduction stage. As the new product passes through the path of product cycle, its price declines while it reaches to a bigger portion of the target group. As the market in the developed countries matures, the product becomes more standardised, and price becomes the main competitive item. Eventually, competition in the high income markets forces firms to look for ways to strengthen their competitive positions internationally. The desire to gain an advantage over producers based in high income countries leads to the outsourcing of component production in developing countries, followed eventually by larger and larger shares of overall production in developing country markets. (Gerber and
Carrillo, 2002, p.3)
As Vernon mentioned in his study, the innovative companies in developed countries aim not only to reduce the costs but also to gain competitive advantage due to the low production costs in developing countries. They also transfer the technology by establishing overseas subsidiaries to other regions of the world to be able to reach easily to target markets by reducing their disadvantage due to the location.
“To begin with, the U.S.-controlled enterprises generate new products and processes in response to the high per capita income and the relative availability of productive factors in the United States; they introduce these products or processes abroad through exports; when their export position is threatened they establish overseas subsidiaries to exploit what remains of their advantage; they retain their oligopolistic advantage for a period of time, then lose it as the basis for the original lead is completely eroded.” (Vernon, 1971, p.66)
If we look at the steel producing industry, we observe that the percentage of the world steel production has shifted in the last fifty years from developed countries like the European countries and the US to emerging countries like China, Ukraine, Brazil & India. But still the main difference is that the developed countries are mainly concentrated on the high value added products whereas the developing countries are focusing on the production volume with low value added products. What is more important than the performance of countries is the power and performance of
international companies like Arcelor-Mittal, which is growing globally through consolidations. As mentioned above the main aim is to reach as many countries as possible to strengthen their positions globally with an increased product range and to eliminate their disadvantage due to location.
All of the above mentioned theories focus mainly on the production side. In 1961 Stafan Linder emphasized the importance of demand by his Country Similarity Theory. This theory explains international trade among countries that have similar characteristics.
2.2.6. Country Similarity Theory – by Stefan Linder (1961)
Stefan Linder focuses on the trade of the manufacturing sector and bases his theory on two assumptions: First, he supposes that a country exports products which are driven mainly by the local demand. The domestic demand must be significant enough in order to utilize the existing economies of scale; to reduce costs and to improve new products with the already known local customers. The situation in the steel industry is in parallel with this situation. The major steel producing countries have also a very high demand in their domestic markets. But at this point we have to separate the situation in developed and developing countries. In major steel producing developed countries like Japan, United States, Germany and Italy the steel demand is mainly driven by the domestic demand for high value added products, which could be used in industry. Whereas in developing countries like China, India, Ukraine and the Russian Federation the steel demand is mainly driven by domestic demand for low value added products, which can be used in construction. Although this is the case, we are observing that the developed European Union countries are also exporting low value added products. The main reason for that is their already established steel production capacity on those products, when they were in need of raising their construction industry. The common point in all of these countries is that steel industry in those countries is mainly dominated by the players with high production capacities, so that they can use the advantage of economies of scale to reduce their costs.
The second assumption of Linder is that importing and exporting countries have similar tastes and income levels, one of the main criticisms of the comparative
advantage model and the key variable for explaining intra-industry trade (Jahir,
2006, p.14). Linder believed that countries with similar income levels would have
similar tastes. Each country will produce primarily for its domestic market, but part of the output will be exported to other countries with similar tastes and income levels. (Cho and Moon, 2000, p.16).
In the steel industry the situation does not match purely with the above mentioned assumption of Linder. As an example if we observe the export – import trade patterns of Turkey then we observe than the major markets in 2006 for the export are the countries in the Persian Gulf (4,801,100 mt), European Union 25 countries (3,309,375 mt) and United States (1,736,546 mt) (Turkish Iron and Steel Producers
Association, May 2007, p. 25). On the import side for the Turkish Steel Market the
main sources are the Common Wealth of Independent States (CIS) countries (6,459,615 mt) and European Union 25 countries (2,405,478 mt) (Turkish Iron and
Steel Producers Association, May 2007, p. 26). As it could be seen from the above
mentioned figures, the major export markets for Turkey consist of developed countries like the European Union countries and the US, whereas on the import side the developed European Union countries still have a significant contribution on Turkey’s import figures, although Turkey is a developing country compared to the US and European Union Countries and although there is a significant difference between their income levels. It looks like there is intra-industry trade among them, but there is a difference on the nature of the traded products. As mentioned above Turkey exports mainly low-value added long products, whereas European Union countries are mainly exporting high-value added flat products to Turkey. The Table 2.1 explains the trade pattern between Turkey and European Union in a better way. Table 2.1 International Trade Figures of Turkey with EU(25) Countries
International Trade Figures of Turkey with EU (25) countries
Exports (mt) Imports (mt)
Long Products 2,654,356 1,115,583
Flat Products 465,238 1,289,895
These figures even show that countries do not fully trade with countries with similar income levels in practice. To be able to explain this situation another theory of economies of scale by Krugman & Lancester might be useful in addition to the first assumption of Lindser regarding the powerful domestic demand.
2.2.7. The Economies of Scale Theory – by Krugman & Lancaster (1979)
In a traditional, Heckscher-Ohlin model of international trade, trade is driven by differing factor endowments between regions. Countries specialize in the production of goods that use the most abundant factor most intensively, allowing them to capture comparative advantage through trade. “The Heckscher-Ohlin model cannot adequately explain the large degree of trade taking place among similar economies, and the increasing domination of intra-industry trade in particular.” (Munroe and et all, 2000, p.7).
“For a traditional H-O framework, one must assume a perfectly competitive market structure with constant returns to scale. This assumption is too restrictive for more complex economies where scale economies are important and market imperfections are rampant.” (Darla and et all, 2000, p.9). In the Economies of Scale Model the main difference is the increasing rate of returns. According to Dong-Sung Cho and Hwy Chang Moon countries or firms would benefit if they specialize in the production of a limited range of goods.
According to Marius Brülhart, the new trade theory suggests that all countries manufacture a number of product varieties which are proportional to the size of their total factor endowment (labour force), and that the international exchange of such similar goods shows up as Intra-Industry Trade (IIT). “In the standard model, the relationship between scale economies and IIT is discontinuous, since very high levels of scale economies are associated with low levels of IIT. This is not academic nit-picking, since via scale economies IIT has come to be interpreted as an indicator of imperfectly competitive market structure.” (Brülhart, 1995, p.2). The main reason for that is that the Heckscher Ohlin Model assumes that there is perfect competition in all markets and there are no scale economies. Although the link between intra industry trade and scale economies is ambiguous, intra industry trade shows us the similarity of industrial structures and preferences among countries. By taking all
other variables constant, the higher the level of intra industry trade, the more similar is the composition of industry in two trading countries. In other words, “if certain sectors exhibit high IIT in a group of countries, then these sectors are likely to be relatively dispersed over the whole area of this group.” (Brülhart, 1995, p.3). The intra industry trade is also to be associated with relatively smooth trade-induced industrial adjustments when applied to changes in the trade patterns.
The Models of the New Trade Theory make a range of other restrictive assumptions. There is only one factor of production, usually called labour, and all goods are produced with the same (increasing returns) technology. Therefore there can be no comparative advantage difference among countries. All consumers share the same utility function and they have symmetric preferences for all goods. According to Brühlhart monopolistic competition eliminates supernormal profits and under these assumptions the number of dependent variables on the model reduces to one, which is the number of goods produced. “While its restrictive hypotheses move the model far away from economic reality, such algebraic constructs manage to show formally that scale economies can give rise to international trade even where all countries share the same tastes, relative factor endowments and technologies.” (Brülhart, 1995,
p.5)
Brühlhart examined the effect of changes in three parameters on intra-industry trade. These are relative market sizes (L/L*), equilibrium scale economies (θ) and transport costs (1-τ). He found a positive relationship between relative market sizes and the IIT. As the sizes of both markets become equal, then the IIT increases. (Appendix A - Figure.1) But the IIT is related negatively to the equilibrium scale economies (θ). (Appendix A- Figure.2) “An increase in the elasticity of demand works in the same manner as in increase in trade costs, since, in both cases, foreign demand will fall, thus creating an increase in the protection of the domestic market. Since in equilibrium, elasticity of demand relates negatively to scale economies, it is easy to understand that an increase in scale economies works in an opposite direction to an increase in trade costs.” (Brülhart, 1996, p.11). “In equilibrium, equilibrium scale economies is related strictly negatively to (the potential for) scale economies, because equilibrium scale economies is an inverse indicator of consumers' taste for variety.” (Brülhart, 1995, p.8). Transport costs are also negatively related to the IIT. (Appendix A - Figure.3)
The Economies of Scale can explain some trade patterns which are not explained by the H-O Model. The main reason for that is that according to the Economies of Scale Model there are different types of increasing returns. Increasing returns are due to internal economies (increasing returns at the firm level) and increasing returns due to external economies (at the industry level). Increasing returns at the firm level do not lead to increases in IIT. Increasing returns at the industry level is a more important factor in IIT. At the industry level “increasing returns arise due to market concentration, larger markets, or decreased transportation and information costs. Trade in intermediate inputs, or vertically integrated trade, also becomes possible with external economies of scale” (Darla and et all, 2000, p.9).
The effect of the scale economies on IIT depends on industry characteristics. Some industries more than others would have scale economies leading to IIT. Darla K. Munroe and Geoffrey J. D. Hewings emphasized that industries with a small number of firms are most likely oligopolistic in nature. On the other hand, industries with a large number of firms likely to exhibit increasing returns to scale. In industries with large number of firms, product differentiation is more likely to occur, leading to increases in IIT. “Lancaster stresses that monopolistic competition is the most competitive market structure in industries characterized by diverse consumer preferences and production specifications, but not in all cases does the presence of scale economies imply IIT.” (Darla and et all, 2000, p.10).
“While trade in the H-O model is based on comparative advantage or differences in factor endowments (labor, capital, natural resources, and technology) among nations, intra industry trade is based on product differentiation and economies of scale. Thus, while trade based on comparative advantage is likely to be larger the greater is the difference in factor endowments among nations, intra-industry trade is likely to be larger among economies of similar size and factor proportions.” (Salvatore, 1997,
p.158). Therefore the comparative advantage seems to determine the pattern of
inter-industry trade while economies of scale in differentiated products give rise to intra-industry trade.
As mentioned above transportation costs has also a significant contribution to the volume of the trade. Therefore the location of the industry is very important. Some economists make their studies on this subject to clarify the role of the location on trade.
2.2.8. Location Theory – by Alfred Weber (1909)
The theory about the industrial location was formulated first by Alfred Weber in 1909. With the publication of "über den Standort der Industrie” (Theory of the Location of Industries) Weber put forth the first developed general theory of industrial location. This theory carries the assumptions that population and resources are uniformly distributed over a homogeneous plane, firms have free entry into the market, all firms have constant returns to scale, and perfect competition exists. According to Weber an industry is located where it can minimize its costs, and therefore maximize its profits. Weber’s least cost theory accounted for the location of a manufacturing plant in terms of the owner’s desire to minimize three categories of costs. These are: Transportation; Labor, and Agglomeration costs.
According to Weber an industry must be located where the transportation costs of raw materials and final product is a minimum. In that sense the industry must be located close to the raw material sources, energy and also to the markets. If there is no weight loss or weight gain in production then the industry could be established anywhere between both locations. But if there is weight difference between raw material and final product weights, then the industry must be located in such a place to minimise the total transport costs. Weber distinguished this situation into two different cases. In one the weight of the final product is less than the weight of the raw material going into making the product. This is the weight losing case. In the other case the final product is heavier than the raw material. This is the weight gaining case. To be able to identify both cases Weber used a material index, whereby the relative weight gain or loss is calculated.
Material index = total weight of materials used to manufacture the product Total weight of the finished product
If the product is a pure material its index will be 1. If the index is less than 1 the final product has gain weight in manufacture, thus favouring the industry to be located near the market place. But most products lose weight in manufacture, such as a metal being extracted from an ore. Thus their material index will be more than 1, thus favouring the industry to be located near the raw material site.
Transportation costs have an important effect on the total costs of the international steel trade. Therefore the location of the industry is very important. Steel is produced