D.E.Ü.İİ.B.F. Dergisi
Cilt: 20, Sayı:2, Yıl: 2005, ss:81-93
TESTING FOR MULTIPLE STRUCTURAL BREAKS: AN APPLICATION OF BAI-PERRON TEST TO THE NOMINAL INTEREST RATES AND
INFLATION IN TURKEY
Gülcan ÖNEL*
ABSTRACT
This paper aims to tests for multiple structural breaks in the nominal interest rate and inflation rate using the methodology developed by Bai and Perron (1998). The monthly data on Turkish 90 days time-deposits interest rate and consumer price index inflation rate over the period of 1980:1-2004:12 are used. The empirical results give little evidence of mean breaks in the interest rate series. However, the data on inflation rates is consistent with two breaks that are located at 1987:9 and 2000:2.
Keywords: Structural breaks; multiple breaks; Hypothesis Testing; Model selection, Bai-Perron Test.
1. Introduction
Testing for structural change has always been an important issue in econometrics because a myriad of political and economic factors can cause the relationships among economic variables to change over time. The early works of Quandt (1958) and Chow (1960) consider tests for structural change for a known single break date. The researches headed for the modelling where this break date is treated as an unknown variable. Quandt (1960) extends the Chow test and proposes taking the largest Chow statistic over all possible break dates. In the same context, the most important contributions are those of Andrews (1993) and Andrews and Ploberger (1994) who consider a comprehensive analysis of the problem of testing for structural change.
Following Perron (1989), it is now well known that apparent persistence in macroeconomic data could be the result of unmodeled structural breaks in the underlying data process. Therefore, a series that appears to be well modeled as an I(1) process, could actually be a stationary process with one or * Research Assistant, Dokuz Eylül Üniversity, Faculty of Business, Economics Department,
more structural breaks. Perron (1989) carries out standard tests of the unit-root hypothesis against trend-stationary alternatives with a break in the trend occurring at the Great Crash of 1929 or at the Oil-Price Shock of 1973 using the Nelson–Plosser macroeconomic data series as well as a postwar quarterly real gross national product series. His tests reject the null hypothesis of unit root for most of the series if the true data-generating process is that of stationary fluctuations around a trend function that contains one structural break. In the same context, Zivot and Andrews (1992) consider a variation of Perron’s tests in which the break date is estimated rather than fixed (Jouni and Boutahar, 2005).
Jouni and Boutahar (2005) give a brief literature on the case of multiple structural changes. The multiple structural changes case receives an increasing attention. Yao (1988), Yin (1988) and Yao and Au (1989) study the estimation of the number of mean shifts of variables sequence using the Bayesian information criterion. Liu et al. (1997) consider multiple changes in a linear model estimated by least squares and estimate the number of changes using a modified Schwarz’ criterion. Recently, Bai and Perron (1998) consider the estimation of multiple structural shifts in a linear model estimated by least squares. They propose some tests for structural change for the case with no
trending regressors and a selection procedure based on a sequence of tests to
estimate consistently the number of break points. Bai and Perron (2004) assess via simulations the adequacy of these methods. They study the size and power of tests for structural change, the coverage rates of the confidence intervals for the break dates and the relative merits and drawbacks of model selection procedures.
While selecting the data, one should notice that some of the procedures developed by Bai and Perron (1998) are not valid when trending regressors allowed for. Therefore, inflation and interest rates, which are also commonly used variables in the empirical studies on Turkish monetary issues, are selected for this study since they don’t show a trending case.
Before starting the empirical investigation, it might be useful to review the Turkish economy for the period under consideration (1980-2004). The year 1980 had been the beginning of the period of liberalization and integration of the Turkish economy to the world economy. The structural change and reform plan of 1980 called for abandoning the barriers to trade, adopting export-led growth strategy, reducing the controls on foreign exchange, transition to the flexible exchange regime, lifting the controls on interest rates, easing bureaucracy, subsidizing foreign capital, and adopting price mechanism were
among the main economic reforms introduced in this period. After the introduction of the plan, increases in consumer prices from 140 percent in May 1980 decreased to 33 percent and the economic growth accelerated in the following four years.
The period since the late 1980s is characterized by increasing inflation and several stabilization programs. Nominal anchoring and monetary tightening were used in these programs without any serious effort to reduce the public sector borrowing requirement. In 1989, the capital account was liberalized and high nominal interest rate and low depreciation rate were used to attract short term foreign capital to roll-over the public debt. The change in the deficit financing method of the public sector from money to bond-finance starting in 1986, and attempts to stabilize the exchange rate to prevent the inflationary effects made this policy combination unsustainable within a short period of time. It led to an “exchange-rate” crisis in the first half of 1994. In 1994, the annual inflation rate exceeded 100 percent as in 1980.
Turkish governments introduced new disinflation measures to stabilize the economy after the 1994 financial crisis. However, these efforts in 1995, 1998 and 2000 failed to reduce the inflation rate to levels below 25 percent per year, as it had been in the early 1970s. The so-called three-year program, which was introduced in December 1999, was essentially an exchange-rate-based stabilization program supplemented by fiscal adjustment and structural reforms. Despite the fact that the program achieved some remarkable results in a short period of time, the 2000–02 program had to be revised in light of two crises; first in November 2000 and then in February 2001. The policies of the Central Bank since then have been aimed at controlling the volatility of the exchange rate rather than targeting its level or direction while trying to lower the inflation rate. The inflation declined to about 10 per cent and the interest rates realized around 20 percent by the end of 2004.
Developments in Turkish economy illustrates that especially inflation rates are affected by the economic conditions and changed dramatically over time. The aim of this paper is to explore the empirical evidence of the instability in interest rates and inflation rates of Turkey using the recent analysis of multiple structural change models developed by Bai and Perron (1998, 2003a, 2003b). To the best of my knowledge, there is no such study that applies the Bai and Perron’s (1998) methodology for these macroeconomic time series data.
The remainder of the paper is organized as follows. Section two briefly summarizes the structural change model and the estimation method of Bai and Perron (1998, 2003a). Section three presents the data and gives the empirical
findings. Finally, section four gives some concluding remarks especially on the economic explanation of the chosen break dates.
2. Econometric Method 2.1. The Model
The literature on the tests for structural breaks which is reviewed in the previous part can be classified in two groups: 1- ) tests for a single structural change 2- ) tests for multiple structural breaks.
Macroeconomic time series can contain more than one structural break. To that effect, Bai and Perron (1998) recently provide a comprehensive analysis of several issues in the context of multiple structural change models and develop some tests which preclude the presence of trending regressors.
Following Ben Arissa and Jouni, 2003 and Ben Aissa et. al., 2004, the model and test statistics of the Bai-Perron (BP) procedure are briefly discussed below. The BP) methodology considers the following multiple structural break model with m breaks (m+1 regimes).
1 1 ' ' z u ,t 1,...,T x yt = t
β
+ tδ
+ t = 2 1 2 ' ' z u ,t T 1,...,T x yt = tβ
+ tδ
+ t = + (1) ………. T T t u z x yt t t m 1 t, m 1,..., ' ' + + = + =β
δ
+where yt is the observed dependent variable at time t; xt is px1 and zt is
qx1, and β1 and δ
j (j=1,…..,m+1) are the corresponding vectors of coefficients;
and ut is the disturbance term at time t. the break points (T1, ….,Tm) are treated as unknown, and are estimated together with the unknown coefficients when T observations are available. The purpose is to estimate the unknown regression coefficients and the break dates (β, δ1,…. δm+1, T1,….Tm)when T observations on (yt, xt, zt) are available. The above multiple linear regression models can be expressed in matrix form as
U
Z
X
Y
=
β
+
−δ
+
(2)1 In the terminology of BP, this is a partial structural change model, in the sense that β does not change, and is effectively estimated over the entire sample. If β=0, this becomes a pure structural change model where all coefficients are subject to change.
where Y=(y1,…..yT)’ , X=(x1,….xT)’, Z is the matrix which diagonally partitions Z at the m-partition (T1,…Tm), i.e. with Zi=(z ) ,... ( 1 +1 − =diag Z Zm Z
T-i+1,….zTi)’ , ( , ,.... ' 1)' and U=(u '
2 '
1 +
=
δ
δ
δ
mδ
1,……..uT)’. Bai and Perron(1998) impose some restrictions on the possible values of the break dates. They define the following set for some arbitrary small positive number
}
1
,
,
);
,...
{(
:
λ
1λ
λ
1λ
ε
λ
1ε
λ
ε
ε
Λ
ε=
m i+−
i≥
≥
m≤
−
to restrict each break date to be asymptotically distinct and bounded from the boundaries of the sample where theλ
i(i=1,2…..m) gives the break fraction (
λ
i=
T /
iT
m)
.The estimation method considers is based on the least squares principle proposed by Bai and Perron (1998). For each m-partition (T1,…,Tm), denoted {Tj}, the associated least squares estimate of δj is obtained by minimizing the
sum of squared residuals . Let denote the
resulting estimate. Substituting it in the objective function and denoting the resulting sum of squared residuals as , the estimated break dates
are such that:
∑ ∑
+ = + = − − 1 1 1 2 ' 1 ) ( m i T T t i t t i i z yδ
δ
Λ({
T
j})
)
,....
(
1 m TT
T
S
)
,...,
(
T
1T
m Λ Λ (3))
,...
(
min
arg
)
,...,
(
1 ) ,..., ( 1 1 T T m T mS
T
T
T
T
m=
Λ Λwhere the minimization is taken over all partitions
(
T
1,....
T
m)
such that]
[
1
T
T
T
i−
i−≥
ε
.2 Thus the break point estimators are global minimizers of the objective function. Finally, the regression parameter estimates are the associated least-squares estimates at the estimated m-partition , i.e. . For our empirical illustration, we use the efficient algorithm developed in Bai and Perron (2003a) based on the principle of dynamic programming which allows global minimizers to be obtained using a number of sums of squared residuals that is of order O(T}
{
T
j Λ})
({
T
j Λ Λ=
δ
δ
2) for any m≥2.2
[ T
ε
]
is then interpreted as the minimal number of observations in each segment. From Bai and Perron (2003a), if the tests are not required and the estimation is the sole concern, then the minimal number of observations in each segment can be set to any value greater than q.2.2. Tests Statistics
Bai and Perron (1998) consider estimating multiple structural changes in a linear model and develop three tests.
2.2.1. A Test of Structural Stability Versus a Fixed Number of Changes Bai and Perron (1998) first consider the sup F type test of structural stability against the alternative hypothesis that there is a known number of breaks n: Λ − Λ Λ Λ
⎟⎟
⎠
⎞
⎜⎜
⎝
⎛
−
+
=
δ
δ
δ
λ
λ
R
R
V
R
R
nq
q
n
T
T
q
F
T n ' ' ' 1 1(
(
)
)
)
1
(
1
)
;
,....
(
(4)whre R is the matrix such that , and
is an estimate of the variance covariance matrix of that is robust to serial correlation and heteroscedasticity; i.e. a consistent estimate of
) ,..., ( ) ( ' 1 ' ' 2 ' 1 ' + − − = n n R
δ
δ
δ
δ
δ
)
(
Λ Λδ
V
δ
Λ 1 ' ' 1 ' ) ( ) ( lim ) (Λ − − − − − − − − Λ Ω = p T Z Z Z Z Z Z Vδ
with
Ω
=
E
(
UU
')
. The supF type test statistics is then defined as)
;
,....
(
)
;
,....
(
sup
)
;
(
sup
1 1 ) ,... ( 1q
F
q
F
q
n
F
T T n T n n Λ Λ Λ ∈=
=
λ
λ
λ
λ
ε λ λ (5)where the break fraction estimates minimize the global sum of squared residuals. Different versions of these tests can be obtained depending on the assumptions made with respect to the distribution of the regressors and the errors across segments (Bai and Perron, 2003a).
) ,.... (
λ
Λ1λ
Λn2.2.2. A Test of Structural Stability versus an Unknown Number of Breaks Bai and Perron (1998) also consider tests of no structural change against an unknown number of breaks given some upper bound M for m. The following new class of tests is called double maximum tests and is defined for some fixed weights {a1,....aM} as
)
;
,...,
(
sup
max
)
,....,
,
,
(
max
1 ) ,... ( 1 1 1q
F
a
a
a
q
M
F
D
m T m M m M T mλ
λ
ε λ λ ∈Λ ≤ ≤=
max
(
1,...,
;
)
(6) 1 m Ma
mF
T mq
Λ Λ ≤ ≤=
λ
λ
The weights {a1,....aM} reflect the imposition of some priors on the likelihood of various numbers of structural breaks. Firstly, they set all weights equal to unity, i.e. am =1 and label this version of the test as UDmax FT (M, q). Then, they consider a set of weights such that the marginal p-values are equal across values of m. The weights are then defined as a1 = 1 and am =c(q,α,1)/c(q, α,m), for m > 1, where α is the significance level of the test and c(q, α,m) is the asymptotic critical value of the test
sup
(
1,...,
;
)
) ,... ( 1
q
F
T m mλ
λ
ε λ λ ∈Λ . This version ofthe test is denoted as WDmax FT (M, q). 2.2.3. A sequential test
The last test developed by Bai and Perron (1998) is a sequential test of l versus l+1 structural changes:
Λ Λ Λ Λ − Λ Λ ∈ ≤ ≤ Λ Λ
−
=
+
2 1 1 1 1,...,
)
min
inf
(
,...,
,
,
,...,
)}
/
(
{
)
1
(
sup
,σ
τ
ε τ T i i l l i l T Tl
l
S
T
T
S
T
T
T
T
F
i (7) where ,is the sum of squared residuals resulting from the least-squares estimation from each m-partition , and is a consistent estimator of σ
}
)
,...,
(
)
,...,
(
;
{
1 1 1 ,ητ
η
τ
η
Λ − Λ Λ Λ − Λ − Λ−
≤
≤
+
=
Λ
iT
iT
iT
iT
iT
iT
i ) ,..., , , ,..., (Λ1 Λi−1 Λi Λl T T T T T Sτ
)
,....
(
T
1T
m Λ 2σ
2 under the null hypothesis.
The asymptotic distributions of these three tests are derived in Bai and Perron (1998) and asymptotic critical values are tabulated in Bai and Perron (1998, 2003b) for ε=0.05 (M=9), 0.10 (M=8), 0.15 (M=5), 0.20 (M=3), and 0.25 (M=2).
2.2.4. The selection procedure
A preferred strategy to determine the number of breaks in a set of data is to first look at the UDmax FT (M, q) or WDmax FT (M, q) tests to see if at least a structural break exists (Jouni and Boutahar, 2003). We can then decide the number of breaks based upon an examination of the
sup
F
T(
l
+
1
l
)
statistics constructed using the break date estimates obtained from a global minimization of the sum of squared residuals (i.e. we select m breaks such that the tests)
1
(
conclude that this method leads to the best results and is recommended for empirical applications.
3. Data and Empirical Findings
For the empirical analysis, monthly inflation rate (constructed from consumer price index) and interest rates (three months time deposits interest rates) covering the period 1980:1-2004:12 (yielding 300 observations) are used. The data is obtained from IMF’s International Financial Statistics.
Using BP methodology, the numbers of structural breaks as well as their locations are estimated. No serial correlation is permitted in the errors since a lagged dependent variable is allowed as a regressor [See assumption A4 in Bai and Perron (1998)]. The maximum permitted number of breaks is set at M=5, and a trimming ε=0.15 is used to determine the minimal number of observations in each segment ( h=[ εT] with T the sample size ).
Table 1. Empirical Results for the Nominal Interest Rates (1980:1-2004:12) Specifications
zt ={1} q=1 p=0 h=45 M=5 ε=0.15
Tests
SupFT(1) SupFT(2) SupFT(3) SupFT(4) SupFT(5) UDmax WDmax
6.550 12.598*** 9.09*** 8.748*** 14.912*** 14.912*** 37.325***
SupF(2|1) SupF(3|2) SupF(4|3)
5.126 1.159 0.743
Number of Breaks Selected a
Sequential: 0 BIC: 4 LWZ: 3
Estimates with Four Breaks b 1 Λ
δ
2 Λδ
3 Λδ
4 Λδ
5 Λδ
1 Λ T 2 Λ T 3 Λ T 4 Λ T 30.200 44.050 59.859 80.905 47.064 1983:9 1988:9 1994:1 1999:11 (14.661) (6.766) (21.263) (4.124) (7.693)a 5% significance level for the sequential procedure is used.
b In parentheses, reported are the standard errors (robust to serial correlation) for the estimated
regression coefficients. The confidence intervals for the break dates are not reported since they’re too large and statistically insignificant.
*** denotes that the tests are significant at 1% level.
The estimation results for the breaks in nominal interest rates are given in Table 1. The first issue to consider is testing for structural changes. Here the sup FT (k) tests are all significant for k except for k=1. The double maximum tests UD max and WD max which allow us to test the null hypothesis of no structural break versus an unknown number of changes given the upper bound
of five breaks are significant at the 1% level. The significance of these tests does not provide enough information about the exact number of breaks but means that one break is at least present. The
sup
F
T(
l
+
1
l
)
tests are insignificant for all l=1,..3.The sequential procedure therefore selects 0 breaks while BIC selects 4 breaks and the modified Schwarz criterion of Liu, Wu and Zidek (1994) selects 3 breaks. The results on the estimates of four break dates determined by BIC help to explain the contradictory results on the number of break dates. The confidence intervals surrounding the break dates for all models are extremely wide (not reported on table). This suggests that the model is imprecisely estimated. Given the documented facts (Bai and Perron 2003a) that the information criteria are biased and the sequential procedure perform better; we conclude that there is a little evidence in favor of the structural breaks in nominal interest rates of Turkey. The estimated break dates for monthly interest rates are given in Figure 1.
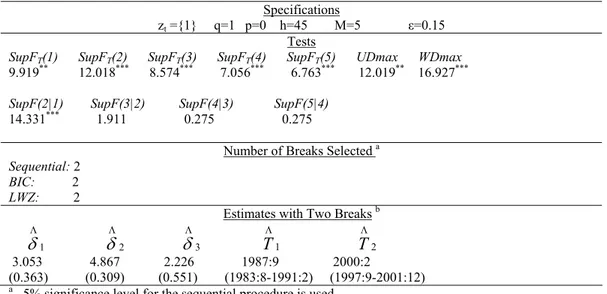
Estimation results of the inflation rates yield more clear results than those of nominal interest rates. In Table 2, UDmax, WDmax and the sup FT (k) tests suggest at least one break in inflation rates.
Table 2. Empirical Results for the Inflation Rates (1980:1-2004:12) Specifications
zt ={1} q=1 p=0 h=45 M=5 ε=0.15
Tests
SupFT(1) SupFT(2) SupFT(3) SupFT(4) SupFT(5) UDmax WDmax
9.919** 12.018*** 8.574*** 7.056*** 6.763*** 12.019** 16.927***
SupF(2|1) SupF(3|2) SupF(4|3) SupF(5|4)
14.331*** 1.911 0.275 0.275
Number of Breaks Selected a
Sequential: 2 BIC: 2 LWZ: 2
Estimates with Two Breaks b 1 Λ
δ
2 T Λδ
3 Λδ
1 Λ T 2 Λ 3.053 4.867 2.226 1987:9 2000:2 (0.363) (0.309) (0.551) (1983:8-1991:2) (1997:9-2001:12)a 5% significance level for the sequential procedure is used.
b In parentheses, reported are the standard errors (robust to serial correlation) for the estimated
regression coefficients and the 95% confidence intervals for the break dates. ** and *** denotes that the tests are significant at 5% and 1% levels respectively.
Cilt: 20, Sayı:2, Yıl: 2005, ss:81-93
Given this, the number of breaks can be chosen by the
)
1
(
sup
F
Tl
+
l
test or by the BIC and LWZ. Both thesup
F
T(
l
+
1
l
)
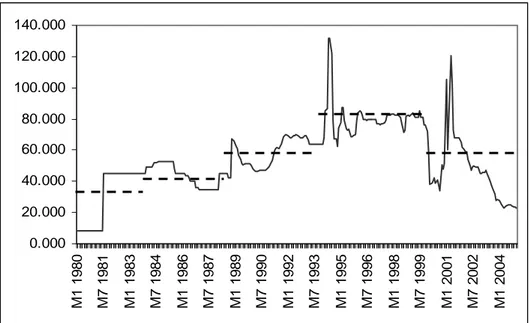
and the information criterions choose 2 breaks.3 The break dates are estimated at 1987:9 and 2000:2. The corresponding confidence intervals suggest that the break dates are estimated precisely. The estimated break dates for the inflation rates are illustrated by Figure 2.4. Concluding Remarks
Testing for structural change has always been an important issue in econometrics because a myriad of political and economic factors can cause the relationships among economic variables to change over time. Recently, Bai and Perron (1998) consider the estimation of multiple structural shifts in a linear model estimated by least squares. They propose some tests for structural change for the case with no trending regressors and a selection procedure based on a sequence of tests to estimate consistently the number of break points.
This paper aims to tests for multiple structural breaks in the nominal interest rate and inflation rate using the methodology developed by Bai and Perron (1998). The monthly data on Turkish 90 days time-deposits interest rate and consumer price index inflation rate over the period of 1980:1-2004:12 are used. The empirical results give little evidence of mean breaks in the interest rate series since the sequential procedure selects zero breaks.
3 The BP procedure was also applied for the quarterly data. Since the number of breaks found with quarterly data is the same with those of monthly data, the results for the
0.000 20.000 40.000 60.000 80.000 100.000 120.000 140.000 M 1 1980 M 7 1981 M 1 1983 M 7 1984 M 1 1986 M 7 1987 M 1 1989 M 7 1990 M 1 1992 M 7 1993 M 1 1995 M 7 1996 M 1 1998 M 7 1999 M 1 2001 M 7 2002 M 1 2004
Figure 1. The Estimated Four Breaks in the Nominal Interest Rates
-5 0 5 10 15 20 25 30 M 1 19 80 M 6 19 81 M 1 1 19 82 M 4 19 84 M 9 19 85 M 2 19 87 M 7 19 88 M 1 2 19 89 M 5 19 91 M 1 0 19 92 M 3 19 94 M 8 19 95 M 1 19 97 M 6 19 98 M 1 1 19 99 M 4 20 01 M 9 20 02 M 2 20 04
In contrast, the inflation rates appear to be well modeled by two mean breaks. The break dates are estimated at 1987:9 and 2000:2. The results obtained for the inflation rates are reasonable since the breaks coincide with important economic facts. It can be deduced that one reason for the instability of the inflation rates is due to the financial liberalization and the high government spending/debt made for the restructuring of the Turkish economy toward a free market economy in 1980s. The other reason for the instability of inflation in Turkey is clearly the 2000-2001 financial crises. On the hand, the mean of inflation rates decreases after the second break point at 2000:2. The improvement that resulted in lower inflation rates can be seen as the three-year program introduced in December 1999. The main objective of the 2000–2002 program was to reduce inflation to single-digit levels in medium term. To achieve these targets tight monetary and fiscal policy and comprehensive structural reforms were adopted as main policy measures.
ÖZET
Bu çalışmada, Bai ve Perron’un (1998) yöntemi kullanılarak, nominal faiz oranları ve enflasyon oranları için birden fazla yapısal kırılmanın test edilmesi amaçlanmaktadır. Türkiye’nin 1980:1-2004:12 dönemini kapsayan, aylık, 90 günlük mevduat faiz oranları ve tüketici fiyatları endeksinden oluşturulan enflasyon oranları serileri kullanılmaktadır. Ampirik bulgular, faiz oranları serisinde bir yapısal kırılma bulunduğu yolunda zayıf sonuçlar vermektedir. Ancak, enflasyon oranları serisinde, 1987:9 ve 2000:2 dönemlerinde olmak üzere, iki adet ortalama kırılması bulunduğu doğrulanmaktadır.
REFERENCES
ANDREWS, D.W.K., (1993), “Tests for Parameter Instability and Structural Change with Unknown Change Point”, Econometrica (61), 821– 856. ANDREWS, D.W.K. and PLOBERGER, W., (1994), “Optimal Tests When a
Nuisance Parameter is Present Only Under The Alternative”,
Econometrica (62), 1383–1414.
BAI, J. and P. PERRON (1998), “Estimating and Testing Linear Models with Multiple Structural Changes”, Econometrica, (66), 47–78.
BAI, J. and P. PERRON (2003a), “Computation and Analysis of Multiple Structural Change Models”, Journal of Applied Econometrics, (18),
BAI, J. and P. PERRON (2003b), “Critical Values for Multiple Structural Change Tests”, Econometrics Journal, (1), 1–7.
BAI, J. and P. PERRON (2004), “Multiple Structural Change Models: A Simulation Analysis”. In: Corbea, D., Durlauf, S., Hansen, B.E. (Eds.), Econometric Essays. Cambridge University Press. In press. BEN ARISSA, M.S. and JOUINI, J., (2003). “Structural Breaks in The US
Inflation Process”, Applied Economics Letters (10), 633–636.
BEN ARISSA, M.S., M. BOUTAHAR and JOUINI J. (2004), “Bai and Perron’s and Spectral Density Methods for Structural Change Detection in the US Inflation Process”. Applied Economics Letters, (11), 109– 115.
CHOW, G.C. (1960), “Tests of Equality between Sets of Coefficients in Two Linear Regressions”. Econometrica, (28), 591–605.
JOUINI, J. and M. BOUTAHAR (2005), “Evidence on Structural Changes in US. Time Series”, Economic Modelling, (22), 391-422.
LIU, J., S. WU and J.V. ZIDEK (1997), “On Segmented Multivariate Regressions”, Statistica Sinica, (7), 497–525.
PERRON, P. (1989), “The Great Crash, the Oil-Price Shock, and the Unit-Root Hypothesis”, Econometrica, (57), 1361– 1401.
QUANDT, R.E. (1958), “The Estimation of Parameters of a Linear Regression System Obeying Two Separate Regimes”, Journal of the American
Statistical Association, (55), 873– 880.
QUANDT, R.E. (1960), “Tests of The Hypothesis that a Linear Regression Obeys Two Separate Regimes”, Journal of the American Statistical
Association, (55), 324– 330.
YAO, Y.C. (1988), “Estimating the Number of Change-Points via Schwarz’ Criterion”, Statistics & Probability Letters, (6), 181– 189.
YAO, Y.C. and S.T. AU (1989), “Least Squares Estimation of a Step Function”,
Sankhya Series A, (51), 370–381.
YIN, Y.Q. (1988), “Detection of the Number, Locations and Magnitudes of Jumps”, Communications in Statistics, Stochastic Models, (4), 445– 455.
ZIVOT, E. and D.W.K. ANDREWS (1992), “Further Evidence on the Great Crash, the Oil-Price Shock, and the Unit-Root Hypothesis”, Journal of