https://doi.org/10.1007/s40899-020-00456-x
ORIGINAL ARTICLE
A study on the evaluation of the water quality status for the Büyük
Menderes River, Turkey
Ebru Yılmaz1 · Cengiz Koç2 · Ievgenii Gerasimov3
Received: 9 June 2020 / Accepted: 28 September 2020 / Published online: 17 October 2020 © Springer Nature Switzerland AG 2020
Abstract
This study was carried out to assess the water quality of the Büyük Menderes River, as per the criteria of water quality index (WQI) by analyzing 15 physical and chemical parameters in 8 observation stations. The WQI method is considered as one of the most efficient methods of measuring the quality of water. Average WQI values were calculated between 37.27 and 85.96 based on the stations examined, and average values based on months were calculated as 56.88 and 71.38. The highest WQI values at the stations were recorded during April, June, and October. The lowest WQI value was found in the Yenice station and the highest value was recorded at the Sarayköy bridge station. WQI values have varied over a wide range across the entire river. According to WQI scores, statu of river water quality varies between “good” and “very poor”. The water quality statu at the stations located at the upstream and downstream of the river route is “good”, but at the stations located in the central part of the river, can be classified as “poor” and “very poor”. This is mostly due to the aggregation of urban and rural settlements and all commercial activities, which are clustered in the middle part of the river route. Therefore, to prevent pollution of the river and to maintain the water quality, the wastewater originating from domestic sources as well as from industrial activities should be processed and treated before its discharge into the river, and the fertilizers and pesticides utilized in agriculture must be regulated throughout the basin to reduce their exposure to water.
Keywords Water quality index · Pollution · Water pollution · Water quality parameter · Büyük menderes river · Turkey
Based on the WQI evaluation points, the Büyük Menderes river provides valuable information about the general suit-ability of the water quality status and the locations where pollution is concentrated.
Introduction
An increase in the population, the growth of economic activities as well as urban expansion cause an increase in water demand. Excessive use of surface water and groundwater endangers a large number of sources due to the decrease in their present amounts and due to the degradation of their quality (Massoud 2012; Sahoo et al.
2015). In the world, rivers are considered as one of the important sources that provide water for a variety of rea-sons including drinking water, agriculture, ecology as well as the industry. In addition, rivers and their tributaries are used for the discharge of industrial wastewater, sewage, and agricultural drainage waters (Cude 2001a, b). Impair-ment of surface water quality is turning into a significant problem in various countries across the world (Witek and Jarosiewicz 2009), and as a result, monitoring the quality of water is included as one of the highest priorities in resource conservation policies (Simeonov et al. 2002). Recently, both developed and developing countries have increased their efforts to assess the quality of rivers (Kannel et al.
* Cengiz Koç [email protected] Ebru Yılmaz [email protected] Ievgenii Gerasimov [email protected]
1 Department of Aquaculture, Faculty of Agriculture, Adnan
Menderes University, Aydın, Turkey
2 Department of City and Regional Planning, Faculty
of Architecture, Muğla Sıtkı Koçman University, Muğla, Turkey
3 Research Department, National University of Water
2007a, b). Due to spatial and temporal changes in water quality, which are often difficult to interpret, it is essential to monitor the composition of the water (Kazi et al. 2009). The determination of the water quality is essential for the optimal allocation of different water sources based on the implementation and use of water conservation policies. Surface waters are generally evaluated using certain norms (Rosemond et al. 2008). Controlling the pollution of rivers caused by non-point sources such as agricultural flow is more difficult as compared to the pollution caused by point sources such as industrial discharges, which necessitates a good monitoring program that will provide timely warn-ings regarding any changes in the water quality of rivers (Koç 2008). Proper planning and efficient management/ operation of water resources require good knowledge and knowhow regarding water quality. These can be obtained through adequate temporal and spatial data collection efforts and then the subsequent analysis and the interpre-tation of this collected data (Yehia and Sabae 2011). Com-paring only the monitoring data on the variables related to water quality without providing a comprehensive assess-ment of water quality would be insufficient. Currently, the traditional reports of water quality are often very detailed and technical. To address this gap in the assessment of water quality, different Water Quality Indices (WQI: Water Quality Indices) have been formulated to integrate all the relevant water quality variables (Liou et al. 2004). The Water Quality Index (WQI) is one of the methods used to evaluate the water quality of surface water bodies such as rivers. It is widely accepted that WQI can combine various environmental parameters to produce a single dimension-less value, therefore, it offers tools for the rapid assess-ment and comparison of the water quality of various water systems (Wu et al. 2018). WQI is known to be simple and reproducible (Wu et al. 2018; Abbasi and Abbasi 2012). Various studies have been conducted to evaluate the WQI of water systems that contain living systems such as rivers in various parts of the world (Wu et al. 2018; Lumb et al.
2011; Sutadian et al. 2016). Since WQI aids in understand-ing the overall water quality status of the water source, it has been widely used in the world for evaluating surface and groundwater quality in recent years (Samantray et al.
2009; Sharma and Kansal 2011; Alam and Pathak 2010; Sebastian and Yamakanamardi 2013; Seth et al. 2014; Tyagi et al. 2013; Bhutiani et al. 2014; VishnuRadhan et al.
2017; Yadav et al. 2015; Dash et al. 2015; Krishnan et al.
2016; Kavıarasan et al. 2016). The primary objective for developing a usable WQI is to take several complex and detailed data sets related to water quality and transforming them into clear and usable information that helps even a non-professional to accurately understand the quality of the
water source (Akoteyon et al. 2011; Balan et al. 2012). The objective of WQI is to provide a single value for assess-ing the water quality of a source by convertassess-ing the list of parameters and their concentrations (in a water sample) into a single value, which provides a comprehensive analy-sis and understanding of the water quality. Furthermore, WQI allows the assessment of the suitability of the water to determine if it can be used for different purposes as well (Abbasi 2002). The water quality parameters to be included in the WQI model may vary according to what the water will be used for as well as with local preferences. WQI was created to integrate the various water quality parameters (Cude 2001a, b; Liou et al. 2004; Said et al. 2004). Taking into account the weight of water quality parameters, the WQI method was strongly advocated and used by institu-tions and institutes that are responsible for controlling the water supplies and water pollution. Various institutions and organizations such as Canadian Council of Ministers’ WQI, US National Sanitation Foundation’s WQI, British Columbia WQI, Oregon WQI, and Florida Stream WQI have used this parameter to assess the water quality (Debels et al. 2005; Kannel et al. 2007a, b; Abbasi 2002). WQI is also being actively utilized by countries such as Argen-tina, Brazil, Iran, the USA, Spain, and Malawi (Gor and Shah 2014a, 2014b). Various studies have been conducted to evaluate the WQI of water systems that also contain living systems such as rivers in the various parts of the world (Wu et al. 2018; Lumb et al. 2011; Sutadian et al.
2016). For achieving effective water management, water quality monitoring studies have priority to determine the current conditions and long-term trends. Büyük Menderes river examined in this study meets the water requirements of agriculture, drinking and domestic, industry, tourism and ecological life in the basin. In Büyük Menderes basin, food processing, leather and textile industries, and mining are important activities. There are 14 organized industrial zones in the basin. These sectors operated in the basin cre-ate a significant pressure on Büyük Menderes river wcre-ater quality and the basin. The pollution of river water caused by agricultural, industrial and domestic wastes threatens 2.5 million people living in the basin and their ecological values. Therefore, this study has aimed to evaluate and identify the changes in water quality status and pollution load of the Büyük Menderes basin and river, which is very significant in terms of agriculture, ecology, tourism, drink-ing water, industrial and utility water; by usdrink-ing WQI thor-ough the analysis of 15 physical and chemical parameters. Such a study is vital to water resources management, and also strengthens the knowledge base underlying water qual-ity assessment of rivers around the world.
Material and Methods
Material Study area
Büyük Menderes river is 584 km long. The Büyük Men-deres (BM) river basin is located in the west of the Anatolian peninsula. BM basin covers part of the provinces of Afyon-karahisar, Aydın, Burdur, Denizli, Isparta, İzmir, Kütahya, Manisa, Muğla, and Uşak. The area of the basin is 26,361 km2, which encompasses around 3% of Turkey’s land. BM
river is the main river basin and the longest river belong-ing to the Aegean region in Turkey. The river is the most important water body in the basin. The average annual flow volume in the river is about 302 × 109 m3, and the average
annual discharge is 110 m3/s. The basin has a continental
climate in the upstream region, and a Mediterranean climate in the coastal and downstream regions. The average annual temperature of the basin is 17.68 °C and the average annual precipitation is about 642 mm. The river is fed by many tributary rivers such as Banaz, Çürüksu, Çine, Dokuzsele, Dipsiz and Akçay creek. The basin consists of the most agri-culturally fertile soil of the country and is heavily dependent on agricultural production. 83% (about 1.6 × 10⁹ m3) of the
river water source is used by irrigation schemes under opera-tion services. Cotton, wheat, corn, alfalfa, sunflower, veg-etables, and fruits are the traditional crops of these areas by irrigation tradition. For the utilization of land in the Büyük Menderes River Basin, agricultural use predominates (about 44% of the total basin), then the semi-natural areas (about 33% of the entire basin) take the second place. Approxi-mately 20% of the basin land is covered with forests, and 1% with surface water (DSI 2009; Koç 2008). The population of the basin has reached 2.5 million persons, dispersed mostly in 323 municipalities, where only 179 of them have proper sewerage systems (SIS 2010).
Sampling stations and water quality parameters
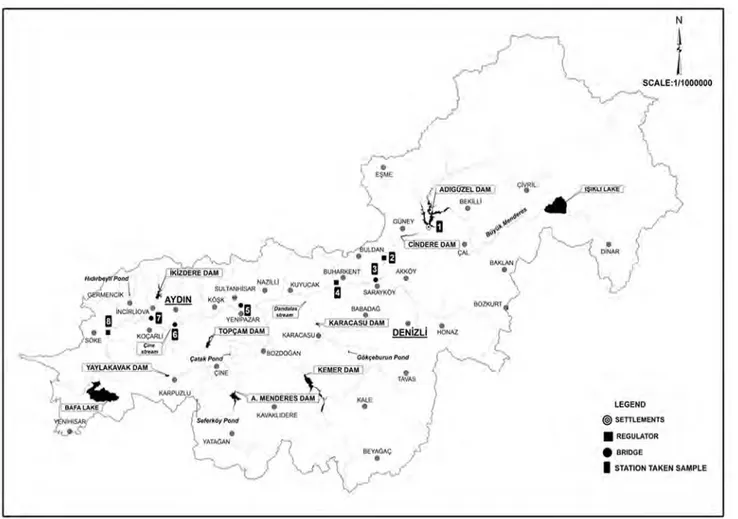
To determine the water quality of the Büyük Menderes river in Turkey, the water samples taken from 8 different stations (Adıgüzel dam output, Yenice regulator, Sarayköy bridge, Feslek regulator, Yenipazar bridge, Aydın bridge, Koçarlı bridge, Söke regülatör) located over the river have been analyzed (Fig. 1). These stations were selected primarily to identify critical water quality degradation owing to urban, industrial, agricultural, geothermal pollution. Adıgüzel dam output was called Station 1, Station 2 was Yenice regulator, located at 32 km from the Adıgüzel dam, which suffered pollution from discharges of domestic waste and pesticide into the river. Station 3 was the Sarayköy bridge, which is
affected by waste from textile factories, a geothermal plant, and Denizli-Sarayköy sewage. Station 4 was Feslek regula-tor, where the river is polluted with domestic waste, fer-tilizers, and pesticide packages. Station 5 was Yenipazar bridge, which is polluted by heavily used fertilizers and pesticide packages. Station 6 was Aydın bridge, which is affected by point sources of pollution, mainly untreated wastewater discharges from industrial zones and munici-pal sewage treatment plants. Station 7 was Koçarlı bridge, located shortly past the Çine and İkizdere streams, which join the Menderes River. Station 8 was the Söke regula-tor. Adıgüzel, Yenice and Sarayköy stations are located at the upstream of the river, Feslek and Yenipazar stations at the middle of the river, Aydın, Koçarlı and Söke stations at the downstream of the river. The examined parameters were measured at eight monitoring stations between 2013 and 2018 in February, April, June, August, October, and December. A total of 15 physicochemical parameters (pH, Electrical Conductivity (EC), Total Dissolved Solids (TDS), Chloride Cl−1), Nitrite-nitrogen (NO
2-N),
Ammonium-nitro-gen (NH3–N), Nitrate-nitrogen (NO3–N), Dissolved Oxygen (DO), Chemical Oxygen Demand (COD), Orthophosphates (o–PO4), Sulphates (SO4−2), Sodium (Na+1), Potassium
(K+1), Calcium (Ca+2), Magnesium (Mg+2). were analyzed
and evaluated for the purpose of examining the quality of the Büyük Menderes river by the Quality and Control Labora-tory of XXI Regional Directorate. SPSS 17 statistics pro-gram was utilized for data analysis. One-way analysis of variance (ANOVA) was applied to the data, and they were subjected to Tukey multiple comparison test. Differences between groups were evaluated at p < 0.05. To demonstrate the distribution of data, Box–plot graphs were used. Methods
Calculating water quality index (WQI)
The selected 15 parameters for this study were evaluated by the Water Quality Index (WQI) method. WQI is a very useful and efficient method for assessing the suitability of water quality, and serves as the basis for water quality assessment in relation to pollution load and water classifica-tion of the examined river. There are many parameters that can be tested in a water sample to be examined. However, WQI only reflects the parameters selected. Any index has the potential to miss something when a particular parameter is not included in laboratory analysis. There is no way to be completely objective in the selection process of param-eters (Abbasi and Abbasi 2012). WQI has been widely used and applied to data from a number of different geographical areas all over the world to calculate the WQI of various water bodies critical pollution parameters were considered (Abbasi 2002). WQI aims to give a single outcome value to
the water quality of the examined water source by converting the parameters list and their concentrations in a large sample into a single value. WQI, which is a very useful and efficient method, is calculated by using the Weighted Arithmetic Index method as explained by (Cude 2001a, b). According to this method, different water quality parameters are mul-tiplied by a weighting factor determined for each param-eter and then summed up using the simple arithmetic mean method. The WQI is calculated as per the quality stand-ards of drinking water recommended by the World Health Organization (WHO). The calculation of WQI is conducted by following the Weight Arithmetic Index method (Cude
2001a, b; Khwakaram et al. 2012), using the equations.
where Qi the quality rating of ith water quality parameter, Va
actual value of ith water quality parameters, Vi ideal value of water quality parameters [Vi can be obtained from standard (1)
Qi=[(Va− Vi)∕(Vs− Vi)] × 100
tables, Vi = 0 except for pH (Vi = 7), DO (Vi = 14.6 mg/l) (Tri-paty and Sahu 2005)], Vs recommended standard permissible
value for ith water quality parameter,
where Wi unit weight of ith water quality parameter,
Qn is calculated by the equation given below, k propor-tional constant, and calculated by the equation, k = [1/∑ 1/Si = 1,2,3…n], Si = Standard permissible value for ith water quality parameter,
where Qi the quality rating of ith water quality parameter, Wi unit weight of ith water quality parameter.
Water Quality Status (WQS) determined by Shweta Tyagi et al (2013) as per to the WQI score is presented in Table 1. (2)
Wi= k∕Si
(3) WQI = ∑QiWi∕∑Wi
Fig. 1 The stations taken sample from Büyük Menderes river SULTANHISAR ~ILLI ;uvUCM KO$K e
•
YENIPAZAR:
0
....
tlrffm TOP AM DAM KARACASUe e ULOAN• fl BUHARKENT.
.
m AKKOY ~.
D SAAAYKOY BABAOAG•
KARACASU DAM e DENIZLI G611~•burun Pond KALE•
•
TA.VAS NI
SCALE:1/1000000 LEGEND @) SETTLEMENTS•
REGULATOR • BRIDGEResults and discussions
The water quality of the Büyük Menderes river Chemical analysis results of water samples taken between the years of 2013–2018 from 8 stations located in Büyük Menderes River have been provided in Table 2 and the aver-age, standard deviation, minimum and maximum values have been given in Table 3.
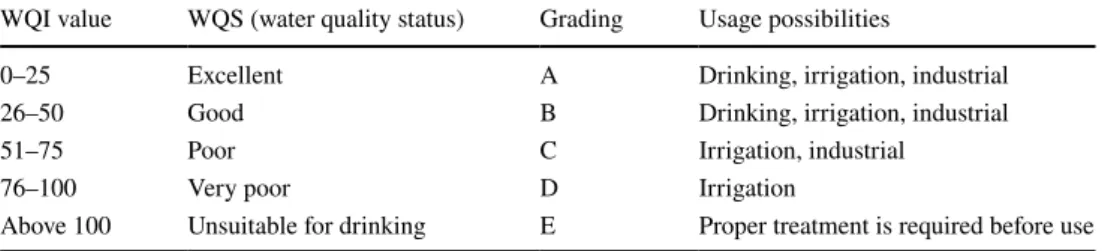
pH is one of the most significant parameters providing information about water quality. It affects the physical and biological reactions in the aquatic ecosystem, and the pH level is a measure of the acidity and alkalinity level of a solution (Kılıç 2018; Abdelali et al. 2018). The lowest pH value was recorded at the Adıgüzel dam outlet (7.83 ± 0.27b)
and the highest value was recorded at the Sarayköy bridge station (8.10 ± 0.21a) (Fig. 2, Table 2). The difference in
the values between the stations was found to be statistically significant (p < 0.05). Similar to our study, the highest pH value was found as 8.00 in the study conducted by Küçük (2007) on the Menderes river in 2004. In the study con-ducted by Yilmaz and Koç (2016a, b), pH values between 2000 and 2013 were found to be lowest (7.79 ± 0.18) at the output of Adıgüzel dam, and the highest (7.99 ± 0.26) at the Söke regulator. Similar pH results were found in the Tigris river (7.8–8.7) (Al-Obaidy Abdul-Hameed et al. 2015). Çürüksu Stream, which joins the Büyük Menderes River near Sarayköy, significantly transports pollution to the river. The biggest reason for the pollution of Çürüksu Stream is Gökpınar Stream, which carries the intense pollution origi-nating from Denizli to Çürüksu Stream. The high Ph value in Sarayköy bridge can be caused by excessive carbonate and bicarbonate ions resulting from agricultural drainage. In addition, it is thought that pollution from domestic and industrial wastewater may cause alkalinity in river water.
Electrical conductivity (EC) is a parameter that shows the ability to conduct current in the water and the total amount of dissolved salt or ions in water (Pal et al. 2015). The salinity of the waters to be used in irrigation or the melted solid content that it contains are expressed as elec-trical conductivity (Ayyildiz 1976). The lowest electri-cal conductivity (EC) data value was recorded at Yenice Regulator (721.54 ± 280.96c) and the highest EC value was
observed at the Feslek regulator (1774.88 ± 628.67a). (Fig. 2,
Table 2). The difference in values between the stations was found to be statistically significant (p < 0.05). According to the study conducted by Yilmaz and Koç (2016a, b), the EC values between 2000 and 2013 were found to be the low-est (785.80 ± 135.23) at the exit of Adıgüzel dam, and the highest (1997.39 ± 676.72) at the Feslek regulator. In differ-ent studies similar to our study, the EC value was given as (840.3) in the Markanda river, and subsequently, the Meriç river (697), the Tunca river (609), the Ergene river (1925) had respective EC values (Wats et al. 2019; Tokatli 2019). The total concentration of dissolved solids in irrigation waters generally ranges from 150–1500 mg/l.
Total dissolved solid (TDS) is defined as the amount of dissolved material in water and it is also one of the signifi-cant water quality parameters. It is utilized continuously to assess the water quality of rivers (Nemati and Naghipour
2014). TDS value was measured lowest at the Yenipazar bridge (383.47 ± 138.88d mg/l) and the highest value
was recorded at the Feslek regulator (1286.27 ± 500.22a
mg/l). (Fig. 2, Table 2). The difference between the sta-tions was found to be significant (p < 0.05). According to the study conducted by Yilmaz and Koç (2016a, b), they found the TDS values between 2000 and 2013 to be lowest (493.25 ± 105.04 mg/l) at the exit of Adıgüzel dam, and the highest (1379.86 ± 502.26 mg/l) at the Feslek regulator. TDS also represent a compound of inorganic ions in natural water from domestic and industrial wastes, that is, from detergent or Chloride, Bicarbonate, Fluoride, Sulfate, and other ions. TDS is strongly related to EC (Hadi et al. 2019). TDS is a measure of water-soluble substances (Kasem et al. 2019). The presence of high amounts of dissolved and suspended solids in water systems, lead to an increase in the need for biological and chemical oxygen, which consume dissolved oxygen levels in aquatic systems. Broadly, it can be stated that TDS levels demonstrate the pollutant load in the water system (Jonnalagadda and Mhere 2001). In different stud-ies similar to our study, the TDS value (198–1200 mg/l) in the Nile delta was determined in the Al-Gharraf River as (620–870 mg/l) and at the Noyyal river as (290–320 mg/l) (Mohamed et al. 2011; Ewaid et al. 2017; Usharani et al.
2010).
Chlorine (Cl−) value was measured lowest at the Adıgüzel
dam outlet (47.85 ± 7.64a) and the highest at the Koçarlı
bridge station (139.02 ± 403.50a) (Fig. 2, Table 2). It was
Table 1 Possible uses and WQS corresponding to WQI values
(Shweta Tyagi et al. 2013)
WQI value WQS (water quality status) Grading Usage possibilities
0–25 Excellent A Drinking, irrigation, industrial
26–50 Good B Drinking, irrigation, industrial
51–75 Poor C Irrigation, industrial
76–100 Very poor D Irrigation
Table 2 R esults of anal yses of w ater sam ples t ak en fr om t he Büyük Mender es Riv er
Values (mean ± SEM, n=3) wit
h differ ent superscr ip t le tters in t he same line ar e significantl y differ ent be tw een g roups (p < 0.05) St ations pH EC (μs/cm) TDS (mg/l) Cl − (mg/l) NO 2 -N (mg/l) NH 4 -N (mg/l) NO 3 -N (mg/l) DO (mg O/l)2 COD (mg/l) o-PO4 (mg/l) SO4 2− (mg/l) Na + (mg/l) K + (mg/l) Ca 2+ (mg/l) Mg 2+ (mg/l) Adıgüzel 7.83 ± 0.27 b 771.91 ± 114.13 e 458.19 ± 73.44 e 47.85 ± 7.64 a 0.08 ± 0.14 a 0.25 ± 0.25 a 1.15 ± 0.59 c 6.12 ± 2.13 cd 9.74 ± 5.88 c 0.10 ± 0.09 b 97.13 ± 17.84 d 48.16 ± 9.45 ef 6.20 ± 1.28 b 64.19 ± 10.38 cd 30.63 ± 3.69 d Yenice 8.04 ± 0.31 a 721.54 ± 280.96 e 537.58 ± 200.11 de 50.43 ± 21.28 a 0.04 ± 0.14 a 0.66 ± 1.95 a 1.44 ± 1.27 bc 9.62 ± 1.70 a 10.63 ± 9.44 c 1.66 ± 9.60 b 314.94 ± 135.84 d 56.57 ± 28.59 def 8.31 ± 6.97 ab 99.44 ± 37.58 b 33.16 ± 9.66 d Sar ayk öy 8.10 ± 0.21 a 1629.41 ± 611.53 ab 1218.97 ± 538.42 ab 134.76 ± 65.41 a 0.36 ± 0.81 a 0.68 ± 1.05 a 2.31 ± 1.79 ab 6.79 ± 1.75 bcd 25.13 ± 14.36 b 0.40 ± 0.31 b 462.30 ± 245.62 a 125.44 ± 55.06 ab 7.49 ± 2.83 ab 134.11 ± 49.83 a 78.46 ± 33.36 a Feslek 8.01 ± 0.12 a 1774.88 ± 628.67 a 1286.27 ± 500.22 a 123.94 ± 61.84 a 0.14 ± 0.24 a 0.71 ± 1.05 a 2.60 ± 1.56 a 5.56 ± 1.21 d 14.60 ± 10.52 c 0.37 ± 0.30 b 229.19 ± 137.45 a 131.47 ± 59.71 a 9.61 ± 3.31 a 133.08 ± 44.72 a 84.84 ± 39.33 a Yenipazar 8.06 ± 0.18 a 948.86 ± 205.45 de 383.47 ± 138.88 d 53.15 ± 17.14 a 0.04 ± 0.00 a 0.03 ± 0.02 a 2.24 ± 0.54 ab 8.8 ± 2.94 a 35.27 ± 17.26 a 0.01 ± 0.00 b 432.09 ± 185.27 cd 27.83 ± 5.98 f 7.01 ± 0.00 b 61.02 ± 28.15 d 48.10 ± 20.27 cd Aydın 8.04 ± 0.12 a 1360.19 ± 447.49 bc 981.22 ± 443.5 bc 87.17 ± 44.21 a 0.17 ± 0.66 a 0.44 ± 0.92 a 1.88 ± 0.99 abc 6.79 ± 0.96 bcd 9.60 ± 3.64 c 0.81 ± 1.34 b 223.66 ± 123.65 b 96.72 ± 45.83 bc 8.29 ± 3.12 ab 99.44 ± 37.58 b 77.00 ± 25.39 ab Koçar lı 8.04 ± 0.14 a 1120.83 ± 488.64 cd 763.80 ± 382.85 cd 139.02 ± 403.50 a 0.39 ± 1.24 a 0.49 ± 0.76 a 2.56 ± 1.87 a 7.11 ± 1.34 bc 14.42 ± 8.02 c 7.72 ± 17.59 a 104.16 ± 55.95 ab 72.66 ± 46.95 cde 7.11 ± 3.52 b 86.37 ± 36.63 bc 57.17 ± 27.55 e Sök e 8.09 ± 0.16 a 938.61 ± 588.17 de 753.90 ± 366.25 cd 82.87 ± 48.36 a 0.13 ± 0.26 a 0.36 ± 0.39 a 2.36 ± 1.64 a 7.47 ± 1.57 b 13.73 ± 6.96 c 0.83 ± 3.02 b 183.95 ± 86.22 ab 83.35 ± 41.62 de 7.69 ± 3.12 ab 81.26 ± 31.62 bc 59.04 ± 24.22 bc
determined that the difference between the stations was not significant (p > 0.05). Similarly, in the study conducted by Yılmaz and Koç (Yilmaz and Koç 2016a, b), it was detected lowest at the Adıgüzel dam outlet (50.81 ± 16.45), and high-est at the Sarayköy bridge location (160.14 ± 60.24 mg/l). In irrigation waters, chlorides are known as the most prob-lematic anions. It has been suggested that the chloride con-centration in the Ohio river should not exceed 125 mg/l per month. This value is stated as an average value. It was recommended that the maximum value should not exceed 250 mg/l. The reason for this recommendation is economic-based rather than public health concerns. In terms of health, if the chloride concentration is less than 125 mg/l, it is acceptable, if it is between 125 and 250 mg/l, it is considered as suspicious and if it is more than 250 mg/l, it is considered as unsuitable (Ayyıldız 1976). In different studies similar to our study, the Cl− value was determined at Hindon river as
(201–1326 mg/l), at Cauvery river as (176–254 mg/l) and at Narmada river as (30.5–209.79 mg/l) (Suthar et al. 2009; Abida and Abida 2008; Sharma et al. 2008).
Nitrite Nitrogen (NO2–N) value was measured lowest at the Yenipazar bridge (0.04 ± 0.00a) and the highest at the
Koçarlı bridge station (0.39 ± 1.24a). (Fig. 2, Table 2). It
was determined that the difference between the stations was not significant (p > 0.05). Similarly, in the study conducted by Yilmaz and Koç (2016a, b), it was detected lowest at the Adıgüzel dam outlet (0.02 ± 0.00g), and the highest at
Sarayköy bridge (0.13 ± 0.10a mg/l. In different studies
simi-lar to our study, NO2–N value was determined at Tunca river as (0.00–0.12 mg/l), at Drava river as (0.001–0.140 mg/l) and at Pearl river (as 0.001–0.156 mg/l) (Camur-Elipeka et al. 2006; Gvozdic et al. 2012; Ouyang et al. 2006).
Ammonium nitrogen (NH4-N) value was measured low-est at the Yenipazar bridge (0.03 ± 0.02a) and the highest
at Feslek regulator (0.71 ± 1.05a). (Fig. 2, Table 2). It was
determined that the difference between the stations was not significant (p > 0.05). In another study similar to our study, the NH4-N value was determined at the Dagang river as
(0.58 mg/L), in the Taipu river as (0.23 mg/L), and in Xu river as (0.72 mg/L) (Xiao-long et al. 2007). Since there is agricultural land around the Menderes river, the use of nitrated fertilizer is high here, hence the nitrate-nitrogen concentration value is also found to be high in the Feslek regulator. At this point, there is also a lack of dissolved oxy-gen due to the oxidation of organic matter. This situation increases the amount of ammonium nitrogen in the Feslek regulator. The presence of ammonium salts in irrigation waters has an effect of increasing dispersion in soil while lowering permeability in a discontinuous manner (Kalıpçı et al. 2017).
Nitrate Nitrogen (NO3–N) value was measured lowest at
the Adıgüzel dam outlet (1.15 ± 0.59c) and the highest at
the Feslek regulator (2.60 ± 1.56a). (Fig. 2, Table 2). The
Table 3 R esult of sam ples s tatis tical par ame ters com puted using t he c hemical dat a St ations pH EC (μs/ cm) TDS (mg/l) Cl − (mg/l) NO 2 -N (mg/l) NH 4 -N (mg/l) NO 3 -N (mg/l) DO (mg O/l)2 COD (mg/l) o-PO4 (mg/l) SO4 2− (mg/l) Na + (mg/l) K + (mg/l) Ca 2+ (mg/l) Mg 2+ (mg/l) n 288 288 288 288 288 288 288 288 288 288 288 288 288 288 288 Mean 8.03 1150.78 797.92 89.90 0.17 0.45 2.07 7.28 16.64 1.49 255.92 80.27 7.71 92.58 58.55 Std. de via-tion 0.21 589.18 482.97 150.86 0.60 0.99 1.44 2.17 13.30 7.49 189.43 53.17 3.64 43.06 31.65 Minimum 7 6.35 0.00 0.23 0.00 0.00 0.03 1.70 0.04 0.00 8.56 1.30 1.15 21.00 2.10 Maxi- mum 8.80 3470.00 2840 2478 6.40 9 8.13 14 69 57.69 1061.50 322 37 220.40 214.00
Fig. 2 Change graphics of pH, EC, TDS, Cl−1, NO
2N, NH4N, NO3N, DO values in the Büyük Menderes River
9,00 4000,00 ."8 ;" 93 261 8.50 0 0 •so~ 3000,00 101 199 2 . .
~
~
~
0 0 i 8,00~
f
~n¢
D ~ 2000,00~
~
"' m •" 0 0 0 116 0 "~
13' "' ., 0 * 0 7.50 ·" 1SS 1000,00~
$
* 0 13 o' "';37 0 " 7,00 7 .00 63Ad9,l::el Ayoo ,
....
Ko<;••,..,..,
....
Y - • Y~::• .._. Ayoo ,...
...
S.111yt6y....
Yorioo Y~:::•Stations Stations Title J000,00 " 2500,00 2'1 0 '500,00 2000,00 2000,00 1500,00 "' ~ 1500,00
~
~
•" u 1000,00 1000,00.
.," o., 169 i 1 0 500,00t
f
500,00 118 " 0 0 1'3 ,,s
$e
$
$ ,. " ,00 ·" ,00 -t1· .,so,-·-·
Ayoo ,,_-·
S.ayt6y....
y . . . . Y~::• Adlgu:::el.,
..
Feslek K~ark Saroyk~....
Yonko Yenlpa::arStations Stations 10,00 • 2"
..
* 6,00 •" 8,00 •" ."" .2" 6,00 .,01 z ,,oo z s I z z 191 o1" .,,in ,,oo:=
·" 119 ., 2,00~
gee.=
2,00 0237 *273 .133 '" 218,,279 0197 53 8" •" o6Q
0 "t;:; 2,2.'205 ,,. 277~~
~
198~1~11 .1 2•~,u•
~ ~6
,00 .la,...
...;;
,00·-·
.,..
,....
K~•I Sareytoy....
Y«$8::• Ad9,r.:el.,..
"""' K~•• S.oyl(6y
....
Yorioo Yeripo::a,Stations St.ltions 10 12,50 0~ •"
~
8,00 •" " 0276 10,00~
~
0~
.
.
.
o,,..
~
~
z 0 7,50~
8 0 z 0 ,,oo~
~
' 5,00 63 0~
0$
~
2,50 ,, 0 ,00._. Aydn Fulet
I(~-·
S.•yt.6y....
y . . . . YeniPa=•.
...,..,
..
Feslek Ko,;•• Serayk6y....
Venice Yef'llpe::•difference between the stations was found to be significant (p < 0.05). Similarly, in the study conducted by Yilmaz and Koç (2016a, b), it was detected lowest at the Adıgüzel dam exit (0.81 ± 0.60), the highest at the Sarayköy bridge station (2.44 ± 1.14 mg/l). In the study by Koç (2010), the amount of nitrate in the upstream of the Büyük menderes river was found to be 2.5 mg/l. In a different study, it was seen that the NO3-N value varies widely in the Warta river (0–18 mg/l) (Górski et al. 2019). It is thought that NO3-N concentration on the Sarayköy bridge is caused by excessive fertilizers mixed with water and factory wastes from factories that pro-duce chemical fertilizers.
Dissolved oxygen (DO) identifies biological changes cre-ated by aerobic or anaerobic organisms. Therefore, meas-urement of DO is important for maintaining aerobic treat-ment processes aimed at purifying domestic and industrial wastewater. The optimum value of DO for healthy aquatic life and good water quality is 4–6 mg/l (Alam et al. 2007; Avvannavar and Shrihari 2008). DO value was measured lowest at the Feslek regulator (5.56 ± 1.21d) and the highest
at the Yenice regulator (9.62 ± 1.70a). (Fig. 2, Table 2). The
difference between the stations was found to be significant (p < 0.05). Excessive DO is actually a desired condition for the natural treatment of surface waters and for life present in water. For this reason, the fact that it is high in the Yenice regulator should be considered as a positive situation.
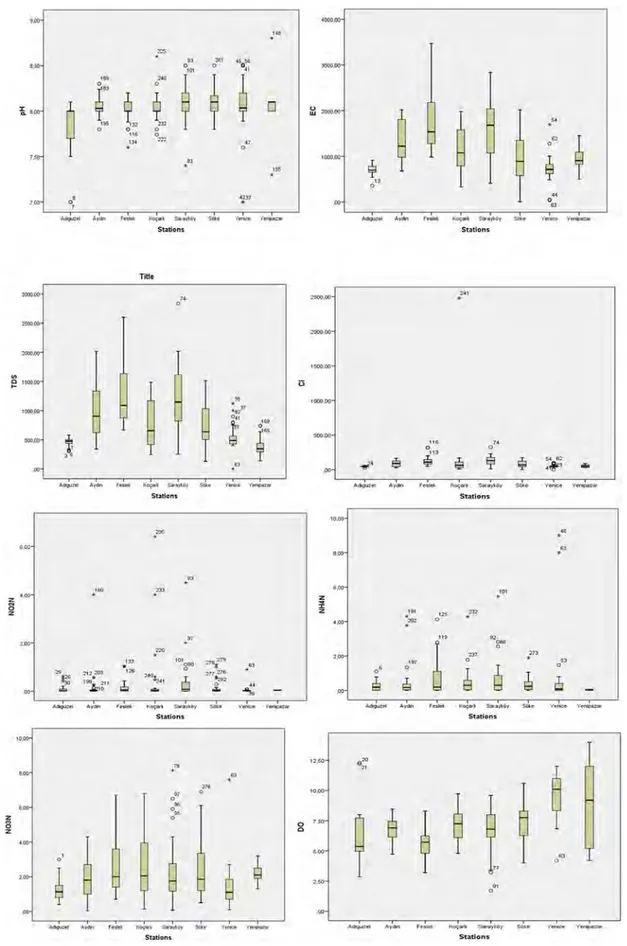
Chemical oxygen demand (COD) is an important index of organic pollution in the river. COD value was measured lowest at the Aydın bridge (9.60 ± 3.64c) and the highest at
Yenipazar bridge (35.27 ± 17.26a). (Fig. 3, Table 2). The
difference between the stations was found to be significant (p < 0.05). Similarly, in the study conducted by Yılmaz and Koç (2016), it was detected lowest at the Adıgüzel dam output (16.35 ± 13.30), the highest at the Sarayköy bridge (44.47 ± 28.94 mg/l). In the study conducted by Küçük (2007), the COD value was found between 20–126.7 mg/l. Low chemical oxygen demand in Aydın bridge means that organic pollution is low. In a different study, the COD value was determined to be 0.8–2.80 mg/L in the Mahi river (Gor and Shah 2014a, b). High COD values can be caused by the leaching of chemically degradable organic and inorganic waste matter originating from the surrounding regions which are intensely populated. In India, Chounhary et al. (2011) in their study reported about three dams that are polluted to some extent; but in the study, it was especially highlighted that the Kerwa dam is the most polluted dam as indicated by a very high value of COD. The primary pollution sources for Kerwa dam originate from the settlement around the dam as well as the daily activities of these settlements. In a study, conducted by Şener et al. 2017), it was demonstrated that an increase in the COD values in the Aksu River, Tur-key is caused by agricultural and industrial activities in the region. When we look at the parameter value of COD
from the industrial pollution load coming into the basin, it is mostly seen at Yenipazar station. 59% of the COD pollu-tion load coming to the basin comes from domestic sources (Koç 2015).
Phosphate (o-PO4) was measured lowest at the Adıgüzel dam outlet (0.10 ± 0.09b) and highest at the Koçarlı bridge
(7.72 ± 17.59a) (Fig. 3, Table 2). The difference between the
stations was found to be significant (p < 0.05). Similarly, in the study conducted by Yılmaz and Koç (2016), it was detected lowest at the Adıgüzel dam outlet (0.23 ± 0.09), and the highest at the Söke regulator which is near the Koçarlı bridge (0.42 ± 0.27 mg/l). Pollution in agricultural and resi-dential areas around the Koçarlı bridge causes an increase in phosphate levels. The total phosphorus (P) which occur the non-point pollution load in the basin come from Denizli, Aydın and Uşak provinces, respectively. It is observed that the non-point pollution load is mostly caused by agricul-tural areas since there is intensive agriculagricul-tural activity in the basin. It was determined that 64% of the total P load came from point sources and 36% from non-point sources. (DSİ 2016).
Sulfate (SO4−2) was measured lowest at the Adıgüzel
dam outlet (97.13 ± 17.84d) and highest at the Sarayköy
bridge station (462.30 ± 245.62a). (Fig. 3, Table 2). It was
determined that the difference between the stations is impor-tant (p < 0.05). In the study conducted by Yilmaz and Koç
(2016a, b), the lowest value was recorded in the Yenice
bridge station (108.38 ± 100.47), and the highest value in the Feslek regulator (580.81 ± 245.04 mg/l). The reason for the high concentration of sulfate in the Sarayköy Bridge can be attributed to the density of industrial activities and the feeding of approximately 57% of the Büyük Menderes River with the water coming from the Çürüksu Stream.
Sodium (Na+) was measured lowest at the Yenipazar
bridge (27.83 ± 5.98f) and highest at the Feslek regulator
(131.47 ± 59.71a) (Fig. 3, Table 2). The difference between
the stations was found to be significant (p < 0.05). Soil saturated with sodium shows an oily appearance. Colitis of Sodium soil causes swelling, clogs the soil pores, reduces the air and water permeability of the soil, and raises the pH of the soil solution to harmful levels. In the study conducted by Yılmaz and Koç (2016), the lowest value was detected in the Yenice bridge station (75.26 ± 36.50), and the highest value was recorded in the Feslek regulator (153.30 ± 73.76 mg/l). In another study, the value of Na was determined at Kosi River as (8.4–8.8 mg/l), at Cauvery river as (6.8–40 mg/l) and at Asi river as (7.82–126.96 mg/l) (Bhandari and Naya
2008; Begum and Harıkrıshna 2008; Kılıc and Yücel 2018). Potassium (K+) was measured lowest at the Adıgüzel dam
outlet (6.20 ± 1.28b) and the highest at the Feslek regulator
(9.61 ± 3.31a) (Fig. 3, Table 2). The difference between the
stations was found to be significant (p < 0.05). In the study conducted by Yilmaz and Koç (2016a, b), it was detected
Fig. 3 Change graphics of COD, O-PO4, SO4, Na, K, Ca, Mg values in the Büyük Menderes River ~ 0 0 u '"" 40,00 1200,00 1000,00 Ol0.00 ~ 600,00 40,00 30.00 ~ 20,00 .00 122 23S * 0 '" "' 0 Stations Stations
.,,
.'" •" ,. 62;61 "Adlgu::el Aydn feslek Koc;ar• Saraytiiy Soke Veriee Yenpa:ar
Stations 250.00 *116 200.00 *113 150,00
~
I~
100,00 so.oo 'i' ,,. .oo 0 Adlgu::el Aydrl ,...
60,00 50.00 40,00 ~ ~ 30,00 0 20,00 400,00 J00.00 250.00 200,00 .oo~
K~• SaraytOy Stations "' "',,
,.
"' 0 "' :250 ."' StationsAdlguzel Aytrl Feslet K~• Saraytay sote Veriee Y~:ar
Stations
Ad!guzel Aydin Feslet Koc;ar• Sarayt,,ay sote Venice Yeripa:ar
Stations
~
~
~
lowest at the Adıgüzel dam outlet (6.20 ± 1.27), and high-est at the Feslek regulator (10.85 ± 3.77 mg/l). In different studies, the K+ value was found to be (0.08–0.19 mg/l) in
the Ossah river and as (1–5 mg/l) in the Nambol river (Don-ald and Blesssing 2019; Devi et al. 2015). Potassium is the fourth naturally occurring cation in the freshwater ecosys-tem and it is always found in lesser amounts than sodium, calcium, and magnesium (Siddiqui 2007).
Calcium (Ca+2) was measured lowest at the Yenipazar
bridge (61.02 ± 28.15d) and the highest at the Sarayköy
bridge (134.11 ± 49.83a) (Fig. 3, Table 2). The
differ-ence between the stations was found to be significant (p < 0.05). In the study conducted by Yilmaz and Koç
(2016a, b), it was detected lowest at the Adıgüzel dam exit
(75.90 ± 25.24), and the highest at the Sarayköy bridge (149.02 ± 51.90 mg/l). In different studies, Ca2+ value
was determined as (2.10–2.73 mg/l) in Taylar stream, it was determined in Nigerian river as (1.37–2.62 mg/l), in Coruh river as (63.75–76.24 mg/l) and in Nambol river as (5.6–12.8 mg/l) (Aigberua and Tarawou 2019; Donald and Blessing 2019; Birici et al. 2017; Devi et al. 2015). In their study, Küçük (2007) determined the calcium value in the Menderes river as 53–174 mg/l.
Magnesium (Mg+2) was measured lowest at the Adıgüzel
dam outlet (30.63 ± 3.69d) and highest at the Feslek
regu-lator (84.84 ± 39.33a) (Fig. 3, Table 2). The difference
between the stations was found to be significant (p < 0.05). Similar to our study, in the study conducted by Yilmaz and Koç (2016a, b), it was detected lowest at the Adıgüzel dam outlet (38.65 ± 9.59) and the highest at the Feslek regulator (109.87 ± 45.58 mg/l). In different studies, Mg2+
value of (0.58–1.07 mg/l) was found in Taylar stream, in Nyando river as (0.02–0.25 mg/l) and in Köprüçay river as (23.28–1275.75 mg/l) (Aigberua, and Tarawou 2019; Achieng et al. 2019; Erdoğan and Ertan 2016). Küçük (2007) determined the magnesium value in the Büyük Men-deres river to be between 26.7 and 116.7 mg/l.
WQI analysis for the Büyük Menderes river
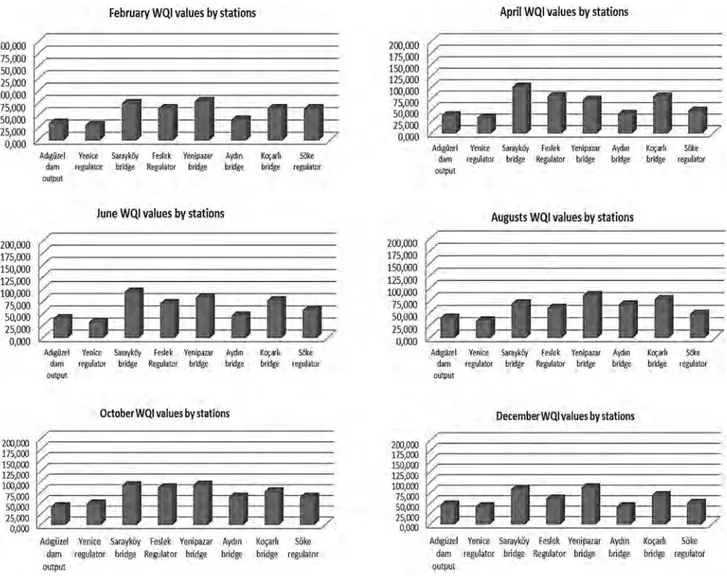
The first step in the WQI method is to calculate the weight value determined for each chosen physical and chemical parameter. Water samples taken from 8 stations determined on the Büyük Menderes river were analyzed as per 15 main physical and chemical parameters. WQI values of 8 sta-tions determined from the upstream to the downstream of the river were calculated and water quality analyzes were examined. The WQI values at the stations, based on the months from which water samples were taken, are presented in Fig. 4, and the WQI values calculated by months on the basis of the stations are presented in Fig. 5. Average WQI values vary between 37.27 and 85.96 on a monthly basis at the stations. The highest WQI values were realized in
Sarayköy, Feslek, and Yenipazar bridges. The highest WQI value was calculated at the Sarayköy bridge station in April with 101.27. In addition, the Koçarlı bridge has a partly High WQI value. According to the calculated WQI values, the water quality status in these stations is between “good” and “very poor” quality limits. For this reason, the current water supply is within the usable limit for only irrigation. The highest WQI values were calculated in April, June, and October. Considering the average WQI values in the years examined in Fig. 6, the highest WQI values were real-ized in Sarayköy, Feslek, Yenipazar, and Koçarlı bridges. In the 8 stations examined, the lowest WQI score was in the Yenice regulator (37.27) and the highest score was in Sarayköy bridge (85.96). The pollution is concentrated in the central part of the Menderes basin. WQI scores varied over a wide range along the entire river route. According to the average monthly values in the years examined for each station, at the exit of Adıgüzel, WQI value is 40.66 (good), Yenice regulator 37.27 (good), Sarayköy bridge 85.96 (very poor), Fezlek regulator 70.78 (poor), Yeni-pazar bridge 83.62 (very poor), Aydın bridge 50.74 (poor), Koçarlı bridge 74.21 (poor), and finally, the WQI value for the Söke regulator is 55.74 (poor). In the years stud-ied, WQI values at Adıgüzel station were between 30.05 and 42.60, Yenice bridge 30.79–49.35, Sarayköy bridge 69.31–101.27, Feslek regulator 64.36–86.69, Yenipazar bridge 72.92–92.94, Aydın bridge 41.45 and 67.13, Koçarlı bridge 64.89 and 79.87, Söke regulator was between 48.30 and 65.05. Average WQI values by stations in the studied years are presented in Fig. 7. Considering the WQI values given in the Fig. 7 for the years examined, Sarayköy, Feslek, Yenipazar, and Koçarlı bridges are within the “poor and very poor” water quality status. 87% of the existing water source in the Büyük Menderes river is used for irrigation. In this context, the existing water supply in the river can only be used for irrigation purposes. WQI scores were also high, since the weight values related to COD, DO, NH4-N, and K parameters were high. In particular, the high flowing water released from the dams to the riverbed in August reduces the pollution concentration, as the high flow rates formed in the riverbed, due to the increase in rains in October and December, decrease pollution concentrations, and hence the WQI values decrease accordingly. Especially in April and June, pollution concentrations increase and thus WQI values increase due to the low rainfall and due to the stoppage of water release for irrigation from the dams to the riverbed. In the winter season, the riverbed flow rate is lower compared to the main bed flow rate, so the point pollution flow rates are more effective in winter than the irrigation period. The water quality status of the Büyük Menderes river is in the range of “good” and “very poor” according to the calculated WQI values, considering the stations and years examined. The water quality status in the upstream and downstream
regions of the basin is in the “good”, however, the water quality status in the central part of the river is in the “poor” and “very poor”. This is due to the concentration of urban and rural settlements in the middle part of the riverbed route and the gathering of all commercial activities in this region. The waters in this category can only be used for irrigation. The source of pollution in Sarayköy, Yenipazar, and Koçarlı bridges are wastewater from industrial facilities, intensive agricultural activities, and settlements in the region. In the Feslek regulator, it is caused by geothermal power plants and intensive agricultural activities and settlements (Koç
2007). In addition, the Büyük Menderes river passes right
in the middle of the basin and intense urban and rural set-tlements have been developed on both sides of the river, and industrial facilities have also subsequently increased. In this context, demographic and socioeconomic pressures on the river and basin are increasing. The high WQI scores observed in the river basin are primarily due to various anthropogenic activities such as direct wastewater and sew-age inflow from residential and commercial establishments in the region, lack of proper sanitation systems, wastes from agricultural activities, direct release of untreated wastewater from small and large-scale industries and factories to the riverbed. The major point source pollutants which threaten Fig. 4 WQI values in stations as per the months
200,00 175,00 150,00 125,00 100,00 75,00 50,00 25,00 0,00 200,00 175,00 150,00 125,00 100,00 75,00 50,00 25,00 0,00 200,00 175,00 150,00 125,00 100,00 75,00 50,00 25,00 0,00 200,00 175,00 150,00 125,00 100,00 75,00 50,00 25,00 0,00 February February February February
Ad1giizel dam output WQI values by months
April June August October December
Saraykoy bridge WQI values by months
April June August October December
Yenipazar bridge WQI values by months
April June August October December
Ko~arh bridge WQI values by months
April June August October December
200,00 175,00 150,00 125,00 100,00 75,00 50,00 25,00 0,00 200,00 175,00 150,00 125,00 100,00 75,00 50,00 25,00 0,00 200,00 175,00 150,00 125,00 100,00 75,00 50,00 25,00 0,00 200,00 175,00 150,00 125,00 100,00 75,00 50,00 25,00 0,00
Yen ice Regulator WQI values by months
February April June August October December
Feslek Regulator WQI values by months
February April June August October December
Aydin bridge WQI values by months
February April June August October December
Soke Regulator WQI values by months
the Büyük Menderes Basin can be grouped as domestic and industrial wastewater, leakage, olive black-water and geo-thermal waters. The main industrial sectors that can create a pollution load within the Büyük Menderes Basin are textile, leather and olive oil production. Textile fabricates operating
in the basin are concentrated in Denizli and Uşak provinces. Although most of the fabricates have Wastewater Treat-ment Plants (WWTP), many fabricates do not operate their WWTPs and leave their wastewater to the Büyük Menderes river. As of today, the pollution situation in Büyük Menderes Fig. 5 WQI values as per the months in stations
Fig. 6 Average WQI values at stations 200,000 175,000 150,000 125,000 100,000 75,000 50,000 25,000 0,000 Ad,guzel dam output 200,000 175,000 150,000 125,000 100,000 75,000 50,000 25,000 0,000 Ad1gOzel dam output 200,000 175,000 150,000 125,000 100,000 75,000 50,000 25,000 0,000 Ad,guzel dam output
February WQI values by stations
Venice Saraykfy fe~ek Yenipazar Aydin
regulator brilge Regulator bridge brilge
June WQI values by stations
Venice Saraykfy fe~ek Yenipazar Aydin
regulator brilge Regulator brilge brilge
OctoberWQI values by stations
Venice Saraykay Fe~ek regulator bridge Regulator
Venipazar Aydm bridge bridge 200.000 175.000 150.000 125.000 100.000 75.000 50.000 25.000 0.000 Ko,;arh Siike brilge regulator Ko,;arh Siike bridge regulator Ko,arl, Sake bridge regulator Ad1guzel dam output Yen ice regulator 200,000 175,000 150,000 125,000 100,000 75,000 50,000 25,000 0,000 200,000 175,000 150,000 125,000 100,000 75,000 50,000 25,000 0,000 200,000 175,000 150,000 125,000 100,000 75,000 50,000 25,000 0,000 Saraykoy bridge
April WQI values by stations
Ad1guzel Venice Saraykfy fe~ek Yenipazar Aydin dam regulator brilge Regulator brilge bridge
output
Augusts WQI values by stations
AclgOzel Venice Saraykfy fe~ek Yenipazar Aydin dam regulator brilge Regulator brilge brilge
output
December WQI values by stations
Ad1guzel Venice Saraykay Fe~ek Venipazar Aydm dam regulator bridge Regulator bridge bridge
output
Feslek Yenipazar Aydin bridge Ko~arll bridge Regulator bridge Ko,;arh Siike bridge regulator Ko,;arh Siike brilge regulator Ko,arl, Sake bridge regulator
Soke regulator
basin is not sustainable. Büyük Menderes Basin pollution prevention program should be prepared immediately, and implemented. Rather than establishing the necessary meas-ures program to ensure the environmental objectives of the measures to be taken, it is the effective implementation of this created program. Therefore, issues such as the base, applicability and acceptance by the implementers of the program should be taken into account while creating the measures program.
Conclusion
The WQI method is an effective method used to evaluate and manage water quality. Based on the WQI evaluation points, the Büyük Menderes river provides valuable information about the general suitability of the water quality statu and the locations where pollution is concentrated. It emphasizes the distinctive features of physical and chemical parameters of various importance that affect the overall water quality of the river. The change of WQI values in the basin was exam-ined on a monthly basis and within the context of examexam-ined station points. The basic data obtained in this study, their analysis and interpretation, and the determination of the fac-tors affecting the Büyük Menderes river will help us develop our knowledge base on the status of the water quality of a socioeconomically vital system.
This work carried out has importance both academically and practically. Based on the observed WQI assessment results, it can be concluded that effective and efficient water treatment measures are urgently required to improve the river water quality by defining an appropriate water quality management plan to support a future plan for sustainable river restoration.
More work should be done to further illuminate this important river which feeds the basin in terms of agriculture, industry, tourism, ecology and drinking water. Some param-eters should be added to cover as possible as the current situation of Büyük Menderes River. A strategic plan should
be prepared to define how to protect the environment and how to inform local people about this pollution produced.
Taking measures including preventing raw sewage flows from residential and commercial areas, limiting direct drain-age of rainwater drains into the river, and preventing solid waste discharge by communities living alongside the river will significantly improve the water quality of the river.
The population is increasing rapidly every year due to migrations in the basin. The infrastructure needs of the growing population must be met regularly. There is an increase in the amount of domestic waste with the increase in population. To prevent this, separate systems should be established with one system for the drainage of sewage and treatment plants and a separate system for the drainage of rainwater. Furthermore, the regular operation of sewage treatment plants should be enforced.
To protect and improve water quality, the textile industry, leather industry, organized and individual industry factories, olive oil, and similar enterprises operating in the same field of work, as well as geothermal power plants, are required to discharge their wastewater into the river after treatment. The olive oil production facilities function as both point pol-lution source and a diffuse polpol-lution source. Some olive oil production facilities treat wastewater, and the effluent water becomes a source of point pollution. Some facilities accu-mulate their wastewater in pools. These pools overflow with excessive rainfall, so these facilities cause diffuse pollution.
To achieve the expected benefits from fertilizing in the basin agricultural areas, the type and the amount of ferti-lizer to be applied should be determined according to the nutrient needs of the plant to be grown as well as by the soil and climate characteristics, and then the farmers should be informed about the type, amount, time and the best methods for applying the fertilizer. In this manner, the use of exces-sive and untimely fertilizers should be prevented, and the transport of nitrogen and phosphate to the riverbed should be minimized by surface and underground flows.
To ensure sustainable natural resource management in the basin and to improve the river water quality, integrated river basin management should be initiated (Koç 2015). In Fig. 7 Average WQI values by
stations in the years studied
200.00 175.00 150.00 "' 125.00 QI ..:! "' 100.00 >
a
75.00 ~ 50.00 25.00 0.00Ad1guzel Yen ice dam output regulator
Saraykoy bridge Feslek Yenipazar regulator bridge Aydin bridge Ko,arl1 bridge 56ke •2013 •2014 •2015 •2016 •2017 •2018 regulator Stations
addition, integrated watershed management plans for the basin should be prepared, the legal infrastructure should be established, and it must be ensured that water users partici-pate in watershed water management.
References
Abbasi SA (2002) Water quality indices, state of the art report (pp 73). Scientific Contribution No. INCOH/SAR-25/2002. In: Roorkee: INCOH, National Institute of Hydrology, pp 77
Abbasi T, Abbasi SA (2012) Water Quality Indices, Elsevier 1st Edi-tion, Kindle Edition. Amsterdam, Netherland, pp 384
Abdelali KM, Taştan Y, Sönmez AY (2018) Investigation of Beyler Dam Lake water quality in terms of some physical and chemical parameters. Mar Sci Tech Bull 7(1):21–27
Achieng GO, Shikuku VO, Andala DM, Okowa GM, Owuor JJ (2019) Assessment of water quality of the Nyando River (Muhoroni the water quality index (WQI) method. Int Res J Environ Sci 8(2):27–33
Aigberua A, Tarawou T (2019) Water quality index (WQI) assessment along inland fresh waters of Taylor Creek in Bayelsa State, Nige-ria. J Environ Treat Tech 7(3):260–269
Akoteyon IS, Omotaya AO, Soladoye O, Olaoye HO (2011) Determina-tion of water quality index and suitability of urban river for munic-ipal water supply in Lagos, Nigeria. Eur J Sci Res 54(2):263–271 Alam M, Pathak JK (2010) Rapid assessment of water quality index of
Ramganga River, Western Uttar Pradesh (India) using a computer programme. Nat Sci 8(11):1–8
Alam JB, Hossain A, Khan SK, Banik BK, Islam MR, Muyen Z, Rah-man MH (2007) Deterioration of water quality of Surma river. Environ Monit Assess 134:233–242
Al-Obaidy A-HJ, Al-Janabi ZZ, Shakir E (2015) Assessment of water quality of Tigris River within Baghdad City. Mesopotamia Envi-ron J 1(3):90–98
Avvannavar SM, Shrihari S (2008) Evaluation of water quality index for drinking purposes for river Netravathi, Mangalore, South India. Environ Monit Assess 143:279–290
Ayyildiz M (1976) Sulama suyu kalitesi ve sulamadaki tuzluluk prob-lemleri, Ankara Üniversitesi, Ziraat Fakültesi Yayınları 636, Ders Kitabı 199, Sayfa 258
Balan IN, Shivakumar M, Kumar PDM (2012) An assessment of groundwater quality using water quality index in Chennai, Tamil Nadu, India”. Chron Young Sci 3(2):146–150
Beguda A, Harıkrıshna A (2008) Study on the quality of water in some streams of Cauvery river. E-J Chem 5(2):377–384
Bhandarı NS, Nayal K (2008) Correlation study on physico-chemical parameters and quality assessment of Kosi River water, Uttara-khand. E-J Chem 5(2):342–346
Bhutiani R, Khanna DR, Kulkarni DB, Ruhela M (2014) Assessment of Ganga river ecosystem at Haridwar, Uttarakhand, India with reference to water quality indices. Appl Water Sci 6(2):107–113 Birici N, Karakaya G, Şeker T, Küçükyılmaz M, Balcı M, Özbey N,
Güneş M (2017) Evaluation of Coruh river (Bayburt) water qual-ity in accord with water pollution control regulation. Int J Pure Appl Sci 3(1):54–64
Camur-Elipeka B, Arslanb N, Kirgiza T, Oterlera B (2006) Ben-thic macrofauna in Tunca River (Turkey) and their relation-ships with environmental variables. Acta Hydrochim Hydrobiol 34(4):360–366
Choudhary R, RawtanI P, Vıshwakarma M (2011) Comparative study of drinking water quality parameters of three manmade reser-voirs i.e. Kolar, Kaliasote and Kerwa Dam. Curr World Environ 6(1):145–149
Cude C (2001a) Oregon water quality index: a tool for evaluating water quality management effectiveness. J Am Water Resour Assoc 37:125–137
Cude CG (2001b) Oregon water 31 quality index a tool for evaluating water quality management effectiveness. JAWRA J Am Water Resourc Assoc 37(1):125–137
Dash A, Das HK, Mısra B, Bhuyan NK (2015) Evaluation of water quality of local streams and Baitarani River in Joda area of Odi-sha. India Int J Curr Res 7(3):13559–13568
Debels P, Figueroa R, Urrutia R, Barra R, Niell X (2005) Evaluation of water quality in the Chilla’n River (Central Chile) using physico-chemical parameters and a modified water quality index. Environ Monit Assess 110:301–322
Devi WS, Singh KR, Meitei NS (2015) Assessment of water qual-ity index of Nambol river, Manipur, India. Univ J Environ Res Technol 5(3):165–172
Donald AE, Blessing UA (2019) Index approach to water quality assessment of a south eastern Nigerian river. Int J Fish Aquat Stud 7(1):153–159
DSI (2009) Annual evaluation report of irrigation activities in DSI-operated and transferred schemes, General Directorate of State Hydraulic Works (DSI), Operation and Maintenance Department, Ankara, p 19
DSI (2016) Technical assistance for the conservation of river basin action plans into river basin management plans. In: Büyük Men-deres River Basin Management. The Project financed by EU and Republic of Turkey, Abstract, p 13, Aydın, Turkey
Erdoğan Ö, Ertan ÖO (2016) Some water quality of Köprüçay river river mouth area investigation of parameters. Suleyman Demirel Univ Yalvaç Acad J 1(1):58–66
Ewaid SH, Abed SA (2017) Water quality index for Al-Gharraf River, southern Iraq. Egypt J Aquat Res 43(2):117–122
Gor A, Shah A (2014a) Water quality index of Mahi River, Vadodara, Gujarat. Int J Eng Develop Res 2(3):3214–3219
Gor A, Shah A (2014b) Water quality index of Mahi river, Vadodara, Gujarat. IJEDR 2(3):3214–3219
Górski J, Dragon K, Kaczmarek PMJ (2019) Nitrate pollution in the Warta River (Poland) between 1958 and 2016: trends and causes. Environ Sci Pollut Res 26:2038–2046
Gvozdic V, Brana J, Malatesti N, Roland D (2012) Principal component analysis of surface water quality data of the River Drava in eastern Croatia (24 year survey). J Hydroinfor 14(4):1051–1060 Hadi MP, Fadlillah LN, SihTifani AR, Ramdan VK (2019) Heavy
metal pollution and water quality assessment In Belik river Yog-yakarta. IOP Conf Ser Earth Environ Sci 2019:1–8
Jonnalagadda SB, Mhere G (2001) Water qualıty of the Odzı rıver in the eastern hıghlands of Zımbabwe. Wat Res 35(10):2371–2376 Kalıpçı E, Cüce H, Toprak S (2017) Spatial analysis of surface water
quality of Damsa dam (Nevşehir) by geographic information sys-tems. Karaelmas J Sci Eng 7(1):312–319
Kannel PR, Le S, Lee YS, Kanel SR, Khan SP (2007a) Application of water quality indices and dissolved oxygen as indicators for river water classification and urban impact assessment. Environ Monit Assess 132:93–110
Kannel PR, Lee S, Lee YS, Kanel SR, Khan SP (2007b) Application of water quality indices and dissolved oxygen as indicators for river water classification and urban impact assessment. Environ Monit Assess 132:93–110
Kasem R, Karbassi AR, Omidvar B, Sarang A (2019) Stability and speciation of heavy metals and metalloids in Tajan River water, North of Iran. Int J Environ Sci Technol 2019:1–8
Kavıarasan M, Geetha P, Soman KP (2016) GIS-based groundwater monitoring in Thiruvannamalai District, Tamil Nadu, India. In: Proceedings of international conference on soft computing sys-tems, vol 397, Springer, India, pp 685–700
Kazi T, Arain M, Jamali MK, Jalbani N, Afridi H, Sarfraz R, Baig J, Shah AQ (2009) Assessment of water quality of polluted lake using multivariate statistical techniques: a case study. Ecotoxicol Environ Saf 72:301–309
Khwakaram AI, Majid SN, Sharma NY (2012) Determination of Water Quality (WQI9 for Oalyasan Stream in Sulaiman City Kurdistan Region of Irak. Int J Plant Anim Environ Sci 2(4):148–157 Kılıç E (2018) Impact of Syrian civil war on water quality of Turkish
Part of Orontes river. Pollution 4(3):503–513
Kılıc E, Yücel N (2018) Determination of spatial and temporal changes in water quality at Asi river using multivariate statistical tech-niques. Turk J Fish Aquat Sci 19(9):727–737
Koç C (2007) Effects on Environment and Agriculture of Geothermal Wastewater and Boron Pollution in Great Menderes Basin. Envi-ron Monit Assess 125:377–388
Koç C (2010) A study on the pollution and water quality modeling of the river Buyuk Menderes, Turkey. Clean-Soil Air Water 38(12):1169–1176
Koç C (2015) A study on the role and importance of irrigation man-agement in integrated river basin manman-agement. Environ Monitor Assess 187(8):488
Krishnan G, Singh S, Sıngh RP, Ghosch NC, Khanna A (2016) Water quality index of groundwater of Haridwar District, Uttarakhand. India Water Energy Int 58(10):55–58
Küçük S (2007) Büyük Menderes Nehri Su Kalite Ölçümlerinin Su Ürünleri Açısından İncelenmesi. Adü Ziraat Fakültesi Dergisi 4(1–2):7–13
Liou S, Lo S, Wang S (2004) A generalized water quality index for Taiwan. Environ Monit Assess 96:35–52
Lumb A, Sharma TC, Bibeault JF (2011) A review of genesis and evo-lution of water quality index (WQI) and some future directions. Water Qual Exposure Health 3:11–24
Massoud M (2012) Assessment of water quality along a recreational section of the Damour River in Lebanon using the water quality index. Environ Monit Assess 184:4151–4160
Mohamed MEB, Eman AM, Gehad GM, Mohamed MY (2011) Water quality of Rosetta branch in Nile delta, Egypt. Suoseura Finnish Peatland Soc 62(1):31–37
Nemati S, Naghipour L (2014) Artificial neural network modeling of total dissolved solid in the Simineh river, Iran. J Civ Eng Urban 4(1):8–13
Ouyang T, Zhu Z, Kuang Y (2006) Assessıng impact of urbanization on river water quality in the pearl river delta economic zone, Chına. Environ Monit Assess 120:313–325
Pal M, Nihar RS, Pankaj KR, Roy MB (2015) Electrical conductiv-ity of lake water as environmental monitoring—a case study of Rudrasagar Lake. J Environ Sci Toxicol Food Technol 9(3):66–71 Rosemond S, Duro D, Dubé M (2008) Comparative analysis of regional
water quality in Canada using theWater Quality Index. Environ Monit Assess 2009(156):223–240
Sahoo MM, Patra K, Khatua K (2015) Inference of water quality index using ANFIA and PCA. Aquat Procedia 4:1099–1106
Said A, Stevens D, Selke G (2004) An innovative index for evaluating water quality in streams. Environ Manage 34:406–414
Samantray P, Mishra BK, Panda CR, Rount SP (2009) Assessment of water quality index in Mahanadi and Atharabanki Rivers and Taldanda Canal in Paradip area. India J Hum Ecol 26(3):153–161 Sebastian J, Yamakanamardi SM (2013) Assessment of water quality
index of Cauvery and Kapila Rivers and at their confluence. Int J Lakes Rivers 6(1):59–67
Şener Ş, Şener E, Davraz A (2017) Evaluation of water quality using water quality index (WQI) method and GIS in Aksu River (SW-Turkey). Sci Total Environ 584–585:131–144
Seth R, Mohan M, Sıngh P, Sıngh R, Dobhal R, Sıngh KP, Gupta S (2014) Water quality evaluation of Himalayan Rivers of Kumaun region, Uttarakhand. India Appl Water Sci 6(2):137–147
Sharma D, Kansal A (2011) Water quality analysis of River Yamuna using water quality index in the national capital territory India (2000–2009). Appl Water Sci 1:147–157
Sharma S, Dixit S, Jain P, Shah KW, Vishwakarma R (2008) Statistical evaluation of hydrobiological parameters of Narmada River water at Hoshangabad City, India. Environ Monit Assess 143:195–202 Siddiqi SZ (2007) Limnological profile of high impact metero Crater
lake Lonar, Buldana, Maharashtra, India, an Extreme Hyper alka-line, Saline Habitat. In: Proceeding of Teac: The 12th World Lake Conference, pp 1597–1613
Simeonov V, Einax J, Stanimirova I, Kraft J (2002) Environmetric modeling and interpretation of river water monitoring data. Anal Bioanal Chem 374:898–905
SIS (2010) (State Institute of Statistics) Municipal Sewerage Question-naire 2003, State Institute of Statistics, Republic of Turkey, Prime Ministry, Ankara
Sutadian AD, Muttil N, Yilmaz AG, Perera BJC (2016) Development of river water quality indices-a review. Environ Monit Assess 188:58–90
Suthar S, Sharma J, Chabukdhara M, Nema AK (2009) Water quality assessment of river Hindon at Ghaziabad, India: impact of indus-trial and urban wastewater. Environ Monit Assess 165:103–112 Tokatli C (2019) Water and sediment quality assessment of the
life-blood of Thrace Regıon (Turkey): Merıc Rıver basin. Fresenius Environ Bull 28(5):4131–4140
Tripaty JK, Sahu KC (2005) Seasonal hydrochemistry of groundwater in the Barrier Spit system of the Chilika Lagoon, India. J Environ Hydrol 13:1–9
Tyagi S, Sharma B, Singh P, Dobhal R (2013) Water quality assessment in terms of water quality index. Am J Water Resour 1(3):34–38 Usharanı K, Umaranı K, Ayyasamy PM, Shanthı K,
Lakshmanaperu-malsamy P (2010) Physico-chemical and bacteriological charac-teristics of Noyyal River and ground water quality of Perur, India. J Appl Sci Environ Manage 14(2):29–35
VishnuRadhan R, Zainudin Z, Sreekanth GB, Dhiman R, Noor Salleh M, Vethamony P (2017) Temporal water quality response in an urban river: a case study in peninsular Malaysia. App Water Sci 7(2):923–933
Wats RK, Grover AS, Kumar R, Wats M (2019) Status of surface water quality in river Markanda and its correlation with ground water quality and health of the residents of Shahabad, Kurukshetra, Har-yana, India—a case study. Int J Health Econ Develop 5(1):1–11 Witek Z, Jarosiewicz A (2009) Long-term changes in nutrient status of
river water. Pol J Environ Stud 18:1177–1184
Wu Z, Wang X, Chen Y, Cai Y, Deng J (2018) Assessing river water quality using water quality index in Lake Taihu Basin, China. Sci Total Env 612:914–922
Xiao-long W, Yong-long L, Jing-yi H, Gui-zhen HE, Tie-yu W (2007) Identification of anthropogenic influences on water quality of riv-ers in Taihu watriv-ershed. J Environ Sci 19:475–481
Yadav KK, Gupta N, Kumar V, Sharma S, Arya S (2015) Water qual-ity assessment of Pahuj River using water qualqual-ity index at Unnao Balaji, MP, India. Int J Sci Basic Appl Res 19(1):241–250 Yehia H, Sabae S (2011) Microbial pollution of water in El-salam canal
Egypt. Am Eur J Agr Env Sci 11:305–309
Yilmaz E, Koç C (2016a) A study about effects of river water quality on fish living in Büyük Menderes Basin, Turkey. J Water Resour Protect 8(12):1175–1190
Yilmaz E, Koç C (2016b) Organic pollution of the Büyük Menderes River, Turkey and effects on aquaculture. Environ Sci Pollut Res 23:11493–11506
Publisher’s Note Springer Nature remains neutral with regard to jurisdictional claims in published maps and institutional affiliations.