Article Type:
Research Paper
Original Title of Article:
The effect of the correction of self-assessment-based chance success on psychometric characteristics of
the test
Turkish Title of Article:
Öz değerlendirmeye dayalı şans başarısı düzeltmenin testin psikometrik özelliklerine etkisi
Author(s):
Didem ÖZDOĞAN, Nuri DOĞAN
For Cite in:
Özdoğan, D. & Doğan, N. (2018). The effect of the correction of self-assessment-based chance success on
psychometric characteristics of the test. Pegem Eğitim ve Öğretim Dergisi, 8(3), 567-598,
http://dx.doi.org/10.14527/pegegog.2018.022
Makale Türü:
Özgün Makale
Orijinal Makale Başlığı:
The effect of the correction of self-assessment-based chance success on psychometric characteristics of
the test
Makalenin Türkçe Başlığı:
Öz değerlendirmeye dayalı şans başarısı düzeltmenin testin psikometrik özelliklerine etkisi
Yazar(lar):
Didem ÖZDOĞAN, Nuri DOĞAN
Kaynak Gösterimi İçin:
Özdoğan, D. & Doğan, N. (2018). The effect of the correction of self-assessment-based chance success on
psychometric characteristics of the test. Pegem Eğitim ve Öğretim Dergisi, 8(3), 567-598,
http://dx.doi.org/10.14527/pegegog.2018.022
The Effect of the Correction of Self-Assessment-Based Chance Success on
Psychometric Characteristics of The Test
Didem ÖZDOĞAN
*a, Nuri DOĞAN
**ba
İstanbul Kültür University, Education Faculty, İstanbul/Turkey b
Hacettepe University, Education Faculty, Ankara/Turkey
Article Info Abstract
DOI: 10.14527/pegegog.2018.022 This study examines the effect of self-assessment-based chance success on
psychometric characteristics of the test. First, the data was cleared of chance success by means of correction-for-guessing formula and self-assessment, and then statistical analyses were conducted. Item discriminations showed an increase when the correction-for-guessing formula was used; and when self-assessment was used, they showed variability. Test validity increased when correction formula was used; and when self-assessment was used, a slight decrease was observed. Besides, this study examined the effect of correction for chance success upon corrected self-assessment based on IRT guessing parameter. It was observed that the data that were not corrected in accordance with chance scores had higher guessing parameters than those corrected in accordance with self-assessment. In addition, it was evident that the difference between the guessing parameters of the uncorrected data and the data cleared of chance scores by means of self-assessment was significant. It was also revealed that the correction of self-assessment-based chance success have an advantage over classical correction for guessing formula on psychometric characteristics of the test.
Article History: Received Revised Accepted Online 05 June 2017 01 December 2017 09 February 2018 29 April 2018 Keywords: Chance success, Correction-for-guessing formula, Self-assessment, Estimation parameter. Article Type: Research paper
Öz Değerlendirmeye Dayalı Şans Başarısı Düzeltmenin Testin Psikometrik
Özelliklerine Etkisi
Makale Bilgisi Öz
DOI: 10.14527/pegegog.2018.022 Bu çalışmada öz değerlendirmeye dayalı şans başarısı düzeltmenin testin psikometrik
özelliklerine etkisi incelenmiştir. Veriler öncelikle, düzeltme formülü ve öz değerlendirmeden yararlanarak şans başarısından arındırılmış ve bazı istatistikler incelenmiştir. Madde ayırıcılık gücü indeksleri şans başarısından arıtmada düzeltme formülü kullanıldığında artış göstermiş, öz değerlendirmeden yararlanıldığında ise değişkenlik göstermiştir. Testin geçerliği şans başarısından arıtmada düzeltme formülü kullanıldığında artış göstermiş, öz değerlendirmeden yararlanıldığında ise düşmüştür. Çalışmada ayrıca öz değerlendirmeye dayalı şans başarısı düzeltmenin MTK’ya dayalı tahmin parametresine etkisi incelenmiştir. Hem Türkçe hem Matematik testleri için şans başarısına göre düzeltilmeyen verilerin, öz değerlendirmeye göre düzeltilen verilerden daha yüksek tahmin parametrelerine sahip olduğu gözlenmiştir. Ayrıca düzeltme yapılmayan verilere ait tahmin parametreleri ile öz değerlendirmeye dayalı olarak şans başarısından arıtılan verilere ait tahmin parametreleri arasındaki farkın anlamlı olduğu sonucuna ulaşılmıştır. Çalışmada öz değerlendirmeye göre şans başarısı düzeltmenin, geleneksel yönteme göre testin bazı psikometrik özellikleri üzerinde daha avantajlı olduğu gözlenmiştir.
Makale Geçmişi: Geliş Düzeltme Kabul Çevrimiçi 05 Haziran 2017 01 Aralık 2017 09 Şubat 2018 29 Nisan 2018 Anahtar Kelimeler: Şans başarısı, Düzeltme formülü, Öz değerlendirme, Tahmin parametresi. Makale Türü: Özgün makale
*
Author: [email protected] Orcid ID: https://orcid.org/0000-0002-6631-3996
**
Author: [email protected] Orcid ID: https://orcid.org/0000-0001-6274-2016
Pegem Eğitim ve Öğretim Dergisi, 8(3), 2018, 567-598
www.pegegog.net
Introduction
Multiple choice tests, an assessment instrument used in assessment and evaluation activities pursued in education, are among the most frequently used tools. It can be said that multiple choice tests are one of the most objective techniques utilized in the assessment of the variables such as knowledge, skill and success (Ben-Simon, Budescu, & Nevo, 1997). Apart from being objective, the followings can be seen as the reasons why multiple choice tests are preferred: their ease of applying and scoring, their effectivity in the assessment at most levels of learning in relation to cognitive and affective field, providing reliable and valid results, the possibility of application to a large number of students at one and at the same time, the possibility of the prediction of item and test characteristics, being able to cover a wide range of contents, and applicability in a bevy of students (Kurz, 1999; Turgut, 1971). Besides these advantages of multiple choice tests, they have some adverse effects as well. One of those effects is chance success, which means the correct answer is given among choices by chance (Atılgan, Kan, & Doğan, 2009). The chance score that the examinee who answers the relevant item correctly by resorting to prediction vis-à-vis a multiple choice item test gets from that particular question causes errors on some test and item statistics.
There have been many studies trying to find strategies to reduce the incidence of finding the correct answer in multiple choice tests by means of guessing. Among such strategies used to prevent the examinee from guessing the correct answer on items that he/she does not have knowledge on, changing the test instruction and conduct; making some alterations in methods of scoring test items; subtracting the incorrect answers from the correct answers; giving additional points to unanswered questions; giving weight to item options in accordance with their correctness levels; changing the item structure; and using the correction-for guessing formula (Budescu & Bar-Hillel, 1993; Mehrens & Lehmann, 1984) are commonly used. It has been accepted that the method of using correction-for-guessing formula increases the validity and reliability of the scores because it expects the corrected scores in terms of psychometric characteristics to be higher than uncorrected scores in predicting the particular characteristic of the individual (Çelen, 2002).
As can be inferred, due to the structure of multiple choice tests, it can be stated that multiple choice tests contain chance error resulting from chance success, that this chance error causes some errors in test and item statistics and affects the validity and reliability of the test adversely. To amend the adverse effect caused by this type of error that the multiple choice tests hold or at least to reduce it is of importance in achieving more valid and reliable results. One of the methods developed for that purpose is to use correction-for-guessing formulas based on incidence, while another is to use correction predicated upon self-assessment. In this study, in order to reduce the effect of chance error on test and item statistics, correction-for-guessing formula predicated upon both approaches was used and its functionality is discussed.
In the approach based on incidence, points are subtracted from the number of correct answers in proportion to the number of choices of the incorrect answers. In the correction-for-guessing formula based on incidence, it is assumed that the student answers a part of questions by sheer guessing and from each question he/she will gain scores in proportion to (1/the number of choices). One of the most defective aspects of this approach is the assumption that chance success plays a part on every question. Other defects are, when it is applied, it bears the meaning that the students are to be penalized because of their incorrect answers and that it makes corrections more than adequate (Baykul, 2010; Turgut, 1971).
Self-assessment is pointed out as an approach in which students make judgments on their own learning (Boud & Falchikov, 1989) or assess themselves in line with the criteria established by the teacher or those that are chosen by the student from those criteria (Dochy & McDowell, 1997). In other words, self-assessment is the assessment of the individual in terms of a particular topic, behavior or process (Doğan, Çetin, & Gelbal, 2007). It is stated that self-assessment equips students with the skill to determine their own efficiencies and deficiencies in the state of high awareness (Byram, 1997). It is
speculated that when students indicate their state of sureness or unsureness in their answers while answering the multiple choice test, self-assessment will assist them in correcting the chance success mixed in the test scores of the students. In addition, the effect of self-assessment method on the estimation parameter based on IRT (Item Response Theory) can be determined. This condition can be interpreted as one of the advantages of self-assessment on correction-for-guessing formula.
It can be stated that self-assessment can inform us about whether the questions answered correctly by students or their level of certainty about their knowledge. To obtain this information, students can be asked whether they are sure of their answers. Thus, it can be inferred that they answer the questions correctly through imperfect knowledge or by chance – sheer guessing – even though they explicitly state that they are unsure of the correctness of their answers. By acknowledging that answering the questions incorrectly through information gathered in that way, corrections could be made in chance success. Thus, extreme correction anxiety in correction-for-guessing formula and the conduct of penalizing the students due to their incorrect answers can be decreased to a certain extent. The distinctive notion grounded on the study is that based on self-assessment results vis-à-vis the chance success can be corrected more expediently. In the light of these ideas the question of the study is;
How is the effect of the correction of self-assessment-based chance success on psychometric characteristics of the test?
Study Objective
The objective of the study is to find out whether the correction for chance success predicated upon self-assessment is more expedient and effective than the classical approach. The study was conducted via multiple choice questions with five choices in order to observe the effect of the approaches of the correction for chance success on the fields of analytical thinking and problem-solving. The study consists of two parts. On the first part, the effect of using classical correction-for-guessing formula and the correction for chance success predicated upon self-assessment on test and item statistics for both Turkish and math tests are analyzed. The results obtained by means of classical correction-for-guessing formula and the results of the correction for chance success predicated on self-assessment are compared in terms of test and item statistics. On the second part, the objective is to ascertain the effect of the correction for chance success predicated upon self-assessment on the guessing (chance) parameter on the scores of those who have taken the Turkish and math test.
Method
This chapter surveys the research model, the working group, the data collecting tools, collecting the data and the analysis of the data.
Research Design
In this research, scoring was redesigned in accordance with the result of the students’ self-assessments that indicate whether they are sure of the answers when they answer the test items. With regard to the new scores, some tests and item statistics were viewed and the results were compared to each other by classical correction formula on these same statistics. Moreover, the guessing parameters were compared to each other according to the data that was purified from chance success by self-assessment and the data that was not purified from chance success.
Basic research that yearn for adding up new information to the existing data are the simplest representation attempts of a research as a notion. “Knowledge is for knowledge’s sake” perception dominates basic research (Karasar, 2012). Since this research is thought to add up to the field of measurement and evaluation in theory, it can possibly be categorized as basic research.
Applied research, on the other hand, are practices already produced or being produced. Generally, applied research should follow basic research; yet there are circumstances in which applied research
come before basic research or both conducted simultaneously. Generally, problems with applied functions are enlightened by activities of basic research, and then it is solved by applied research. For this reason, applied research is essential for problem solving (Karasar, 2012). Since this research also has an applied function, it can be suggested that it is both basic and applied research.
Study Group
Turkish and math tests prepared exclusively for this study were applied to 1020 students who received education in the 10th grade of 2011-2012 academic year in 11 different secondary schools in central town of the city Kahramanmaraş. However, because the scores of some students could not be attained, some students did not answer on some questions, some data loss was encountered. Consequently, the data obtained from 865 students were analyzed. The demographic information is given in Table 1.
Table 1.
Demographic Information for Study Group.
Gender N % Type of School N %
Women 393 45.40 State School 714 82.50
Men 472 54.60 Private School 151 17.50
Total 865 100.00 Total 865 100.00
Data Collection Tools
The tests used in the study to collect data are “Ninth Grade Turkish Test” and “Ninth Grade Mathematics Test”. In order to prepare these tests, a number of publishing houses with high rates in the market and a commercial reputation were consulted and the questions of these publishing houses were used. It was also preferable to use questions written by experienced authors to speed up the implementation process.
Each of the achievement tests consists of 20 questions and items with five choices. For both tests, a trial application was executed with 107 students in the 2011-2012 academic year. As a result of this trial, it was determined that the item and test psychometric characteristics were at a desirable level (KR-20=.78 for Turkish test and KR-20=.84 for math test). After this step, the main application was initiated.
To provide the individuals with their own self-assessments, following the choices of each item in Turkish and math test (separately from the choices) option boxes which state “sure” and “not sure” were placed. Students were asked to tick one of the boxes with regard to whether they were sure of their answer or not right after they answered each item. These responses of the students were accepted as self-assessment in that they assessed whether they were sure or not while answering the items.
Data Collection
Necessary permissions were collected from Kahramanmaraş Provincial Directorate for National Education before the success tests were applied. Then the principals of the chosen schools are visited and the dates of the classes were arranged. The teachers were also visited beforehand as well, and they were informed about the form of the test. The class teachers held applications in a one-hour class on the given dates. With the beginning of the second semester in 2011-2012, applications were completed in 11 secondary schools within 2 months. Moreover, Turkish and Mathematics final grades of the students for 2010-2011 previous academic year were obtained from the registrar for the research purposes.
The scope of this study is more concerned with the structure of multiple-choice questions (as the multiple-choice tests have a chance factor). For this reason, it is not important for the data to be up-to-date since it is expected that the effect of the variables such as the origin of the sample or the scope of the measured characteristic are negligible.
Data Analysis
In the first part of the study, three steps were followed in the data analysis.
At the first stage, before starting to work on the data of 865 students, item difficulty index, item discrimination index, KR-20 reliability coefficient of the test, tests’ validity of conformity and the average difficulty of the tests were calculated. For the tests’ validity of conformity, the correlation between the scores of Turkish and Math test and the year-end passing marks of Turkish and mathematics courses of the students were determined.
At the second stage, using classical correction approaches, test and item statistics were calculated and cleared of chance success. At the third stage, the correction procedure of chance success predicated upon self-assessment was carried out in accordance with the response students gave to the statements of “I’m sure” and “I’m not sure” under the choices of each item in the test. It was accepted that the student who answered this item correctly though marking the statement “I’m not sure” did so by chance and for that item the score “1” was replaced by “0”. For the significance of the difference between test and item statistics calculated with regard to different approaches, Z-test for the difference of two ratios in the comparison of item difficulty indexes and the average values of difficulty, Fisher’s Z transform for the difference between two correlations in the comparison of the item discrimination indexes and the values of the validity of conformity were used. The difference between two ratios and the difference between two correlations were determined via Statistica 7 program. When the degrees of freedom and averages, and the difference between the correlations were put in the Statistica 7 program, whether these differences were significant was determined and this value was found .06. If the difference values were greater than or equal to .06 then they were significant; otherwise, not significant. The difference of all ratios and correlations were interpreted through this value as criterion.
In the second part of the study, for the Turkish and math tests, the estimate parameters of the data that were primarily graded as 1-0 in view of the answer key were predicted. Afterwards, the estimate parameters were once again predicted in the light of the data that were corrected in accordance with self-assessment. The correlation between the estimate parameters that were predicted through corrected and uncorrected data were calculated by means of Spearman Brown rank correlation, as the data did not corresponded to the normality assumption. The significance of the difference between the parameters was tested by means of Wilcoxon signed ranks test (Baykul, 1999; Heiman, 1996; Siegel & Castellan, 1988; cited in: Büyüköztürk, 2010)
Results
For the grades of Turkish test, the item difficulty values and the differences between the item difficulty values that were attained by means of correction-for-guessing formula and self-assessment approach are given in Table 2.
From Table 2, it can observe that the item difficulty index range of raw scores is .20-.95; the item difficulty range of the items that were cleared of chance success by means of correction-for-guessing formula is .00-.87 and the item difficulty index range of the items that were cleared of chance success by means of self-assessment is .11-.92. When the item difficulty indexes of Turkish test items were cleared of chance success, a slight decrease was observed in the item difficulty indexes. The decline in the item difficulty indexes was much more when self-assessment was used on the items 1, 2, 3, 4, 5, 6, 7, 8, 9, 12, 14 and 16; when the correction-for-guessing formula was used on the items 11, 13, 18, 19 and 20. On the 10th and 15th questions, the decline in the item difficulty index had the same value for both methods. When Table 2 is examined, it can be asserted that self-assessment made more correction for simple and moderately difficult items whereas the correction-for-guessing formula for more difficult items. In addition, it can be inferred that the clearing of chance success decreased the item difficulty indexes substantially while chance success made the item easier.
Table 2.
Item Difficulty Values and the Differences between them Attained by means of Correction-for-Guessing Formula and Self-Assessment Approach for Turkish Test.
Items
Raw Scores
Correction for
Guessing Formula Self-Assessment
pr pc ps |pr-pc| |pr-ps| |pc-ps| 1 .90 .87 .83 .03 .07* .04 2 .78 .73 .71 .05 .07* .02 3 .79 .73 .69 .06* .10* .04 4 .68 .60 .57 .08* .11* .03 5 .84 .79 .77 .05 .07* .02 6 .84 .80 .77 .04 .07* .03 7 .61 .51 .43 .10* .18* .08* 8 .95 .94 .92 .01 .03 .02 9 .89 .86 .83 .03 .06* .03 10 .75 .69 .69 .06* .06* .00 11 .73 .66 .67 .07* .06* .01 12 .78 .72 .66 .06* .12* .06* 13 .27 .09 .17 .18* .10* .08* 14 .85 .81 .74 .04 .11* .07* 15 .72 .65 .65 .07* .07* .00 16 .82 .78 .70 .04 .12* .08* 17 .64 .55 .60 .09* .04 .05 18 .41 .26 .33 .15* .08* .07* 19 .20 .00 .11 .20* .09* .11* 20 .56 .45 .49 .11* .07* .04 p̅ .70 .62 .62 .08* .08* .00
p̅ : Mean difficulty of the test
|pr-pc|: The difference of item difficulty indexes obtained by means of raw scores and correction-for-guessing formula
|pr-ps|: The difference of item difficulty indexes obtained by means of raw scores and self-assessment
|pc-ps|: The difference of item difficulty indexes obtained by means of correction-for-guessing formula and self-assessment
When the significance of the differences between the item difficulty indexes obtained through the correction approaches are considered, it was observed that the items 3, 4, 7, 10, 11, 12, 13, 15, 17, 18, 19 and 20 for |pr-pc|; the items 1, 2, 3, 4, 5, 6, 7, 9, 10, 11, 12, 13, 14, 15, 16, 18, 19 and 20 for |pr-ps|;
the items 7, 12, 13, 14, 16, 18 and 19 for |pc-ps| were statistically significant at .01 significance level of
the differences between the item difficulties. For the items 7, 12, 13, 18 and 19, all of the three differences |pr-pc|, |pr-ps| and |pc-ps| were significant and for the item 8 none of the difference values
was significant.
When the test was cleared of chance success, the mean difficulty of the test decreased slightly. When the correction-for-guessing formula and self-assessment was used in the clearing of chance success, the same decrease was observed in the mean difficulty of the test as there is, for the students, a possibility of finding the correct answer by choosing randomly in the tests under the influence of chance success.
When the significance of the differences between the mean difficulty values calculated as a result of correction for chance success using the correction-for-guessing formula and self-assessment on raw scores is examined, it is observable that the differences of |𝑝̅r-𝑝̅c| and |𝑝̅r-𝑝̅s| were statistically
significant at .01 significance level and the difference of |𝑝̅c-𝑝̅s| was not statistically significant at .01
The findings, related to the effect of the correction of chance success by means of the correction-for-guessing formula and self-assessment to the item discrimination index on the Turkish test scores are given in Table 3.
Table 3.
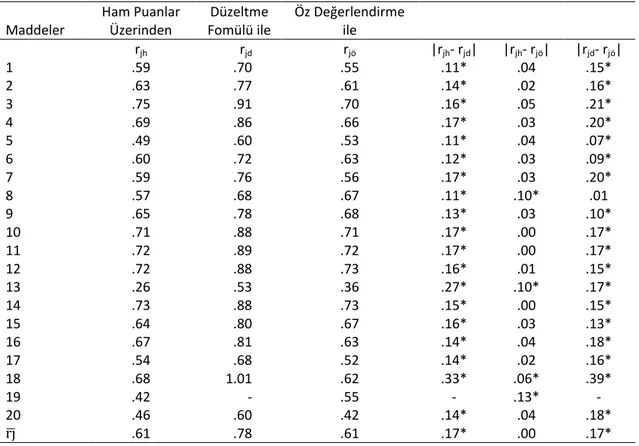
The Effect of the Correction of Chance Success by means of Correction-for-Guessing Formula and Self-Assessment to the Item Discrimination Index for Turkish Test.
Items Raw Scores Correction-for-Guessing Formula Self-Assessment rjr rjc rjs |rjr- rjc| |rjr- rjs| |rjc- rjs| 1 .59 .70 .55 .11* .04 .15* 2 .63 .77 .61 .14* .02 .16* 3 .75 .91 .70 .16* .05 .21* 4 .69 .86 .66 .17* .03 .20* 5 .49 .60 .53 .11* .04 .07* 6 .60 .72 .63 .12* .03 .09* 7 .59 .76 .56 .17* .03 .20* 8 .57 .68 .67 .11* .10* .01 9 .65 .78 .68 .13* .03 .10* 10 .71 .88 .71 .17* .00 .17* 11 .72 .89 .72 .17* .00 .17* 12 .72 .88 .73 .16* .01 .15* 13 .26 .53 .36 .27* .10* .17* 14 .73 .88 .73 .15* .00 .15* 15 .64 .80 .67 .16* .03 .13* 16 .67 .81 .63 .14* .04 .18* 17 .54 .68 .52 .14* .02 .16* 18 .68 1.01 .62 .33* .06* .39* 19 .42 - .55 - .13* - 20 .46 .60 .42 .14* .04 .18* rj̅ .61 .78 .61 .17* .00 .17*
rj̅ : Mean Item Discrimination
|rjr- rjc|: The difference of item discrimination indexes obtained by means of raw scores and correction-for-guessing formula
|rjr- rjs|: The difference of item discrimination indexes obtained by means of raw scores and self-assessment
|rjc- rjs|: The difference of item discrimination indexes obtained by means of correction-for-guessing formula and self- assessment
In the calculation of the item discrimination indexes shown in Table 3 bi-serial coefficient of correlation was used. When Table 3 is examined, it can be observed that the range of item discrimination indexes of the raw scores is .26-.75; the range of item discrimination indexes of the items cleared of chance success by means of correction-for-guessing formula is .53-1.01; the range of item discrimination indexes of the items cleared of chance success by means of self-assessment is .36-.73. When the correction-for-guessing formula was used for the clearing of chance success, a slight increase was observed in the item discrimination indexes of all the items except for the item 19 in the Turkish test. Since the item difficulty index of the 19th item had a negative value when it was cleared of chance success by means of correction-for-guessing formula, the item discrimination could not be calculated. It can be stated that chance success affects the item discrimination indexes negatively and items could identify those who have knowledge and who don’t have when they were cleared of chance success. It is observed that when self-assessment was used in the clearing of chance success, the item discrimination indexes increased for some items, decreased for some items, and did not change for some items. The item discrimination index of the item 18 calculated by means of raw scores, when cleared of chance success by means of correction for guessing formula had a value over 1.00. When self-assessment was used in the clearing of chance success, the item discrimination index of no item exceeded the limit value.
When the significance of the differences between the item discrimination indexes calculated as a result of the correction for chance success using the correction-for-guessing formula and self-assessment is examined, it is observed that the difference between the item discrimination indexes of all the items except for the item 19 was significant for the |rjr- rjc| difference. Also it can be observed
that the difference between the item discrimination indexes of the items 8, 13, 18 and 19 was significant for the |rjr- rjs| difference and the differences between all the items except for the items 8 and 19 were
significant for |rjc- rjs|.
The mean item discrimination calculated by means of raw scores increased slightly when cleared of chance success by means of correction-for-guessing formula. This increase is statistically significant at .01 significance level. The mean item discrimination calculated for raw scores did not changed when cleared of chance success by means of self-assessment. The mean item discrimination difference cleared of chance success using correction-for-guessing formula and self-assessment is statistically significant at .01 significance level.
For the grades of Turkish test, the findings, related to the effect of the correction of chance success using the correction-for-guessing formula and self-assessment to the validity and reliability of the test are given in Table 4.
Table 4.
The Effect of the Correction of Chance Success Using the Correction-for-Guessing Formula and Self-Assessment on Turkish Test Scores to the Validity and Reliability of the Test.
Raw Scores
Correction-for-Guessing Formula Self-Assessment
rxr rxc rxs |rxr- rxc| |rxr- rxs| |rxc- rxs|
.51 .53 .45 .02 .06* .08*
KR-20 KR-20 KR-20
.76 .85 .80
|rxr- rxc|: The difference of test validities obtained by means of raw scores and correction-for-guessing formula
|rxr- rxs|: The difference of test validities obtained by means of raw scores and self-assessment
|rxc- rxs|: The difference of test validities obtained by means of correction-for-guessing formula and self-assessment
In the calculation of the validity of conformity of the test, the year-end passing grades were set as criterion. As it can be seen in Table 4, an increase was observed in the validity coefficient of conformity in the Turkish test when the correction-for-guessing formula was used in the clearing of chance success. It can be stated that chance success decreases the validity of conformity of the test and when cleared of chance success, the validity of conformity increases. A slight decrease was observed in the validity coefficient of conformity when chance success was corrected by means of self-assessment.
When the significance of the differences between the values of the validity of conformity of the test obtained as a result of the correction for chance success using the correction-for-guessing formula and self-assessment is examined, it is observed that the difference of |rxr- rxc| was not statistically significant
at .01 significance level. In addition, it is observed that the differences of |rxr- rxs| and |rxc- rxs| were
statistically significant at .01 significance level.
Test reliability was calculated by means of KR-20 formula. As it can be seen in Table 4, it is observed that for both using correction-for-guessing formula and self-assessment in the clearing of chance success, the KR-20 reliability coefficient of the test increased. The increase in the KR-20 reliability coefficient was more when correction-for-guessing formula was used in the clearing of chance success compared to self-assessment. It can be stated that chance error mixed into test scores decreases the reliability coefficient of the test and when it is cleared of chance success using correction-for-guessing formula and self-assessment, the reliability coefficient of the test increases.
For math test scores, the findings related to the effect of correction for chance success using correction-for-guessing formula and self-assessment to the item difficulty are given in Table 5.
Table 5.
The Effect of Correction for Chance Success Using Correction-for-Guessing Formula and Self-Assessment to the Item Difficulty for Math Test.
Items Raw Scores
Correction-for-Guessing Formula Self-Assessment
pr pc ps |pr-pc| |pr-ps| |pc-ps| 1 .80 .75 .69 .05 .11* .06* 2 .86 .83 .77 .03 .09* .06* 3 .82 .77 .76 .05 .06* .01 4 .53 .41 .45 .12* .08* .04 5 .80 .76 .71 .04 .09* .05 6 .61 .51 .49 .10* .12* .02 7 .82 .77 .75 .05 .07* .02 8 .34 .18 .27 .16* .07* .09* 9 .30 .13 .24 .17* .06* .11* 10 .26 .07 .17 .19* .09* .10* 11 .21 .02 .18 .19* .03 .16* 12 .68 .60 .59 .08* .09* .01 13 .69 .61 .64 .08* .05 .03 14 .61 .51 .48 .10* .13* .03 15 .72 .65 .64 .07* .08* .01 16 .43 .29 .36 .14* .07* .07* 17 .60 .51 .46 .09* .14* .05 18 .38 .23 .22 .15* .16* .01 19 .72 .65 .58 .07* .14* .07* 20 .49 .36 .34 .13* .15* .02 p̅ .58 .48 .49 .10* .09* .01
p̅ : Mean of test difficulty
|pr-pc|: The difference of item difficulty indexes obtained by means of raw scores and correction-for-guessing formula
|pr-ps|: The difference of item discrimination indexes obtained by means of raw scores and self-assessment
|pc-ps|: The difference of item discrimination indexes obtained by means of correction-for-guessing formula and self-assessment
When Table 5 is examined, it can be observed that the range of item difficulty indexes of raw scores is .21-.86; the range of item difficulty indexes of the items cleared of chance success by means of correction-for-guessing formula is .02-.77; the range of item difficulty indexes of the items cleared of chance success by means of self-assessment is .17-.77. When the correction-for-guessing formula was used for the clearing of chance success, a slight increase was observed in the item difficulty index values. Besides, the decrease in the item difficulty indexes was much more when the self-assessment was used on the items 1, 2, 3, 5, 6, 7, 12, 14 and 15; when the correction-for-guessing formula was on the items 4, 8, 9, 10, 11, 13 and 16. When Table 5 is examined, it can be asserted that the self-assessment made more correction for simple and moderately difficult items, and the correction-for-guessing formula for more difficult items. Also, it can be commented that chance success affects the item difficulty indexes negatively whereas chance success makes the item easier.
When the significance of the differences between the item difficulty indexes calculated as a result of correction for chance success using the correction-for-guessing formula and self-assessment was examined for raw scores, it is observed that the difference between the item difficulty indexes of the items 4, 6, 8, 9, 10, 11, 12, 13, 14, 15, 16, 17, 18, 19 and 20 was statistically significant for the |pr – pc|
difference at .01 significance level; the difference between the item difficulty indexes of all items except for the items 11 and 13 was statistically significant for the |pr – ps| difference at .01 significance level;
the differences was statistically significant for the |pc – ps| difference at .01 significance level. It is
observed that each of the three differences of |pr – pc|, |pr – ps| and |pc – ps| in the items 8, 9, 10, 16
correction-for-guessing formula and self-assessment were better at clearing of chance success for difficult and moderately difficult item of the assessment.
The average difficulty of the test decreased slightly when cleared of chance success using correction-for-guessing formula and self-assessment. It is evident that the decrease in the average difficulty of the test was slightly more when correction-for-guessing formula was used in the clearing of chance success compared to self-assessment. It can be asserted that chance success makes the test easier in that there is, for the students, a possibility of finding the correct answer by choosing randomly in the tests that are under the influence of chance success.
When the significance of the differences between the average difficulty values calculated as a result of correction for chance success using the correction-for-guessing formula and self-assessment on raw scores was examined, it is observable that the differences of |𝑝̅r-𝑝̅c| and |𝑝̅r-𝑝̅s| were statistically
significant at .01 significance level and the difference of |𝑝̅c-𝑝̅s| was not statistically significant at .01
significance level.
The findings, related to the effect of correction for chance success by means of the correction-for-guessing formula and self-assessment to the item discrimination index on the math test scores are given in Table 6.
Table 6.
The Effect of Correction for Chance Success by means of the Correction-for-Guessing Formula and Self-Assessment to the Item Discrimination Index for Math Test.
Items Raw Scores
Correction-for-Guessing Formula Self-Assessment
rjr rjc rjs |rjr- rjc| |rjr- rjs| |rjc- rjs| 1 .69 .83 .73 .14* .04 .10* 2 .59 .70 .62 .11* .03 .08* 3 .77 .92 .75 .15* .02 .17* 4 .77 1.02 .81 .25* .04 .21* 5 .73 .88 .80 .15* .07* .08* 6 .55 .70 .63 .15* .08* .07* 7 .74 .89 .74 .15* .00 .15* 8 .07 1.74 .74 .67* .33* 1.00* 9 .57 1.02 .69 .45* .12* .33* 10 .62 1.37 .76 .75* .14* .61* 11 .68 2.92 .73 2.24* .05 2.19* 12 .73 .91 .77 .18* .04 .14* 13 .75 .93 .78 .18* .03 .15* 14 .73 .93 .84 .20* .11* .09* 15 .76 .93 .82 .17* .06* .11* 16 .83 1.18 .87 .35* .04 .31* 17 .65 .83 .76 .18* .11* .07* 18 .23 .35 .46 .12* .23* .11* 19 .70 .85 .71 .15* .01 .14* 20 .62 .84 .71 .22* .09* .13* rj̅ .69 1.04 .74 .35* .05 .30* rj
̅ : Mean of Item Discrimination
|rjr- rjc|: The difference of item discrimination indexes obtained by means of raw scores and correction-for-guessing formula
|rjr- rjs|: The difference of item discrimination indexes obtained by means of raw scores and self-assessment
In the calculation of item discrimination indexes on Table 6, the bi-serial coefficient of correlation was used. When Table 6 is examined, it can be observed that the item discrimination indexes range of raw scores is .23-1.07; the range of item discrimination indexes of the items cleared of chance success by means of correction-for-guessing formula is .35-2.92; the range of item discrimination indexes of the items cleared of chance success by means of self-assessment is .46-.87. When the correction-for-guessing formula was used for the clearing of chance success, a slight increase was observed in the item discrimination indexes of all the items in the math test. This condition can imply that chance success affects the item discrimination indexes negatively and items could sort out those who have knowledge and who do not when cleared of chance success. It is observed that when self-assessment was used in the clearing of chance success, the item discrimination indexes increased for most items decreased for the items 3 and 8, and did not change for the item 7. Besides, it was observed that some items (items 4, 8, 9, 10, 11 and 16) exceeded the boundary values when correction-for-guessing formula was used in the clearing of chance success. Correction-for-guessing formula corrected these items substantially. This condition can be interpreted as a negative aspect of correction-for-guessing formula. When self-assessment was used for the same items and all other items in the clearing of chance success, no such condition was encountered for any item.
When the significance of the differences between the item discrimination indexes calculated as a result of the correction for chance success using the correction-for-guessing formula and self-assessment on raw scores was examined, it was observed that the difference between the item discrimination indexes of all the items was statistically significant for |rjr- rjc|; items 5, 6, 8, 9, 10, 14, 15,
17, 18 and 20 for |rjr- rjs| and all items for |rjc- rjs|.
The average item discrimination calculated by means of raw scores increased a little when cleared of chance success by means of correction-for-guessing formula. This increase was statistically significant at .01 significance level. The average item discrimination calculated through raw scores slightly increased when cleared of chance success by means of self-assessment. However, this increase was not statistically significant at .01 significance level. The difference of average item discrimination cleared of chance success using correction-for-guessing formula and self-assessment was statistically significant at .01 significance level.
For the scores of math test, the findings, related to the effect of the correction of chance success using the correction-for-guessing formula and self-assessment to the validity and reliability of the test are given in Table 7.
Table 7.
The Effect of the Correction of Chance Success Using the Correction for Guessing Formula and Self-Assessment on Math Test Scores to the Validity and Reliability of the Test.
Raw Scores
Correction-for-Guessing Formula Self-Assessment
rxr rxc rxs |rxr- rxc| |rxr- rxs| |rxc- rxs|
.61 .63 .59 .02 .03 .04
KR-20 KR-20 KR-20
.84 .92 .89
|rxr- rxc|: The difference of test validities obtained using raw scores and correction-for-guessing formula
|rxr- rxs|: The difference of test validities obtained using raw scores and self-assessment
|rxc- rxs|: The difference of test validities obtained using correction-for-guessing formula and self-assessment
As it can be seen in Table 7, an increase was observed in the validity coefficient of conformity in the Turkish test when the correction-for-guessing formula was used in the clearing of chance success. It can be stated that chance success affects the validity of conformity of the test negatively and when cleared of chance success, the validity of conformity increases. A slight decrease was observed in the validity coefficient of conformity when chance success was corrected by means of self-assessment.
When the significance of the differences between the values of the validity of conformity of the test obtained as a result of the correction for chance success using the correction-for-guessing formula and self-assessment for raw score was examined, it is observed that the differences of |rxr- rxc|, |rxr- rxs| and
|rxc- rxs| were not statistically significant at .01 significance level.
The reliability of the test was calculated by means of KR-20 formula. As it can be seen in Table 7, when using both correction-for-guessing formula and self-assessment in the clearing of chance success, the KR-20 reliability coefficient of the test increased slightly. The increase in the KR-20 reliability coefficient was more when correction-for-guessing formula was used in the clearing of chance success compared to self-assessment. It can be stated that chance error meddled with test scores decreases the reliability coefficient of the test and when it is cleared of chance success using correction-for-guessing formula and self-assessment, the reliability coefficient of the test increases.
The findings, related to the effect of correction for chance success using self-assessment for Turkish and math test scores, which make up the second part of the study on guessing parameters can be found in Table 8.
Table 8 displays the uncorrected data concerning the Turkish test, the parameter values estimated as a result of the analysis that was carried out on BILOG-MG program and the parameters estimated as a result of the analysis conducted on the data obtained by correction-for-guessing, using self-assessment, the questions answered correctly even though they are not sure.
Table 8.
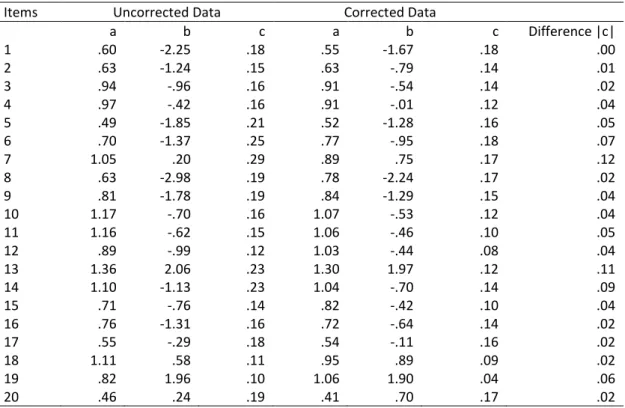
Estimation Parameters Related to Uncorrected and Corrected Data for Turkish Test.
Items Uncorrected Data Corrected Data
a b c a b c Difference |c| 1 .60 -2.25 .18 .55 -1.67 .18 .00 2 .63 -1.24 .15 .63 -.79 .14 .01 3 .94 -.96 .16 .91 -.54 .14 .02 4 .97 -.42 .16 .91 -.01 .12 .04 5 .49 -1.85 .21 .52 -1.28 .16 .05 6 .70 -1.37 .25 .77 -.95 .18 .07 7 1.05 .20 .29 .89 .75 .17 .12 8 .63 -2.98 .19 .78 -2.24 .17 .02 9 .81 -1.78 .19 .84 -1.29 .15 .04 10 1.17 -.70 .16 1.07 -.53 .12 .04 11 1.16 -.62 .15 1.06 -.46 .10 .05 12 .89 -.99 .12 1.03 -.44 .08 .04 13 1.36 2.06 .23 1.30 1.97 .12 .11 14 1.10 -1.13 .23 1.04 -.70 .14 .09 15 .71 -.76 .14 .82 -.42 .10 .04 16 .76 -1.31 .16 .72 -.64 .14 .02 17 .55 -.29 .18 .54 -.11 .16 .02 18 1.11 .58 .11 .95 .89 .09 .02 19 .82 1.96 .10 1.06 1.90 .04 .06 20 .46 .24 .19 .41 .70 .17 .02
When Table 8 is examined, it can be seen that the range of parameter a, interpreted as the discrimination of uncorrected data varies between .46 and 1.36. It can be stated that most of the items have moderate discrimination. The range of parameter b, interpreted as the difficulty of items varies between -2.98 and 2.06. It can be stated that most items have moderate difficulty. When the corrected data were examined, it can be asserted that the range of parameter a varies between .41 and 1.30 and items have, in general, moderate discrimination; the range of parameter b varies between -1.67 and 1.97 and items have, in general, moderate difficulty.
It can be observed that the guessing parameters related to the data corrected using self-assessment were lower than the guessing parameters related to the uncorrected data. This decline was higher for some items. The range of difference between the guessing parameters of corrected and uncorrected data varies between .00 and .12. The highest declines between the guessing parameters of corrected and uncorrected data were observed on the items with high difficulty.
The reliability coefficient attained as a result of the analysis of the uncorrected items was calculated as .78 and the reliability coefficient attained as a result of the analysis of the items corrected using self-assessment was calculated as .81.
The relation between the estimation parameters of corrected and uncorrected items was examined by means of rank-difference correlation. The correlation between the estimation parameters of corrected and uncorrected data was calculated as .76 (p<.01). This indicates that there was a high and significant relevance between the estimation parameters of corrected and uncorrected data.
The significance of the difference between the guessing parameters of uncorrected and corrected data was tested by means of Wilcoxon signed ranks test for relevant measurements. As a result of this test, it is observable that the difference between the guessing parameters of uncorrected data and the parameters obtained by correction using self-assessment was significant (Z=-3.92, p<.05).
Table 9 shows the uncorrected data concerning the Math test, the parameter values estimated as a result of the analysis that was carried out on BILOG-MG program and the parameters estimated as a result of the analysis conducted on the data that were obtained by correction using self-assessment, the questions answered correctly even when not sure.
Table 9.
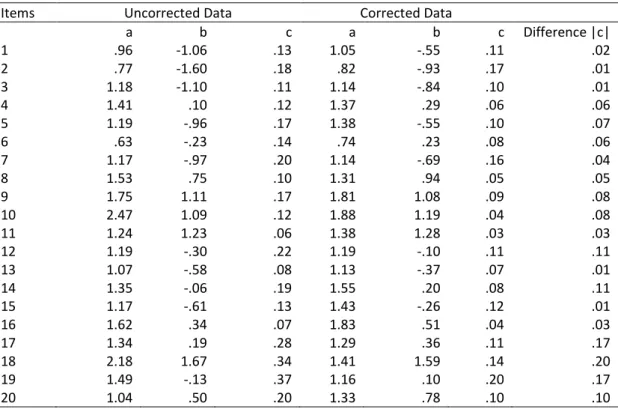
Estimation Parameters Related to Uncorrected and Corrected Data for Math Test.
Items Uncorrected Data Corrected Data
a b c a b c Difference |c| 1 .96 -1.06 .13 1.05 -.55 .11 .02 2 .77 -1.60 .18 .82 -.93 .17 .01 3 1.18 -1.10 .11 1.14 -.84 .10 .01 4 1.41 .10 .12 1.37 .29 .06 .06 5 1.19 -.96 .17 1.38 -.55 .10 .07 6 .63 -.23 .14 .74 .23 .08 .06 7 1.17 -.97 .20 1.14 -.69 .16 .04 8 1.53 .75 .10 1.31 .94 .05 .05 9 1.75 1.11 .17 1.81 1.08 .09 .08 10 2.47 1.09 .12 1.88 1.19 .04 .08 11 1.24 1.23 .06 1.38 1.28 .03 .03 12 1.19 -.30 .22 1.19 -.10 .11 .11 13 1.07 -.58 .08 1.13 -.37 .07 .01 14 1.35 -.06 .19 1.55 .20 .08 .11 15 1.17 -.61 .13 1.43 -.26 .12 .01 16 1.62 .34 .07 1.83 .51 .04 .03 17 1.34 .19 .28 1.29 .36 .11 .17 18 2.18 1.67 .34 1.41 1.59 .14 .20 19 1.49 -.13 .37 1.16 .10 .20 .17 20 1.04 .50 .20 1.33 .78 .10 .10
When Table 9 is examined, it can be seen that the range of parameter a, interpreted as the discrimination of uncorrected data varies between .63 and 2.47. It can be stated that most of the items have moderate discrimination. The range of parameter b, interpreted as the difficulty of items varies between -1.60 and 1.67. It can be stated that most items have moderate difficulty. When the corrected
data are examined, it can be asserted that the range of parameter a varies between .74 and 1.88 and items have, in general, moderate discrimination; the range of parameter b varies between -.93 and 1.59 and items have, in general, moderate difficulty.
It can be observed that the guessing parameters related to the data corrected using self-assessment are lower than the guessing parameters related to the uncorrected data. This decline was greater for some items. The range of difference between the guessing parameters of corrected and uncorrected data varies between .01 and .20. The highest declines between the guessing parameters of corrected and uncorrected data are observed on the items with high difficulty. The reliability coefficient attained as a result of the analysis of the uncorrected items was calculated as .86 and the reliability coefficient attained as a result of the analysis of the items corrected using self-assessment was calculated as .87.
The relation between the guessing parameters of corrected and uncorrected items was examined by means of rank-difference correlation. The correlation between the guessing parameters of corrected and uncorrected data was calculated as .76 (p<.01). There is a high and significant relevance between the guessing parameters of corrected and uncorrected data.
The significance of the difference between the guessing parameters of uncorrected and corrected data was tested by means of Wilcoxon signed ranks test for relevant measurements. As a result of this test, It is observable that the difference between the guessing parameters of uncorrected data and the parameters obtained by means of correction using self-assessment was significant (Z=-3.92, p<.05).
Discussion, Conclusion & Implications
In this study, Turkish and Math scores cleared of chance success using correction-for-guessing formula and self-assessment were examined in terms of some item and test statistics. Besides, the effect of the correction for chance success predicated on self-assessment on the guessing parameters was examined. The research question was; “What is the effect of the correction of self-assessment-based chance success on psychometric characterıstics of the test?”.
The item difficulty indexes calculated for Turkish test items decreased relatively compared to the item difficulty indexes calculated for raw scores when they were cleared of chance success using correction-for-guessing formula and self-assessment. In addition, the values of the item difficulty index of most items decreased more when self-assessment was used in the clearing of chance success. It can be said that self-assessment is more accurate for easy and moderately easy items whereas correction-for-guessing formula is more accurate for relatively harder items. The decline in the item difficulty index values when corrections were made using both correction-for-guessing formula and self-assessment shows that chance success makes the item easier. This finding is in line with the results of the studies conducted by Telli (1993), Şahhüseyinoğlu (1998) and Araz (2001).
The item discrimination indexes of all items calculated for the raw scores of Turkish test increased slightly when cleared of chance success using correction-for-guessing formula. This increase was significant for all items. It can be stated that chance success affects the item discrimination index negatively. This finding concurs with the results found by Araz (2001) and Burton (2001b). It is observed that when self-assessment was used in the clearing of chance success, the item discrimination indexes increased for some items, decreased for some items, and did not change for some items. The difference between the values of the item discrimination index calculated for raw scores and the values of the item discrimination index corrected by means of self-assessment was not significant for most items. Clearing the item discrimination index of chance success by means of correction-for-guessing formula yielded more important results when compared to self-assessment.
The reliability coefficient of Turkish test increased slightly when correction-for-guessing formula and self-assessment were used in the clearing of chance success. It indicates that chance success affects the reliability of the test negatively. The finding that test reliability increased using correction-for-guessing formula is in line with the results reported by Turgut (1971), Araz (2001) and Burton (2001a).
The chance error mixed into Turkish test scores increased slightly when corrected using correction-for-guessing formula. It can be asserted that the chance error mixed into the test scores affects the validity of conformity of the test negatively. This finding shares a similarity with the reported results by Telli (1993), Şahhüseyinoğlu (1998) and Araz (2001). However, this difference was not statistically significant at .01 significance level. The chance error mixed into Turkish test scores decreased slightly when corrected by means of self-assessment. This decline in the value of the validity of conformity of the test was statistically significant at .01 significance level.
When the chance error mixed into Turkish test scores was corrected by means of correction-for-guessing formula and self-assessment, a decline was observed in the average difficulty of the test for both methods. This decline was statistically significant at the .01 significance level. It can be said that chance success makes the test easier. This finding is similar to the study reported by Turgut (1971).
The item difficulty indexes calculated for math test items decreased relatively compared to the item difficulty indexes calculated for raw scores when they were cleared of chance success using correction-for-guessing formula and self-assessment. It was evident that the values of the item difficulty index of most items decreased more when self-assessment was used in the clearing of chance success. It can be said that self-assessment makes more corrections for easy and moderately easy items and correction-for-guessing formula makes more corrections for relatively harder items. The decline in the item difficulty index values when corrections were made using both correction-for-guessing formula and self-assessment shows that chance success makes the item easier. This finding shares a similarity with the results of studies conducted Telli (1993), Şahhüseyinoğlu (1998) and Araz (2001).
The item discrimination indexes of all items calculated for the raw scores of math test increased slightly when cleared of chance success by means of correction-for-guessing formula. This increase was significant for all items. It can be stated that chance error mixed into the test scores affects the item discrimination index negatively, which is in line with the results recorded by Araz (2001) and Burton (2001b). It is observed that when self-assessment was used in the clearing of chance success, the item discrimination indexes increased for most of the items, decreased for an item, and did not change for an item. The difference between the values of the item discrimination index calculated for raw scores and the values of the item discrimination index corrected by means of self-assessment was significant for most items. It was observed that when the correction-for-guessing formula was used in the clearing of chance success, the item discrimination indexes of some items exceeded the boundary values. However, no such condition was observed when self-assessment was used in the clearing of chance success.
The reliability coefficient of Math test increased slightly when correction-for-guessing formula and self-assessment were used in the clearing of chance success. It can be asserted that chance success affects the reliability coefficient negatively. The finding that the reliability coefficient increased using correction-for-guessing formula shares a similarity with the results of Turgut (1971), Şahhüseyinoğlu (1998), Araz (2001) and Burton (2001a) studies.
The chance error mixed into math test scores increased slightly when corrected using correction-for-guessing formula. It can be asserted that the chance error mixed into the test scores affects the validity of conformity of the test negatively. The results reported by Telli (1993), Şahhüseyinoğlu (1998) and Araz (2001) indicate similar findings. However, this difference between was not statistically significant at .01 significance level. The chance error mixed into Turkish test scores decreased slightly when corrected using self-assessment. This decline in the value of the validity of conformity of the test was statistically significant at the .01 significance level.
When the chance error mixed into math test scores was corrected using correction-for-guessing formula and self-assessment, a decline was observed in the average difficulty of the test for both methods and this decline was statistically significant at the .01 significance level. It can be said that chance success makes the test easier, which is in line with the results postulated by Turgut (1971).
It was observed that the guessing parameters of the uncorrected data for both Turkish and Mathematics tests were higher than the guessing parameters of the data obtained by means of correction predicated on self-assessment, i.e. it can be asserted that the data not corrected for chance success had higher estimation parameters.
As a result of the analysis of the uncorrected data on both Turkish and mathematics tests, the reliability coefficient of the test was found lower than the reliability coefficient of the data corrected by means of self-assessment.
It is observed that for both Turkish and mathematics tests, the correlation between the uncorrected data and the data corrected by means of self-assessment was high and significant. Besides, it was found that the difference between the guessing parameters of the uncorrected data and the guessing parameters of the data cleared of chance success using self-assessment was significant.
As a result of this study, it is safe to assert that the self-assessment can be used as a method in the clearing of chance success. In addition to the correction formula, other methods for chance success could also be used. Test scores clearing chance success can be compared by using different methods. A similar research can be conducted by providing students gain experience about self-assessment (such as short-term trainings). A similar research can be tested for different class-levels and courses. And further research can be conducted by different methods of evaluation such as peer assessment and peer-group assessment in addition to self-assessment.
Türkçe Sürüm
Giriş
Eğitimde sürdürülen ölçme ve değerlendirme faaliyetlerinde kullanılan ölçme araçlarından çoktan seçmeli testler günümüzde en sık kullanılanlar arasındadır. Çoktan seçmeli testler bilgi, yetenek ve başarı gibi değişkenlerin ölçülmesinde kullanılan en objektif tekniklerden biridir denilebilir (Ben-Simon et al., 1997). Objektif olmalarının yanı sıra uygulama ve puanlama kolaylıkları, bilişsel ve duyuşsal alana ilişkin olarak öğrenmenin çoğu düzeyinde ölçmeyi gerçekleştirebilmeleri, güvenilir ve geçerli sonuçlar vermeleri, çok sayıda öğrenciye aynı anda uygulanabilmeleri, madde ve test özelliklerinin kestiriminin mümkün olması, geniş bir içeriği kapsayabilmesi, kalabalık gruplarda uygulanabilmesi vb. seçmeli testlerin tercih edilmesinin nedenleri olarak görülebilir (Kurz, 1999; Turgut, 1971). Çoktan seçmeli testlerin bu üstünlüklerinin yanında bazı zayıf yönleri de vardır. Bunlardan biri de doğru cevabın şansla verilmesi anlamına gelen şans başarısıdır (Atılgan et al., 2009). Seçmeli bir test maddesi karşısında tahmin yoluna giderek ilgili maddeyi doğru cevaplayan bir cevaplayıcının o sorudan elde ettiği şans puanı, bazı test ve madde istatistikleri üzerinde hatalara neden olmaktadır.
Seçmeli testlerde tahmin davranışlarıyla doğru cevabı bulma olasılığını azaltmak için birçok çalışma yapılmıştır. Test yönergesini ve uygulamayı değiştirerek cevaplayıcının bilmediği maddelerde tahmine gitmesini önlemek, test maddelerini puanlama metotlarında bazı değişikliklere gitmek, doğru işaretlenmiş cevaplardan yanlışların bir kısmını çıkarmak, cevapsız bırakılmış maddelere fazladan puan vermek, madde şıklarına doğruluk derecelerine göre ağırlık vermek, madde yapısını değiştirmek, düzeltme formülü kullanmak gibi metotlar bu tür çalışmalardandır (Budescu & Bar-Hillel, 1993; Mehrens & Lehmann, 1984). Düzeltme formülü uygulanması yönteminin, puanların geçerliğini ve güvenirliğini yükselttiği kabul edilmektedir, çünkü bireyin ilgilenilen özelliğini tahmin etmede, psikometrik özellikler bakımından düzeltilmiş puanların düzeltilmemiş puanlara göre daha üstün olması beklenmektedir (Çelen, 2002).
Yukarıdaki açıklamalardan anlaşılacağı üzere çoktan seçmeli testlerin yapısından dolayı, şans başarısından kaynaklanan şans hatası içerdiği, bu şans hatasının test ve madde istatistiklerinde bazı hatalara neden olduğu ve testin geçerliğini ve güvenirliğini olumsuz etkilediği söylenebilir. Çoktan seçmeli testlerin sahip olduğu bu hata türünün neden olduğu olumsuz etkiyi düzeltmek ya da en azından azaltmak, daha geçerli ve güvenilir sonuçlara ulaşmada önem teşkil etmektedir. Bu amaçla geliştirilen yöntemlerden biri olasılığa dayalı düzeltme formülleri bir diğeri ise öz değerlendirmeye dayalı düzeltme kullanmaktır. Bu araştırmada test ve madde istatistikleri üzerinde şans hatasının etkisini azaltmak için her iki yaklaşıma dayanan düzeltme formülü kullanılmış ve işlerliği tartışılmıştır.
Olasılığa dayanan düzeltme yaklaşımında bireyin doğru cevabından yanlış cevapların seçenek sayısına oranı kadar puan çıkarılır. Olasılığa dayalı düzeltme formülü kullanmada öğrencinin kesinlikle soruların bir kısmını şansla cevapladığı, her bir sorudan (1/seçenek sayısı) oranında puan kazanacağı varsayımı bulunmaktadır. Bu yaklaşımın en zayıf yönlerinden biri şans başarısının tüm sorularda eşit rol oynadığı varsayımıdır. Diğer zayıf yönleri ise uygulandığında öğrencileri yanlış cevaplarından dolayı cezalandırmak anlamı taşıması ve gereğinden fazla düzeltme yapmasıdır (Baykul, 2010; Turgut, 1971).
Öz değerlendirme, öğrencilerin kendi öğrenmeleriyle ilgili yargılarda bulunmaları (Boud & Falchikov, 1989) ya da öğretmenin oluşturduğu ölçütler veya bu ölçütler içerisinden öğrenciler tarafından seçilenlere göre kendilerini değerlendirdikleri bir yaklaşım olarak ifade edilmektedir (Dochy & McDowell, 1997). Bir başka ifadeyle, öz değerlendirme belirlenen bir konu, davranış veya süreçle ilgili olarak bireyin kendini değerlendirmesidir (Doğan et al., 2007). Yapılan bir tanımda öz değerlendirmenin, öğrenciye kendi öğrenme yeterlilikleri ve eksikleri konusunda belirleyici olma becerisini ve yüksek derecede farkında olma durumunu kazandırdığı ifade edilmiştir (Byram, 1997). Öğrencilerin çoktan seçmeli bir testi cevaplama esnasında verdikleri cevaptan emin olup olmama durumlarını belirtmeleriyle yapılan öz
değerlendirmenin, öğrencilerin test puanlarına karışan şans başarısını düzeltmeye yardımcı olacağı düşünülmektedir. Ayrıca öz değerlendirme yönteminin MTK’ya dayalı tahmin parametresine olan etkisi de belirlenebilmektedir. Bu durum öz değerlendirmenin düzeltme formülüne olan avantajlarından biri olarak değerlendirilebilir.
Öz değerlendirmenin çoktan seçmeli test uygulamalarında öğrencilerin hangi soruları bilip bilmedikleri veya bilgilerinden ne derecede emin oldukları hakkında bilgi verebileceği söylenebilir. Bu bilgileri elde edebilmek için öğrencilere cevaplarından emin olup olmadıkları sorulabilir. Böylece doğruluğundan emin olmadıklarını açıkça belirttikleri halde doğru cevapladıkları soruların eksik bilgiyle veya şansla doğru cevaplandığı düşünülebilir. Bu yönde bilgi toplanan soruların yanlış cevaplandırılması gerektiği kabul edilerek şans başarısında düzeltmeler yapılabilir. Böylece düzeltme formülündeki aşırı düzeltme kaygısı ve öğrencileri yanlış cevaplarından dolayı cezalandırma davranışı belirli bir düzeyde azalabilir. Araştırmanın temel aldığı özgün düşünce, öz değerlendirme sonuçlarına dayanarak şans başarısının geleneksel yönteme göre daha avantajlı bir şekilde düzeltilebileceğidir. Ayrıca alan yazında yer alan çalışmalar incelendiğinde, çoktan seçmeli test maddelerinin içerdiği şans başarısının öz değerlendirme yöntemiyle düzeltildiği bir çalışmaya rastlanmamıştır.
Bu düşüncenin ışığında araştırma problemi; “Öz değerlendirmeye dayalı şans başarısı düzeltmenin testin psikometrik özelliklerine etkisi nasıldır?”
şeklinde belirlenmiştir.
Araştırmanın Amacı
Araştırmanın amacı öz değerlendirmeye dayalı şans başarısı düzeltmenin klasik yaklaşımdan daha avantajlı ve etkili olup olmadığını ortaya çıkarmaktır. Araştırma şans başarısını düzeltme yaklaşımlarının hem sözel hem de sayısal alandaki etkisini gözleyebilmek için beş seçenekli çoktan seçmeli sorulardan oluşturulmuş Türkçe ve matematik testleri üzerinde yürütülmüştür. Araştırma iki kısımdan oluşmaktadır. İlk kısımda Türkçe ve matematik testi için geleneksel düzeltme formülü kullanmanın ve öz değerlendirmeye dayalı şans başarısı düzeltmenin test ve madde istatistikleri üzerindeki etkisi incelenmiştir. Klasik düzeltme formülü kullanılarak elde edilen sonuçlar ile öz değerlendirmeye dayalı şans başarısı düzeltme sonuçları test ve madde istatistikleri bakımından karşılaştırılmıştır. İkinci kısımda ise Türkçe ve matematik testi alan bireylerin puanlarında öz değerlendirmeye dayalı şans başarısı düzeltmenin Madde Tepki Kuramına dayalı tahmin (şans) parametresine olan etkisinin belirlenmesi amaçlanmıştır.
Yöntem
Bu bölümde araştırmanın modeli, çalışma grubu, veri toplama araçları, verilerin toplanması ve verilerin analizi ile ilgili bilgiler yer almaktadır.
Araştırmanın Deseni
Bu araştırmada, öğrencilerin test sorularını yanıtlarken emin olup olmama durumlarını belirttikleri öz değerlendirme sonuçları dikkate alınarak puanlamada düzeltmelere gidilmiştir. Yapılan bu düzeltilmiş puanlara bağlı olarak bazı test ve madde istatistiklerine bakılmış ve aynı istatistikler üzerinde klasik düzeltme formülleri kullanılarak sonuçlar karşılaştırılmıştır. Ayrıca şans başarısından arındırılmamış ve öz değerlendirmeye göre şans başarısından arındırılmış verilere ait tahmin parametreleri karşılaştırılmıştır.
Amacı var olan bilgiye yenilerini katmak olan temel araştırmalar, araştırma kavramının en yalın biçimde temsil edildiği çabalardır. Temel araştırmalarda, “bilgi, bilgi içindir” anlayışı egemendir (Karasar, 2012). Bu araştırma sonunda elde edilecek olan bulguların ölçme ve değerlendirme alanına kuramsal olarak yeni bilgi katacağı düşünüldüğünden bu araştırmanın temel araştırmalar sınıfına girdiği söylenebilir.