T.C.
ISTANBUL AYDIN UNIVERSITY INSTITUTE OF GRADUATE STUDIES
FACTORS AFFECTING YOUTUBE ADVERTISING VIDEOS
THESIS Obada ALORFAHLI
Department of Business Business Administration Program
T.C.
ISTANBUL AYDIN UNIVERSITY INSTITUTE OF GRADUATE STUDIES
FACTORS AFFECTING YOUTUBE ADVERTISING VIDEOS
THESIS Obada ALORFAHLI
Department of Business Business Administration Program
Advisor: Assoc. Prof .Dr. Erginbay UGURLU
DECLARATION
I hereby declare with respect that the study “Factors Affectıng Youtube Advertısıng Vıdeos ”, which I submitted as a Master thesis, is written without any assistance in violation of scientific ethics and traditions in all the processes from the Project phase to the conclusion of the thesis and that the works I have benefited are from those shown in the Bibliography. (.../.../20...)
FOREWORD
First of all I like to thank Allah who gave me the courage to do my thesis. After that I am really thankful to my father who supported me in every possible way and it would be impossible without his support. I would like to thank my supervisor for his excellent guidance and support during my thesis. I thank all of the respondents without whose cooperation I would not have been able to conduct my research. I would like to thank all my colleagues at university for their wonderful cooperation as well. My mother deserve a particular note of extra thanks for her wise counsel, kindness and her prayers.
August 2020 Obada Alorfahli
TABLE OF CONTENT
Page
FOREWORD ... iv
TABLE OF CONTENT ... v
LIST OF FIGURES ... vii
LIST OF TABLES ... viii
ABSTRACT ... x
ÖZET ... xi
1. INTRODUCTION ... 1
1.1 Background of Study ... 1
1.2 Statement of the Problem ... 1
1.3 Research Questions ... 2
1.4 Hypotheses ... 2
1.5 Significance of Study ... 3
1.6 Scope of the Study ... 3
1.7 Overview of Methodology ... 3
1.8 Limitation ... 3
1.9 Organization of Study ... 4
2. LITERATURE REVIEW ... 5
2.1 Social Media Usage ... 5
2.2 Advantages of using social media for science ... 6
3. THEORETIAL FRAMEWORK ... 7
3.1 E-Marketing definition ... 7
3.1.1 The Social media universally ... 7
3.1.2 Social networks adoption in worldwide ... 8
3.2 Online marketing: ... 9
3.2.1 Marketing strategy: ... 9
3.3 The Importance Of Advertising ... 11
3.4 Engagement On The Video ... 12
3.5 Understanding the Message ... 13
3.6 Advertising Memorable ... 14
3.7 Music In The Advertisement Videos ... 14
3.8 Demographics Factors ... 15
3.8.1 Education Level ... 15
3.8.2 Occupation ... 16
3.8.3 Personal Income ... 17
3.9 Types Of Social Media Platform ... 17
3.9.1 Facebook ... 17 3.9.2 Pinterest ... 19 3.9.3 Twitter ... 20 3.10 YouTube Definition ... 21 3.10.1 YouTube in numbers ... 21 3.10.2 Reaction on YouTube ... 22
3.10.3 Importance of YouTube as a platform ... 22
3.11 Demographic Of Youtube Advertising ... 23
3.12 Youtube Advertising Is Better Than TV ... 24
4. STUDY METHOD ... 26
4.1 Research Design ... 26
4.2 The Study Population ... 26
4.3 Sample and Sampling Techniques ... 26
4.4 Study Instrument ... 27
4.5 Study Validity ... 27
4.6 Study Reliability ... 27
4.7 Demographic Output ... 27
4.8 Frequency Analysis ... 29
4.9 Reliability Test need review ... 38
4.10 Descriptive Analysis ... 38
4.11 Hypothesis Testing ... 40
5. CONCLUSION AND RECOMMENDATIONS ... 49
REFERENCES ... 51
APPENDIX ... 53
LIST OF FIGURES
Page
Figure 3.1. Social Media Landscape ... 8
Figure 3.2: penetration rate of social media by country ... 9
Figure 3.3: 4 Ps ... 11
Figure 3.4: money spend on advertising ... 12
Figure 3.5: Engagement on YouTube ... 13
Figure 3.6: Facebook advertisement ... 18
Figure 3.7: Pinterest Platform ... 20
Figure 3.8: Alexa statistics ... 20
Figure 3.9: Alexa statistics ... 23
Figure 3.10: Alexa statistics. ... 23
Figure 3.11: YouTube targeting ... 24
LIST OF TABLES
Page
Table 4.1: Gender ... 27
Table 4.2: Age ... 28
Table 4.3: Education level ... 28
Table 4.4: Present Occupational... 29
Table 4.5: What kind of device that you use in YouTube ... 29
Table 4.6: intentionally ignored the advertisement. ... 29
Table 4.7: I always use internet for school or work purposes. ... 30
Table 4.8: The ad seems to try to deceive the viewer. ... 30
Table 4.9: After watching an advertisement on YouTube how do you react to it? .. 31
Table 4.10: Online advertising can easy create the brand image in my mind... 31
Table 4.11: Time (approx.) spent on social media sites per week (Hours). ... 32
Table 4.12: Online advertising helps me keep up-to date about products and services that I need. ... 32
Table 4.13: I always think about my favorite brand. ... 32
Table 4.14: I always use internet for entertainment such as Facebook, YouTube, Twitter and etc. ... 33
Table 4.15: The music of the video helps me to remember the advertisement ... 33
Table 4.16: The tone of voice of the video helps me to remember the advertisement ... 34
Table 4.17: The actor’s physical appearance of the video helps me to remember the advertisement ... 34
Table 4.18 : Online advertising can easy create the brand image in my mind. ... 35
Table 4.19: I always use internet for entertainment such as Facebook, YouTube, Twitter and etc. ... 35
Table 4.20: I always search for information or news on internet. ... 35
Table 4.21: I am annoyed by the ads because the advertiser normally tried to make the ad appear to be a part of the video content. ... 36
Table 4. 22: The music helps me to understand the advertisement message better. . 36
Table 4.23: The tone of voice helps me to understand the advertisement message better. ... 37
Table 4.24: The cues in the video helps me better understand ... 37
Table 4.25: Reliability Report ... 38
Table 4.26: Descriptive Statistics ... 38
Table 4.27: Chi-Square test relation between ignorance and education. ... 40
Table 4.28: Chi-Square test between react and education level. ... 41
Table 4.29: Chi-Square test between ignorance and engagement. ... 42
Table 4.30: Chi-Square test relationship between reacting and occupation level ... 42
Table 4.31: Chi-Square test relationship between create image and make the advertising video memorable ... 43
Table 4.32: Chi-Square test relationship between thinking about favorite brand image and make the advertising video memorable. ... 44 Table 4.33: Chi-Square test a relationship between brand image and make the
advertising video memorable. ... 44 Table 4.34: Chi-Square test relationship between thinking about the favorite brand
and make the advertising video memorable. ... 45 Table 4.35: Symmetric Measures. ... 46 Table 4.36: Symmetric measures relation between Voice and understand the
communicating the advertising message. ... 46 Table 4.37: Symmetric measures the relation between music and understand
communicating the advertising message clearly. ... 47 Table 4.38: Symmetric measures the relation between voice and understand the
FACTORS AFFECTING YOUTUBE ADVERTISING VIDEOS ABSTRACT
Now day’s social has become very important for companies in different sectors to communicate with their target audiences. And to create a good image in the audience's mind. With the new digital platforms, social media marketing becomes more and more important and the effectiveness of those platforms today is an important incentive to the marketer to determine which platform is the best to make determined. This study searches the effectiveness of YouTube advertisements. The study focused on the impact of education and occupation on YouTube advertising videos, and how those variables play a critical role on the effectiveness of advertising videos. A survey questionnaire is implemented on 400 people located in Istanbul to search how they connect and react to the YouTube platforms, what makes the advertising video memorable, and factors that provide a clear understanding of the video message. The study found three important points. These are: there is a significant relation between the occupation and education engaging the advertising video, there is a significant relation between education and occupation with making the advertising video memorable, and there is a significant relation between education and communicating the advertising message clearly to YouTube viewer. In addition, there is no relation between occupation and communicating the advertising message clearly to YouTube viewer. As a result, all of these findings are crucial for the advertiser to be able to target the best audiences clearly, and also to protect companies from wasting money and targeting the wrong audiences.
EĞITIM VE MESLEĞIN YOUTUBE REKLAM VIDEOLARI ÜZERINDEKI ETKISI
ÖZET
Günümüzde sosyal medya, farklı sektörlerdeki şirketlerin hedef kitleleriyle iletişim kurmaları açısından çok önemli bir yer edindi. İzleyicilerin zihninde iyi bir imaj yaratmanın yanı sıra yeni dijital platformlarla sosyal medya pazarlaması gittikçe etkisini arttırdı. Günümüzde bu platformların etkinliği, hangi platforma zarar vermenin en iyi olduğunu belirlemesi açısından pazarlamacı için önemli bir teşviktir. Bu çalışma YouTube reklam etkinliği hakkındaki araştırmaları bulunduruyor. Çalışma, eğitim ve mesleğin YouTube reklam videoları üzerindeki etkisine ve bu değişkenlerin etkili reklam videoları üzerinde nasıl kritik bir kural oynadığına odaklandı. İstanbul'da bulunan 400 kişiye YouTube platformlarına nasıl tepki verdikleri ve bağlantı kurdukları, reklam videosunu unutulmaz kılan nedenler nelerdir tarzında sorular formu ile yapıldı. Ayrıca video mesajını net bir şekilde anlamaya çalışma, meşguliyet reklam videosu ile meslek ve eğitim arasında anlamlı bir ilişki bulundurmuştur. Unutulmaz reklam videosu ile ise reklam, iletişim, eğitim ve meslek arasında anlamlı bir ilişki bulundurmuştur. YouTube görüntüleyicisine açık bir şekilde mesaj gönderin. Sonuç olarak; tüm bu bulgular, reklamveren için en iyi kitleleri hedeflemek, şirketleri para israfından ve yanlış kitleleri hedeflemekten korumak için çok önemlidir.
1. INTRODUCTION
1.1 Background of Study
Advertising is very important at the business, and there is offline advertising which is following the old and traditional ways to advertising, for example, advertising on TV, newspaper and billboard advertising and online advertising which is the most important in our days because we use the internet a lot in our life’s in addition to the social media like Facebook, YouTube and google ads and more from the social media platform.
In this study, we will take YouTube platform which is very important, and this platform only use video ads; usually YouTube ranking globally is number 2 after google out of a billions of websites regarding to (Alexa.com, 2020) so it is very important to take a look about this important platform.
This study will be about the impact of education and occupation on YouTube advertising videos because usually the idea from the video it is to motivate the audiences to engage the video, and there is a lot of factors effect on the advertising video such as age and gender. But this study will talk about occupation and education level.
Is there a relation between the education level and occupation with YouTube engagement videos? Is those two factors are effecting on YouTube advertisement memorable? In addition to, is there a relation between communicating and understanding the advertising message clearly to the viewers on YouTube with the occupation and education level?
1.2 Statement of the Problem
Companies pay a lot of money to introduce one single video and to apply the advertising of that video. In some cases it will recognized that there is no engagement to that video or the video is not memorable for the potential customers or even the message to the audience is not clear. Unfortunately those
ads or videos will be useless, and with no advantage to that company. There are some factors this study will take about them on the audience. The companies have to take them into their Consideration because the ads are not only a good videos or use the best platform. It is also how the companies will targeting the audiences and which audience is the best to attract them.
1.3 Research Questions
The research will answer the following questions:
1- Are education level and occupation necessary for the viewer to engage with the ad on YouTube?
2- Are education level and occupation have impact on communicating the advertising message clearly to YouTube viewers?
3- Are education level and occupation necessary to make an advertisement memorable?
1.4 Hypotheses
The following hypotheses formulated for testing:
Hypothesis 1: there is a relationship between education and engaging the advertising video.
Hypothesis 2: there is a relationship between occupation and engaging the advertising video.
Hypothesis 3: there is a relationship between education and making the advertising video memorable.
Hypothesis 4: there is a relationship between occupation and making the advertising video memorable.
Hypothesis 5: there is a relationship between occupation and communicating the advertising message clearly to YouTube viewers.
Hypothesis 6: there is a relationship between education and communicating the advertising message clearly to YouTube viewers.
1.5 Significance of Study
The findings that we will found out from this study will help to highlight on the occupation and education of the audiences that will effect on YouTube advertising. In addition to answer the question why there sometimes companies will made a very good advertising video on YouTube, but with no engagement from the audience hopefully, this study shows the main causes that help the advertiser to make better advertising on one of the most powerful platform in the world.
1.6 Scope of the Study
In this study the will take a random sample from people who use YouTube from different demographic and will consist of male and female with different education level and work. Besides that the sample will be from the foreigners who live in Turkey and the Turkish citizens.
1.7 Overview of Methodology
The research use a primary data which is the Primary data will obtain from people who use YouTube located in turkey and consist from both foreigners and Turkish citizens to make sure that this study will be enough for companies looking for answers to the question that we mentioned before at the study.
1.8 Limitation
The emergence of new programs and platforms affects YouTube before there was only YouTube for video advertising. Still, today many platforms provide the same services and may be better than YouTube. We can recognize that the engagement decreased in 2016 when other platforms showed up, for example, Netflix, this company attracted a lot of audience from YouTube, and there are more programs as well but still YouTube until today is number 2 in the world regarding (Alexa.com, 2020).
1.9 Organization of Study
The chapter one will be an introduction to the study with the background, statement of problem, objectives in addition to the significance of the research, and limitations.
Chapter two literature reviewed on the empirical evidence that the education, occupation will affect the advertising on YouTube from engagement, memorable and communicating the advertising message clearly.
2. LITERATURE REVIEW
2.1 Social Media Usage
As Boyd & Ellison (2007) describe the social media sites regarding to the services that let the individuals (1) to create public profile or profile with some privacy within a specific framework, (2) and let other users to share the link with them and contact with others, and (3) to access and move between their friends and family or even other connections that they do not know created inside the plat form. And the name of this communication it may change from a specific location to another one.
Due to the different capacities social media websites offered, the audience and people on these platforms they were significantly growing year by year. People are using their telephones, and computers to join this electronic platform in addition it is very useful for advertiser to achieve their potential customer targeting. (Kwak, 2012).The worth mentioning that also Kwak (2012) said it can examine how online media could be considered rich or poor based on the way of how that media communicate with audiences and how that platform motivates the audience to act. In addition, the viewer’s use specific platforms depends on their social and communication reasons at a particular time, and those reasons change from time to time. Besides the platforms which give and motivate the audiences to react and give information on how to respond provides a high level of reacts. Therefore the YouTube, Facebook and Twitter offer a high level of reaction.
Previous study for Flanagan & Metzger (2001) analyzed how people use new network platform instead of the traditional networking, especially that the internet satisfying the needs that the people have. The analysis found that communicating demands had growth for fresh networking comparing with the traditional network. The reasons is that social technologies had been useful for personalized experiences for relationship creation, and some behavioral
functions. The research discovered ten demands that new media meets that were advice, finding out, drama, amusement, persuasion, social communicating, romantic relationship creation and care, difficulty, standing, and comprehension. Anyway this research confirmed that the people use specific platform regarding to their needs. Also the researcher focused on social media platforms usage but especially on YouTube. YouTube is a significant system that may be used to get numerous reasons such as “advertisements, archival work, education, entertainment, journalism, political communication, art and culture, religion, health, military, and fandom, Interpersonal communication, and monitoring”. Because this platform is so varied, so communication theories need to become reconstructed to analyze that platform which is evolve from day to day and every second.
YouTube platforms is more than normal social media it is very huge platform. People can upload video from everywhere in the earth without any monitoring which was not excite before. (Soukup, 2014).
2.2 Advantages of using social media for science
Frank (2018) said we have very huge platforms such as Twitter Facebook and LinkedIn which contain a very huge number of active member we can take this as an advantage to promote research interests.
Kashmir (2014) Facebook in 2010 made a research on the users, and the subject was how news spread on Facebook. They applied this study for seven weeks on 251 million active users, the conclusion was when those users saw one of their friends react on the post the was more likely to react on that news as well.
3. THEORETIAL FRAMEWORK
3.1 E-Marketing definition
It is the process to link the companies with their customers throw internet channels also contain the internet marketing, email marketing and also the wireless media. In addition sometimes call it digital marketing, internet marketing and web marketing. (Chaffy & smith, 2008).
Also Alan (2007) define E-marketing as “E-marketing is a process of planning and executing the conception, distribution, promotion, and pricing of products and services in a computerized, networked environment, such as the Internet and the World Wide Web, to facilitate exchanges and satisfy customer demands.”
3.1.1 The Social media universally
There is a lot of people use social media in the world, and there is a massive number of people communicate with each other throw many types of social media. Besides, the number of social media platforms is increasing and in somehow social media effect on our lives and the way we act and transfer our knowledge to other people throw those platforms. (Alyssa & Nick, 2010).
Social media platforms used by the big and small companies which help them to reach a new potential market and customers in the foreign regain. This new model of the market creates a significant opportunity for a new business model throw online channels. (Tapscott & Williams, 2008).
There are a lot and a lot of social media platforms that effect on human lives beside that every platform have different type of reaction. (Cavazza, 2008) Cavazza (2008) suggest the graphic below tell us the different type of plat forms:
Figure 3.1. Social Media Landscape 3.1.2 Social networks adoption in worldwide
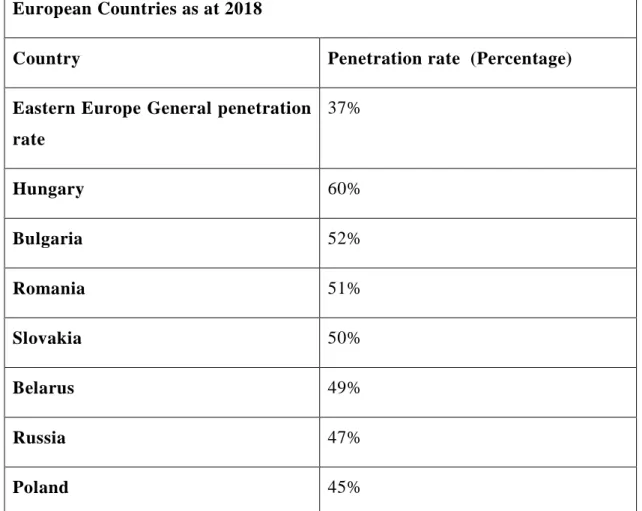
In January 2018, a public relation agency and global marketing had made a global audience measurement publish a study on how much the social media is active in Europe. As the study shows that 45% people were active in social media platforms such as Facebook YouTube and twitter. While Russia has been registered a little bit higher than European and it was 47% and the journey said that the average global rate is 37% (Statista.com, 2019). The figure below show the penetration rate of social media by country:
European Countries as at 2018
Country Penetration rate (Percentage)
Eastern Europe General penetration rate 37% Hungary 60% Bulgaria 52% Romania 51% Slovakia 50% Belarus 49% Russia 47% Poland 45%
Figure 3.2: penetration rate of social media by country 3.2 Online marketing:
Online marketing is very important to the companies because they promote there products and services throw different platforms and when the viewer saw the ads on the platforms they will aware about the product or services that the firms provide it. (Business dictionary, 2016). As Stokes (2012) said that the concept of marketing and promoting is not new but it took different way to promote within different social media and plat forms.
3.2.1 Marketing strategy:
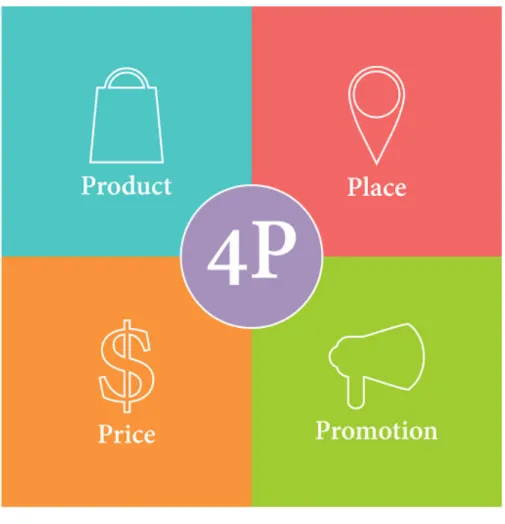
The best marketing strategy is to use 4 PS (place, price , product and promotion ) which is the most important if the companies want to insure that the product will success (Stokes, 2012).
Product: it will be a tangible good which the customer can hold it or intangible such as a service that will meet the customers need and wants. It is very
important to study the product and the customers that the company will target them (Stokes, 2012). In addition William (2015) said the product is the most important factor that will effect on the marketing strategy. The worth mention that all product followed the product life circle and it is very important for the marketers to act regarding to that circle.
Price: the price will cover all expenses that cause to provide a specific product or service A) Manufacturing expenses such as a labor expenses and raw materials. B) Marketing expenses such as making videos on the social media platforms or traditional way on TV. C) And management expenses (Stokes, 2012). Also Mike (2019) said describing the price effect, if the companies’ decided a price higher than the market place and the customers saw the product did not deserve this price then the product will fail.
Place: which place is the best to provide the company’s products and services and decided which channel is the best for the companies to achieve the goals behind the product and meet the customers’ needs and wants (Mike, 2019). Promotion : the promotion is include all kind of marketing such as social media marketing, traditional marketing on TV or any other marketing channels. It is very important to know which channel is the most suitable to the product or services. (William, 2015)
Figure 3.3: 4 Ps 3.3 The Importance Of Advertising
The advertising creates a competitive market and lets the individuals know the whole prices and the quality of each product. Also, that advertising will reduce the effort to search on specific product because if the customers will go to the market and search for the product, it will take a long time and effort, in conclusion. This society who have a lot of advertising it will cause to have healthy competition and economic environment. In addition to the better life for the individuals comparing with the society who do not have much advertisement. (Shapiro, 1984).
On the other hand, some parties see that the advertising tries to change the receiver opinion without changing the product features. The individuals who are living in that economy which contain a lot of advertising they are living in bad economic. Because in that economy the prices are very high and they do not
know which product has the best quality, and almost there is no competition. (John & Karen, 2003)
Regarding (Statista.com, 2018) shows that UK spend on advertising in 2016 around 4.9 billion GBP and in 2017 around 5.8 Billion GBP
Figure 3.4: money spend on advertising 3.4 Engagement On The Video
Engagement is the emotions that the customers have when they saw the ads on newspapers, TV, or internet platforms for their favorite brand and the way they act. (Goldsmith, 2012)
The immediate feedback is very important to the advertiser because this feedbacks let the advertiser know if the viewer understands the message or no. In case the viewer did not understand the message from the advertisement, the advertiser or the publisher must change the video or maybe the targeting. The feedback may take some time regarding the content of the advertising. (Dennis, A. R., & Kinney, 1998)
To reach a high level of engagement, the advertiser has to publish a smooth message for the specific target audience. (Dennis, A. R., & Kinney, 1998)
The attitude on online advertising measures by how many clicks that these videos had taken. Besides, more clicks on a specific video took more positive and more likely that people will buy that product and would give a high response to that website (Korgaonkar & Wolin, 2002).
After those platforms such as Facebook, Twitter, and YouTube, the advertiser has to keep focusing on customer's engagement and how to keep the customer's attention to the video. The power of those platforms is to keep the customers updated and create brand awareness in addition to the immediate reaction on videos. In our days, the advertiser in maximum four days can know if the video goes to the right audiences and if the product is workable or no. also, those platforms opportunity to discuss the products and features throw those social media. (Wirtz et al., 2010)
Figure 3.5: Engagement on YouTube 3.5 Understanding the Message
Before the advertisers publish the advertising to the public audiences they have to determine the message from that video and it have to be a one single message. The successful advertising is the one who have a single easy message can the audiences understudied when they saw it. Dennis, A. R., & Kinney (1998) showed the five characteristics that effect on communication, and therefore, “media richness:
(a) Immediacy of feedback, which determines the rapidness of the bi-directional communication.
(b) Symbol variety, which determines the number of ways that the information can be communicated.
(c) Parallelism, which refers to the number of conversations that can be happening simultaneously.
(d) Reachability which, refers to how the medium allows individuals to rehearse the message before sending it.
(e) Reprocess ability, which relates to the amount of time a message can be re-read and examined.”
Social media platforms provide many services and the capabilities to display the advertisements or the videos. Beside that every platform have their own competitive advantage from the way they reach the audiences. In general the best platform will measure on how they will provide the advertisings and the way that will provide the messages to the viewer (Dennis & Valacich, 1999).
3.6 Advertising Memorable
The powerful of advertising videos on the social media platforms or on TV is how to motivate the imagination of the viewer and touch the ability of minds to imagine the products or services because imagination is the main way to make the viewer memorized the product. This ability came from the targeting a specific audiences (Bergstra & Van, 2010).In addition that every segment have different type of imagination and the way that person feels about the specific video and the ability to feel it again every time he/she saw the video, and the young people have different imagination about the specific product than the adults or the educated person (Perdue, 2003).
3.7 Music In The Advertisement Videos
In the advertising video the music inside the video very important because the viewer maybe remember the music more than the video itself, which cause remember the advertising in general and the brand. In addition rarely the viewer saw advertisement without music background. Even in the beginning of 70s when was the TV advertisement channel was the most effective way the music was the most important factor in the videos (David, 2003). In addition Bethany,
(2012) said that the popular music have positive affect on the advertisement video. And help the viewer to focus on the video.
3.8 Demographics Factors 3.8.1 Education Level
Regarding to Papachaarissi & Rubin (2000) Education change the way of how people think and react towered specific situation and education is not only the academic knowledge also the education came from the parents, society and even friends. However, Rossiter & Percy (1997) said the education that transfers the knowledge to other generations and how people think or solve the problem. As Best, Hawkins & Coney (2001) Said that the different education levels effect on various types of people regarding the reign, people, language.
As Best, Hawkins, & Coney (2001) said in the old day's literacy definition was limited to the write and read, but after the internet came to our lives, the literacy definition is changed to the people who do not know how to work on the internet.
Lofosse (2002) said about the relation between the educations and advertising is a critical factor that affects online buying behavior in different platforms with different advertising. Besides that, the higher educational level means higher positions in the companies and causes higher income and people willing to pay widely in online shops (Li, Kuo, & Russell, 1999).
As Simon & Schuster (2000) Defined the education is the simply combination between skills knowledge habits customers and the values that transfer from one generation to other within a specific society or risen, because skills and habited changed from segment to segment
The goals of learning and education is to rise the society knowledge and performance because the high knowledge of the individuals means high performance of society (Ford, 1986). Generally the knowledge come from school or universities or even life experiences which comes from work or communicating with other people which helping the person to understand clearly the feelings and the capability of solving problems (Honeyman & Miller, 1993).
Educational level is different from person to person based on the degree of the study or even any certificate, the higher education level may create higher opportunity to make life better or any other life better. High civic engagement measure by the high education level (Campbell, 2006). And Shavitt, et al (1998). Said that people who have higher income level in addition to the higher education level act towered the advertising positively more than who has lower income level or lower education level, regarding to the willingness to pay to the product or the services or understanding the features product. (CNINC, 2011) the higher internet users in china 2011 is from educated male.
3.8.2 Occupation
The main factors that affecting on the advertising is occupation and the level of that occupation in addition to the speed of internet connection (Christos, 2000). The advertising which goes into details with the personal demographic such as gender and occupation will be more effective from the advertising that the target audience will be in general in addition that the Facebook and YouTube advertising allow the advertiser to determine the specific demographic such as gender, age and occupation because how much you targeting on social platform how much your advertising will be more effectiveness (Cramphorn, 2011). As Katherine (1996) to know the customer when a small business owner open a new business is very important to use the right segment that the business serve them, starting from gender, age, income level and occupation because each one from them have the own characteristics, after identifying the segments the owner can determining the market area and location. (Dave Kerpen, 2011) on some platforms such as twitter, YouTube and Facebook marketers can target by job title which is extremely valuable because you can target the CEO or mangers who are wailing to pay for a specific product more than other, in addition for business B2B marketers can targeting the purchasing managers. (John Wiley & Sons, 2011) the variables of occupation plays a significant targeting especially when the advertiser make an advertising on LinkedIn and Facebook, LinkedIn it is much provincial in the job title because there is almost every job title you can write and LinkedIn platform asked the user to write their job title even though LinkedIn is one-sixth the size of Facebook globally also
Facebook have this kind of targeting it is very effective targeting for B2B business
3.8.3 Personal Income
The personal income is the amount of money that the personal receive it from the different source such as bonds work and any investments that lead to receive income and generally gained at specific time zone. However Campbell (2012) said normally the most personal income may come from personal investing, bank transfer payment from work or government interest at specific time monthly, semi-annual or annually in addition to the dividend interest from banks regarding to the deposit may the persons do it to provide money, also wages, rental property.
3.9 Types Of Social Media Platform 3.9.1 Facebook
Facebook plat form is one of the most popular platform in the world, the users in Facebook in 2016 around 1.7 billion. It is very huge number regarding to the other platform. The wroth mention is this platform created by a student in 2004 from Harvard University (Facebook, 2016).
The success of Facebook come from the easy way to work on this platform. Users can easily create there account with the simple personal information such as age, email and phone number and the Facebook will verify the account within 5 munities by the phone or the personal email (Facebook, 2016).
The way that the Facebook deal with the content and the pictures attract the companies and individual in addition to the marketers (Facebook, 2016). Regarding to the huge users on Facebook marketers considered this platform is very useful. Moreover companies make different kind of advertisement on this platform that helps them to attract new potential customers around the world (Dan, 2012).
Steven (2010) descried the Facebook advertisement and explain what kind of advertisement we have on Facebook:
a) Awareness: those kind of advertisement companies use it to show the brand to the potential customers inside this part of advertisement we have a segmentation which contain the demographic segment, language segment, age and place.
b) Considration : the company use those kind of advertisment to let the viwer take an action on those advertisment as figru !_! there is an engagment advertisment which encorage the viwer to take action on this advertisment such as Like , Comment and share. İn addtion there is a traffic advertisment which encorage the viwer to take action to go to the specific website ( company website ). Also there is a massges advertisment which encorage the viwer to send a massage. And the most important advertisment is lead generation, which is the most complecated advertisment in this part becacuse it will collect the personal information for the potantial customer who are willing to pay for the product or service.
c) Conversion: those kind of advertisment the companies use it if they are selling online product or service by the website diractly.
3.9.2 Pinterest
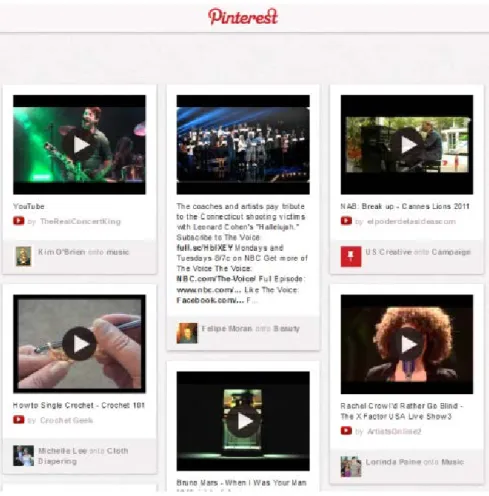
Pinterest platform established in 2010 in USA California and this platform targeting pictures at the beginning the platform targeting people who have different types of activity and the individuals who love to share their adventure and stories with the society and other individuals (Pinterest, 2014).
Later Pinterest become more and more popular for the people and society and the companies realized that this platform is effective regarding to the way that this platform is work. The company realized that individuals attract to the pictures with less words or explanation (Pinterest, 2014).
Individuals can share any picture from different users and they can save the picture in their story in addition that the first publisher take an advantage from this share and the pictures become more and more popular. In addition that the ability to the comments and the like button (Pinterest, 2014).
After two years from the company establishment the platform opened to the companies which achieved a high success and within a short time there was more than a thousand from companies who involved in that platform (Smith 2016).
Figure 3.7: Pinterest Platform 3.9.3 Twitter
It is another types of social media platform and it is very famous popular platform, the plat forms. The platform depending on a small type of content and also the users can add pictures or video to support their content. The platform established be Jack Dorsey, Evan Williams, Biz Stone. (MacArthur, 2016)
Regarding to Alex (2020) twitter in global internet engagement number 47 which is a very good number regarding to other platform.
As Hillson (2014) said after Twitter platform go into business environment the company achieved a very successful goals in the marketing sector. In addition that there are many companies make advertisement on twitter and become a global company.
The worth maintain that the advertisement have a significant targeting and very successful and it is much easier than the other social media platforms such as Facebook or YouTube or even Google. (MacArthur, 2016).
3.10 YouTube Definition
YouTube created in February by two of employees was working in PayPal they were not satisfied on the sharing video experience (Stone, 2006). YouTube platform as google company described this platform as a social platform for sharing videos the worth mentioning it is the biggest platform for sharing videos in the world.
3.10.1 YouTube in numbers
YouTube platforms have grown daily, and there is 300 new video uploaded every minute. Also between 2014 and 2015 YouTube platform achieved increasing users until 40% (YouTube, 2015).
Furthermore, YouTube platform archived videos more than NBC, CNBC and national geographic in 60 years together, (Wesco, 2009). Normally the higher number of users for YouTube platform between 18 and 25 and the average sitting on YouTube was for that segment is 10 hours and 15 minutes per month. (Blattleberg, 2015). YouTube platform is very big people can downloads the videos and then can see it again many times and share it to the whole world without any borders and YouTube make control on this types of platform and other people see this platform is a big competitor to the TV. (Kim, 2012). The competitive advantage of this plat form is the way that the customers react on the video and they show there reaction towered the brand (Chang & Lewis, 2009).
3.10.2 Reaction on YouTube
The interactive of YouTube platform creates a space for the viewer and the publisher to act on the videos. Such as request the viewer a new episode for the specific series or they critique the video. In addition to the like and dislike bottom, which reflect the audience's emotions about the video. Besides, the publisher can publish anything they want from stories to adventures and products. (Burgess, 2009).
The worth mentioning the algorithm of YouTube is very powerful and sophisticated. YouTube wants to provide the most unique and powerful content to the viewer. That is why the reaction to the videos is critical. There are many ways to measure those videos:
1) Watch duration: if the viewer's complete the whole video or just a few second 2) Positive comment: the viewer’s write positive feedback or request the next video form the publisher.
3) Playlist add 4) like bottom. 5) Dislike bottom. 6) Favorite video.
All those actions tell YouTube's algorithm if the video is good or not. (Sean, 2015)
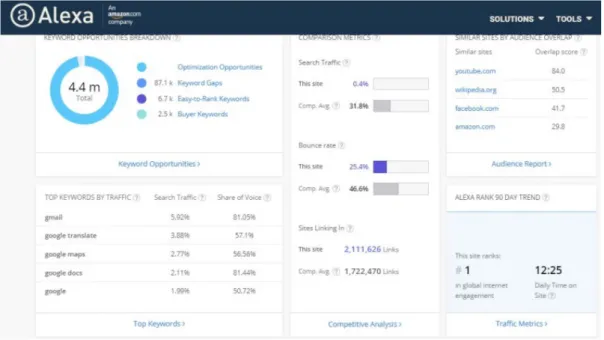
3.10.3 Importance of YouTube as a platform
Regarding Alex, which is the first website to measure the traffic globally and show the statistics of the traffic. The website shows that the number one globally is google and the second one is YouTube.
Figure 3.9: Alexa statistics
As Alexa shows that Google is number one and the second will be YouTube
Figure 3.10: Alexa statistics. 3.11 Demographic Of Youtube Advertising
Demographic factors are one main factors that affect advertising, attitude and behavior. In addition that every segment have different attitude or reaction on a specific product or service (Hui & Wan, 2007). Also Wong (2002) said there are
different types of audiences demographic we have to put them in our minds when we make any advertising such as age, income level, education, gender because we may put advertising to the wrong people. Also (Brackett & Carr, 2001) said it is different between the market segment regarding the income level, education, occupation and the different reaction on the advertising. In addition Wolin & Korgaonkar (2002) said the demographic factors always used to segment the market and achieve the higher goals in the advertising at the minimum cost and increase the sales in addition to the positive feedback. In the other word Wang, Zhang, Choi & Eredita (2002) said that the factors that effect on the advertising video on the social platform's efficiency are the content of the advertising itself if that advertising is funny, memorable, touch the consumer's hearts, legally or honest advertising.
3.12 Youtube Advertising Is Better Than TV
Before YouTube, companies pay a lot of money to make ads on TV, and like any other advertising, usually, the people go to make something; meanwhile, the advertising is running on TV. The worth mentioning is only 3% take their attention because the audience generally from the public and there is a different type of audiences without filtering. But the YouTube platform companies can choose the audiences carefully from age, gender, interest and even the income. In this effective way, the adverting will be more effective than TV. (McLeod, 2017).
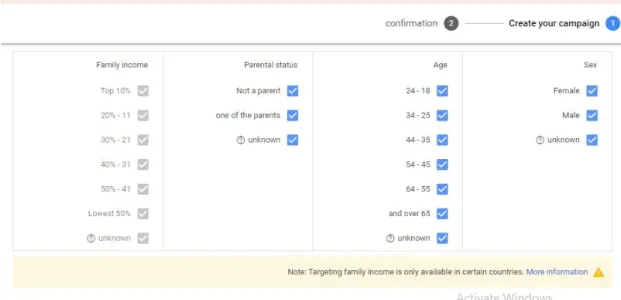
As Rob (2016) said to get using YouTube platform for advertising the marketers have to be a familiar and have good knowledge in targeting. The Figure above show that the YouTube give the marketers the ideas on the targeting that it may help them to reach the potential customers in the area or even around the world.
Figure 3.12: YouTube targeting
As Lora ( 2019) said that YouTube have a significant targeting algorithm and there is many ways to target the potential customers around the world.in addition in YouTube targeting we can target the age which they have around seven groups for age starting from 18.in addition there is the gender. Also there is the parental statue.
4. STUDY METHOD
4.1 Research Design
Research design is the process to arrange the data to provide specific question for the research questions (Mugenda and Mugenda 2004). This examination utilized descriptive review method in getting data from the audience. Descriptive review research portrays outline of individuals, events, or record of the characteristics, for example direct, evaluations, limits, feelings, and learning of an individual, condition or assembling. The illustrative survey strategy was favored asserting it ensured all out depiction of the situation, guaranteeing that there is least inclination in the gathering of data.
4.2 The Study Population
The population was focused on the population in Istanbul, and the population from the local citizens and foreigners, Istanbul city, contain a high population number around (worldpopulationreview.com, 2020) is 15.190.336 person.
The study sample consists of some selected persons within Istanbul. 400 person is involved in the survey from different ages. And this selection will be randomly with different occupation, education level, age and interest.
Regarding to the equation Sample size = [1.962x (0.5) x (0.5)]/ (0.052) = 384.16
4.3 Sample and Sampling Techniques
The study sample consists of some selected persons within Istanbul. 400 Person shall be involved in the survey from different ages. And this selection will be randomly with different occupation, education level, age and interest.
4.4 Study Instrument
The tool utilized for the gathering of information was self-developed poll which will be positioned for the reliant variable and free factors with five-Likert scale, for example, strongly agree, agree, undecided, strongly disagree, and disagree. The survey consist for the following: statistic attributes of the participants (gender, age occupation and education level) while the other question in the survey how the audiences react on the YouTube advertising and how they react when they saw YouTube advertisings.
4.5 Study Validity
The purpose of validity is to verify if the measure of the content. In addition is how items used in the survey and how clearly they was. Verification mode show that the questions covered all important details that helps in the study.
The present study used descriptive research design in order to collect survey with questionnaire as a primary data which is required in the study.
4.6 Study Reliability
To be sure from the quality of the investigation, the test exposed to the retest strategy, the study analyzed be using coefficient Alpha (Cronbach`s Alpha) based on the rule of thumb, a Cronbach Alpha coefficient above 0.05 is considered reliable.
4.7 Demographic Output Table 4.1: Gender
Valid Frequency Percent Valid % Cumulative %
Female 85 21.3 21.3 21.3
Male. 315 78.8 78.8 100.0
Total. 400 100.0 100.0
In the table 1 above, the report shows that 21.25% of the participants are female while the 78.75% participants are male. This concludes that male respondents are more than the female respondents.
Table 4.2: Age
Freq. Percent Valid
Percent Cumulative Percent
Under 18 1 0.3 0.3 0.3 18-22 4 1.0 1.0 1.3 23-26 40 10.0 10.0 11.3 27-30 187 46.8 46.8 58.0 31-35 141 35.3 35.3 93.3 36-45 23 5.8 5.8 99.0 +46 4 1.0 1.0 100.0 Total 400 100.0 100.0
0.25% of the respondents are under the age of 18, 1% are in the age group of between 18-22, 10% are in the age group of between 23-26, 46.75% are in the age group of between 27-30 , 35.25% are in the age group of between 31-35, while 5.75% are in the age group of between 36-45, and 1% are above the age of 46. This shows that the age group of between 27-30 has the highest percentage followed by the age group of between 31-35, the age group of between 23-26, the age group of between 36-45, with the same percentage the age group of between 18-22 and above the age of 46, lastly under the age of 18.
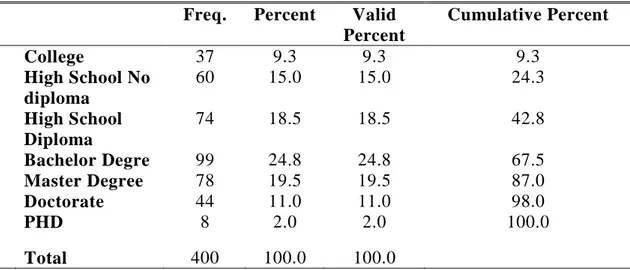
Table 4.3: Education level
Freq. Percent Valid Percent Cumulative Percent College 37 9.3 9.3 9.3 High School No diploma 60 15.0 15.0 24.3 High School Diploma 74 18.5 18.5 42.8 Bachelor Degre 99 24.8 24.8 67.5 Master Degree 78 19.5 19.5 87.0 Doctorate 44 11.0 11.0 98.0 PHD 8 2.0 2.0 100.0 Total 400 100.0 100.0
The Education level of the respondents revealed that 9.25% respondents are college holders, 15% respondents are High School No diploma holders, 18.5% respondents are High School Diploma holders, 24.75% respondents are Bachelor Degree holders, while 19.5% respondents are Master Degree holders While, 11% respondents are Doctorate Degree holders and 8 respondents are PHD degree . The total respondents is 400.
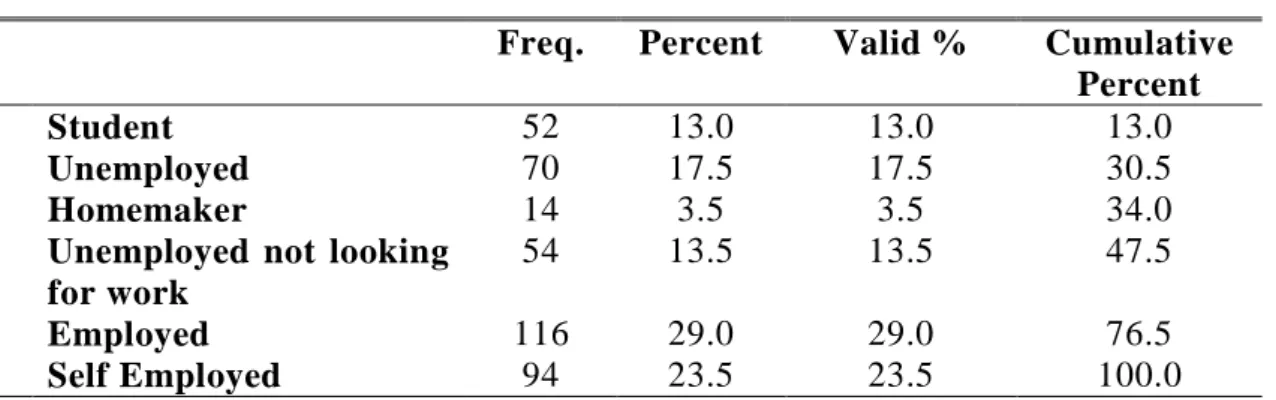
Table 4.4: Present Occupational
Freq. Percent Valid % Cumulative Percent
Student 52 13.0 13.0 13.0
Unemployed 70 17.5 17.5 30.5
Homemaker 14 3.5 3.5 34.0
Unemployed not looking for work
54 13.5 13.5 47.5
Employed 116 29.0 29.0 76.5
Self Employed 94 23.5 23.5 100.0
The present occupational of the respondents revealed that 13% respondents are student, 17.5% respondents are unemployed, 3.5% respondents are Homemaker, 13.5% respondents are unemployed not looking for work, while 29% respondents are employed while, and 23.5% respondents are self-employed. The total respondents is 400.
Table 4.5: What kind of device that you use in YouTube
Freq. Percent Valid % Cumulative Percent Desktop 10 2.5 2.5 2.5 Laptop 50 12.5 12.5 15.0 Tablet 23 5.8 5.8 20.8 Mobile 317 79.3 79.3 100.0 Total 400 100.0 100.0
The report revealed that 2.5% participants that they use desktop when they open YouTube, 12.5% participants laptop, 5.75% participants are tablet, 79.25% the use Mobile phone when they open YouTube.
4.8 Frequency Analysis
Table 4.6: intentionally ignored the advertisement.
Freq. Percent Valid % Cumulative Percent Never 73 18.3 18.3 18.3 Rarely 89 22.3 22.3 40.5 Sometimes 113 28.3 28.3 68.8 Often 62 15.5 15.5 84.3 Always 63 15.8 15.8 100.0 Total 400 100.0 100.0
Table 6 shows that 18.25% participants that they never ignore the ad for any product, 22.25% participants rarely , 28.25% participants are Sometimes they ignore the ad on social media platform, 15.5% participants often ignore it , while 15.75% are always ignore the ad on the social media. This is said that the person totally ignore the ad whatever the product is.
Table 4.7: I always use internet for school or work purposes.
Freq. Percent Valid % Cumulative Percent Never 16 4.0 4.0 4.0 Rarely 81 20.3 20.3 24.3 Sometimes 110 27.5 27.5 51.8 Often 73 18.3 18.3 70.0 Always 120 30.0 30.0 100.0 Total 400 100.0 100.0
The table 7 revealed that 4% participants that they use internet , 20.25% participants rarely , 27.5% participants are Sometimes they ignore the ad on social media platform, 18.25% participants often ignore it , while 30% are always ignore the ad on the social media. The majority that the person totally ignore the ad whatever the product is.
Table 4.8: The ad seems to try to deceive the viewer.
Freq. Percent Valid % Cumulative Percent Never 71 17.8 17.8 17.8 Rarely 83 20.8 20.8 38.5 Sometimes 115 28.8 28.8 67.3 Often 39 9.8 9.8 77.0 Always 92 23.0 23.0 100.0 Total 400 100.0 100.0
The table 8 revealed that 4.25% participants that see the ads does not try to deceive the viewer , 20.75% participants rarely , 27.75% participants are Sometimes ads does try to deceive the viewer, 9.75% participants often ads does try to deceive the viewer , while 15.5% are always ads does try to deceive the viewer.
Table 4.9: After watching an advertisement on YouTube how do you react to it? Freq. Percent Valid % Cumulative
Percent Ignore the
advertisement
122 30.5 30.5 30.5
liked the video 57 14.3 14.3 44.8
comment on the video 52 13.0 13.0 57.8
Consider the product or service
70 17.5 17.5 75.3
Research about the product or service
77 19.3 19.3 94.5
Purchase the product or service
22 5.5 5.5 100.0
Total 400 100.0 100.0
The table 9 revealed that 30.5% participants that they ignore the advertising on YouTube with no react on the ad, 14.25% participants liked the ad after they saw the video, 13% participants are wrote a comments on the ads, 17.5% participants consider the product or service after they watched the ad, while 19.25% are trying to reach the product or the service after they saw the ad and 5.5% participants they purchase the product or service after they saw the video ad. Majority the participants do action on the advertising video.
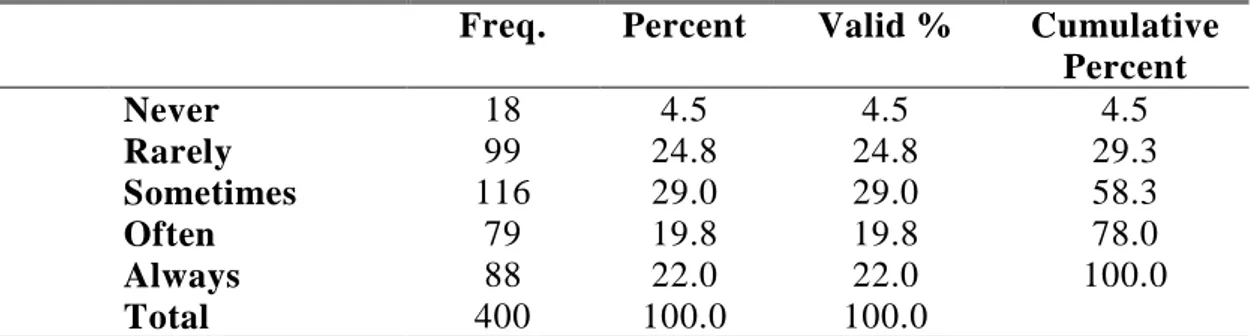
Table 4.10: Online advertising can easy create the brand image in my mind Freq. Percent Valid % Cumulative
Percent Never 18 4.5 4.5 4.5 Rarely 99 24.8 24.8 29.3 Sometimes 116 29.0 29.0 58.3 Often 79 19.8 19.8 78.0 Always 88 22.0 22.0 100.0 Total 400 100.0 100.0
The table 10 revealed that 4.5% participants that online advertising never create the brand image in their minds, 1.25% participants rarely, 29% participants are sometimes the ad create the brand image in their minds, 19.75% participants said often, while 22% participants said that online advertising always create the brand image in their minds. Majority is agree that the ads can create brand image in their mind
Table 4.11: Time (approx.) spent on social media sites per week (Hours). Freq. Percent Valid % Cumulative
Percent Under 1 25 6.3 6.3 6.3 1 to 3 103 25.8 25.8 32.0 4 to 6 97 24.3 24.3 56.3 7 to 9 99 24.8 24.8 81.0 10 + 76 19.0 19.0 100.0 Total 400 100.0 100.0
The table 11 shows time spending on social media of the respondents revealed that 6.25% respondents are spend under one hour weekly, 25.75% respondents are between 1 to 3 weekly, 24.25% respondents are spend between 4 to 6 hour weekly, 24.75% respondents are spend between 7 to 9 hour weekly and 19.75% respondents are spend more than 10 hour. Majority of respondents is spend less than 1 hour weekly.
Table 4.12: Online advertising helps me keep up-to date about products and services that I need.
Freq. Percent Valid % Cumulative Percent Strongly Disagree 17 4.3 4.3 4.3 Disagree 127 31.8 31.8 36.0 Neutral 97 24.3 24.3 60.3 Agree 75 18.8 18.8 79.0 Strongly Agree 84 21.0 21.0 100.0 Total 400 100.0 100.0
The table 12 revealed that 4.25% participants that strongly disagree about the online advertising helps them keep up-to date about products and services, 31.75% participants disagree, 24.25% participants are natural, 18.75% participants said agree, while 21% participants said that Online advertising helps them keep up-to date about products and services. Majority of participants said online advertising helps them keep up-to date about products and services.
Table 4.13: I always think about my favorite brand.
Freq. Percent Valid % Cumulative
Percent Strongly Disagree 67 16.8 16.8 16.8 Disagree 94 23.5 23.5 40.3 Neutral 134 33.5 33.5 73.8 Agree 58 14.5 14.5 88.3 Strongly Agree 47 11.8 11.8 100.0 Total 400 100.0 100.0
The table 13 revealed that 16.75% participants that strongly disagree about they always thinking about their favorite brand, 23.5% participants disagree, 33.5% participants are natural, 14.5% participants said agree, while 11.75% participants said they are strongly agree about they are always thinking about their favorite brand. Majority said they are not about they are always thinking about their favorite brand.
Table 4.14: I always use internet for entertainment such as Facebook, YouTube, Twitter and etc.
Freq. Percent Valid % Cumulative Percent Strongly Disagree 20 5.0 5.0 5.0 Disagree 38 9.5 9.5 14.5 Neutral 113 28.3 28.3 42.8 Agree 98 24.5 24.5 67.3 Strongly Agree 131 32.8 32.8 100.0 Total 400 100.0 100.0
The table 14 revealed that 5% participants that strongly disagree about they are using internet for entertainment such as Facebook, YouTube, Twitter and etc., 9.5% participants disagree, 28.25% participants are natural, 24.5% participants said agree, while 32.75% participants said they are strongly agree about they are using internet for entertainment such as Facebook, YouTube, Twitter and etc.
Table 4.15: The music of the video helps me to remember the advertisement Freq. Percent Valid % Cumulative
Percent Strongly Disagree 9 2.3 2.3 2.3 Disagree 108 27.0 27.0 29.3 Neutral 87 21.8 21.8 51.0 Agree 98 24.5 24.5 75.5 Strongly Agree 98 24.5 24.5 100.0 Total 400 100.0 100.0
The table 15 revealed that 2.25% participants that strongly disagree about that the music of the video helps them to remember the advertisement, 27% participants disagree, 21.75% participants are natural, 24.5% participants said agree, while 24.5% participants said the music of the video helps them to remember the advertisement. Majority of participants said the music of the video helps them to remember the advertisement.
Table 4.16: The tone of voice of the video helps me to remember the advertisement
Freq. Percent Valid % Cumulative Percent Strongly Disagree 68 17.0 17.0 17.0 Disagree 101 25.3 25.3 42.3 Neutral 99 24.8 24.8 67.0 Agree 77 19.3 19.3 86.3 Strongly Agree 55 13.8 13.8 100.0 Total 400 100.0 100.0
The table 16 revealed that 17% participants that strongly disagree about that the tone of voice of the video helps them to remember the advertisement, 25.25% participants disagree, 24.75% participants are natural, 19.25% participants said agree, while 13.75% participants said that the tone of voice of the video helps them to remember the advertisement. Majority of the participants said that the tone of voice of the video does not helps them to remember the advertisement.
Table 4.17: The actor’s physical appearance of the video helps me to remember the advertisement
Freq. Percent Valid % Cumulative Percent Strongly Disagree 12 3.0 3.0 3.0 Disagree 112 28.0 28.0 31.0 Neutral 113 28.3 28.3 59.3 Agree 81 20.3 20.3 79.5 Strongly Agree 82 20.5 20.5 100.0 Total 400 100.0 100.0
The table 17 revealed that 3% participants that strongly disagree about the actors physical appearance of the video helps them to remember the advertisement, 28% participants disagree, 28.25% participants are natural, 20.25% participants said agree, while 20.5% the actor’s physical appearance of the video helps them to remember the advertisement. The Majority said the actor’s physical appearance of the video do not helps them to remember the advertisement.
Table 4.18 : Online advertising can easy create the brand image in my mind. Freq. Percent Valid % Cumulative
Percent Strongly Disagree 24 6.0 6.0 6.0 Disagree 102 25.5 25.5 31.5 Neutral 104 26.0 26.0 57.5 Agree 81 20.3 20.3 77.8 Strongly Agree 89 22.3 22.3 100.0 Total 400 100.0 100.0
The table 17 revealed that 6% participants that strongly disagree about online advertising can easy create the brand image in their minds, 25.5% participants disagree, 26% participants are natural, 20.25% participants said agree, while 22.25% said that online advertising can easy create the brand image in their minds. The majority agree that online advertising can easy create the brand image in their minds.
Table 4.19: I always use internet for entertainment such as Facebook, YouTube, Twitter and etc.
Freq. Percent Valid % Cumulative Percent Strongly Disagree 14 3.5 3.5 3.5 Disagree 98 24.5 24.5 28.0 Neutral 117 29.3 29.3 57.3 Agree 82 20.5 20.5 77.8 Strongly Agree 89 22.3 22.3 100.0 Total 400 100.0 100.0
The table 19 revealed that 3.5% participants that strongly disagree about they are using internet for entertainment such as Facebook, YouTube, Twitter and etc., 24.5% participants disagree, 29.25% participants are natural, 20.5% participants said agree, while 22.25% participants said they are strongly agree about they are using internet for entertainment such as Facebook, YouTube, Twitter and etc.
Table 4.20: I always search for information or news on internet.
Freq. Percent Valid % Cumulative Percent Strongly Disagree 13 3.3 3.3 3.3 Disagree 79 19.8 19.8 23.0 Neutral 113 28.3 28.3 51.3 Agree 81 20.3 20.3 71.5 Strongly Agree 114 28.5 28.5 100.0 Total 400 100.0 100.0
The table 20 revealed that 3.25% participants that strongly disagree about they are always search for information or news on internet, 19.75% participants disagree, 28.25% participants are natural, 20.25% participants said agree, while 28.5% participants said they are always search for information or news on internet. Majority of participants said they are always search for information or news on internet.
Table 4.21: I am annoyed by the ads because the advertiser normally tried to make the ad appear to be a part of the video content.
Freq. Percent Valid % Cumulative Percent Strongly Disagree 55 13.8 13.8 13.8 Disagree 91 22.8 22.8 36.5 Neutral 101 25.3 25.3 61.8 Agree 123 30.8 30.8 92.5 Strongly Agree 30 7.5 7.5 100.0 Total 400 100.0 100.0
The table 21 revealed that 13.75% participants that strongly disagree about that they annoyed by the ads because the advertiser normally tried to make the ad appear to be a part of the video content, 22.75% participants disagree, 25.25% participants are natural, 30.75% participants said agree, while 7.5% participants said they are not annoyed by the ads because the advertiser normally tried to make the ad appear to be a part of the video content. Majority of participants are agreed
Table 4. 22: The music helps me to understand the advertisement message better.
Freq. Percent Valid % Cumulative Percent Strongly Disagree 14 3.5 3.5 3.5 Disagree 92 23.0 23.0 26.5 Neutral 125 31.3 31.3 57.8 Agree 74 18.5 18.5 76.3 Strongly Agree 95 23.8 23.8 100.0 Total 400 100.0 100.0
The table 22 revealed that 3.5% participants that strongly disagree about that the music helps them to understand the advertisement message better, 23% participants disagree, 31.25% participants are natural, 18.5% participants said
agree, while 23.75% participants said music helps them to understand the advertisement message better. Majority of participants said music helps them to understand the advertisement message better.
Table 4.23: The tone of voice helps me to understand the advertisement message better.
Freq. Percent Valid % Cumulative Percent Strongly Disagree 19 4.8 4.8 4.8 Disagree 95 23.8 23.8 28.5 Neutral 134 33.5 33.5 62.0 Agree 70 17.5 17.5 79.5 Strongly Agree 82 20.5 20.5 100.0 Total 400 100.0 100.0
The table 23 revealed that 4.75% participants that the tone of voice helps them to understand the advertisement message better, 23.75% participants disagree, 33.5% participants are natural, 17.5% participants said agree, while 20.5% participants said the tone of voice helps them to understand the advertisement message better. Majority of participants said the tone of voice helps them to understand the advertisement message better.
Table 4.24: The cues in the video helps me better understand
Freq. Percent Valid % Cumulative Percent The benefits of the
product/service 126 31.5 31.5 31.5 The brand 79 19.8 19.8 51.3 The message 166 41.5 41.5 92.8 What I have to do to purchase the product 29 7.3 7.3 100.0 Total 400 100.0 100.0
The table 24 revealed that 31.5% participants that The cues in the video helps me better understand the benefits of the product/service, 19.75% participants the brand, 41.5% participants are the video help them to understand the message, 7.25% participants the video help to know What I have to do to purchase the product . Majority of participants said the video help them to understand the message.
4.9 Reliability Test need review Table 4.25: Reliability Report
Cronbach's Alpha N of Items
.738 23
The survey was subjected to reliability test to know whether the questions are reliable for the study. However, the reliability report using Cronbach’s Alpha reported the value of 0.738 (73.8%) indicating that the questions have above 73.8% reliable in aiming at the objective of the study.
4.10 Descriptive Analysis
Table 4.26: Descriptive Statistics N Statistic Minimum Statistic Maximum Statistic Mean Statistic Std. Deviation Statistic Median Mode Age 400 1 7 4.37 .837 4 4 Gender 400 0 1 .79 .410 1 1 Education 400 1 7 3.71 1.535 4 4 Occupation 400 1 6 3.99 1.773 5 5 YouTube 400 0 1 .91 .290 1 1 Ignorance 400 1 5 2.88 1.315 3 3 Purpose 400 1 5 3.50 1.224 3 5 Deceive 400 1 5 2.99 1.393 3 3 React 400 1 6 2.97 1.676 3 1 Create 400 1 5 3.30 1.191 3 3 Time 400 1 5 3.25 1.208 3 2 Up-to-date 400 1 5 3.20 1.215 3 2 Favorite 400 1 5 2.81 1.220 3 3 Entertainment 400 1 5 3.70 1.165 4 5 Music 400 1 5 3.42 1.188 3 2 Tone 400 1 5 2.87 1.290 3 2 Actors 400 1 5 3.27 1.163 3 3 Brand image 400 1 5 3.27 1.232 3 3 Always 400 1 5 3.34 1.171 3 3 Information 400 1 5 3.51 1.189 3 5 Favorite brand 400 1 5 3.39 1.207 3 3 Annoyed 400 1 5 2.96 1.177 3 4 Music help 400 1 5 3.36 1.174 3 3 Tone helps 400 1 5 3.25 1.167 3 3 Cues 400 1 4 2.24 .981 2 3 Device 400 1 4 3.62 .799 4 4 Valid N (listwise) 400
Age regarding to the table 24 we can see that the median is 4 and mode is 4 which is mean that the majority participant’s age was between 27-30 years old. Gender: regarding to the table 24 we can see that the median is1 and the mode is 1 which is mean that the majority participant’s was male.