KADİR HAS UNIVERSITY
GRADUATE SCHOOL OF SCIENCE AND ENGINEERING
MINIMIZING THE DEFECT RATE USING SIX SIGMA DMAIC
METHOD; A CASE STUDY IN SUPSAN A.Ş.
MASTER THESIS
N. YAĞMUR ASLAN
N.Y AĞ MUR AS LA N Ma ster The sis 2016 S tudent’ s F ull Na me P h.D. (or M.S . or M.A .) The sis 20 11
MINIMIZING THE DEFECT RATE USING SIX SIGMA DMAIC
METHOD; A CASE STUDY IN SUPSAN A.Ş.
N.YAĞMUR ASLAN
Endüstri Mühendisliği Ana Bilim Dalı Programı’nda Yüksek Lisans derecesi için gerekli kısmi şartların yerine getirilmesi amacıyla
Fen Bilimleri Enstitüsü’ne teslim edilmiştir.
KADİR HAS ÜNİVERSİTESİ Mayıs, 2016
iii
TABLE OF CONTENTS
Özet vi Abstract viii Acknowledgements x Table List xiFigure List xii
Abbreviations xiv
1.Introduction 1
2.Six Sigma 3
2.1 Six Sigma Application Reasons………...5
2.2 Six Sigma History………….……….…....6
2.2.2 Six Sigma in Automobile Industries………...7
2.3.Comparison Analysis of Methods.. ………...8
2. 3.1 Kaizen………....8
2.3.2 Jidoka………...…….…………10
2. 3.3 BPR……….…….10
2. 3.4 Value Stream Transformation………..…...11
2.4.Why Six Sigma, DMAIC is chosen? 12
3.DMAIC 14 3.1 Tools of Phases……….…...17
3.2 DMAIC Roles………...18
3.2.1 Executive Sponsor………....18 3.2.2 Champion……….…...18 3.2.3 Master Black Belt………...19
3.2.4 Black Belt………...……19
iv 3.2.5 Green Belt………...20 3.2.6 Process Owners………...20 3.2.7 Project Sponsor……….…..….21 3.2.8 Yellow Belts……….…...21
3.2.9 Top Quality Council………...21
3.2.10 Management Representative………...21
3.2.11 Financial Representative………...22
3.3.Tools Of DMAIC……….…...22
3.3.1 The Affinity Diagram………...…...23
3.3.2 SIPOC Diagram……….……….…...…..23
3.3.3 Process Mapping………...24
3.3.4 Pareto Charts……….……...24
3.3.5 Experimental Design (DOE)………...………....25
3.3.6 Failure Mode Effects Analysis (FMEA)………..…...25
3.3.7 Process Control Plan………..………...26
3.3.8 Project Charter………...………...…..26
3.3.9 Brainstorming………..……….…...26
3.3.10 Cause and Effect Matrix………...27
3.3.11 Cause and Effect Diagram………...27
3.3.12 Statistical Process Control………...…...28
3.3.13 Gage R&R Studies………...28
3.3.14 Flow Diagram………...29
3.3.15 Run Chart……….…….…...29
3.3.16 Scatter Diagram……….….…..29
3.3.17 Control Charts………..30
v
3.3.19 Measurement System Analysis………...……...30
3.3.20 Multi-Vari Study………...…...…...31
3.3.21 Value Stream Mapping………...31
3.3.22 Analysis of Variance(ANOVA)………...31
3.3.23 Tree Diagrams………...32
3.3.24 Critical to Quality Tree………..…..…...32
3.4 DMAIC Literature Review 33
3.5.Literature Review of Defect Reduction with Six Sigma DMAIC Method 36
4.A Case Study in SUPSAN A.Ş. 44
4.1.Borusan Holding………...44
4.1.1 Borusan and Six Sigma………...45
4.2 SUPSAN A.Ş.………...47
4.2.1 What is valve?...48
4.2.2 Quality Policies of SUPSAN………...………..48
4.2.3 Valve Production in SUPSAN………...49
4.2.4 What is Stellite?...50
4.3 Research Questions………...51
4.4 .Implementation in SUPSAN A.Ş.………...52
4.4.1 Define Phase………...52
4.4.2 Measure Phase………..…...57
4.4.3 Analyse Phase………...70
4.4.4 Improve Phase………...82
4.4.5 Control Phase………...88
5. Benefit Calculation/Return Account 93
6.Conclusion 95
7.References 99
vi
ÖZET
6 SIGMA DMAIC METHODU KULLANARAK HATA YÜZDESİ AZALTIMI; SUPSAN’DA ÖRNEKOLAY ÇALIŞMASI
N.YAĞMUR ASLAN
Endüstri Mühendisliği Ana Bilim Dalı, Yüksek Lisans Danışman: Prof. Dr. Zeki AYAĞ
Mayıs, 2016
Günümüz üretim sanayileri hızlı değişen ekonomik koşulların büyük etkisi altındadır. Bu doğrultuda üretim sanayileri küreselleşme ile birlikte küresel rekabet ile karşı karşıya kalmaktadır. Bu sektörlerin önemli sorunları, azalan kar marjı, müşterilerinin yüksek kaliteli ürün istemesi ve ürün çeşitliliğidir. Bu yüzden birçok kuruluş özellikle üretim sektöründekiler, kalitenin önemini anlamıştır. Firmalar çeşitli stratejiler uygulamayı ve yenilikler ile üretim süreçlerini geliştirmeyi denemiştir. Bu alanda en güçlü felsefe 6 Sigmadır. 6 Sigmanın amacı; maliyeti, israfı azaltmak ve yüksek kalitede ürün üretebilmek için verimliliği arttırmaktır. Böylece, bu çalışma üretilen supaplarda kaliteyi geliştirmek, üretim israfını azaltmak ve üretim sürecindeki verimi arttırmak için 6 Sigma metodolojisi uygulanmıştır. DMAIC, Jidoka, Value Stream Transformation, Kaizen gibi yaklaşımlar arasında karşılaştırma analizi yapılmıştır. Sonuç olarak DMAIC bu proje için seçilmiştir. DMAIC yaklaşımı karlılığı arttırmaya yardım eden ve operasyonların verimliliğini arttırarak müşteri taleplerini karşılamaya yardım eden bir iş stratejisidir. Bu araştırmada, SUPSAN isimli üretim firmasında kalite ve verimlilik iyileştirilmesi tartışılmıştır. Ve bu çalışma SUPSAN da kalite performansını yükseltmek, Stellit kaplama sürecindeki hataların temel nedenlerini DMAIC araçları ile bulmakla ilgilidir. Pareto çizelgesi, FMEA, SIPOC, C&E Diyagramı gibi birçok araç temel hataları bulmak için ve durumu analiz etmek için kullanılmıştır. Geliştirme evresinde süreç kapabilite analizi ve uygulama planı yapılmıştır. Ayrıca geliştirme süreçleri uygulanmıştır. Sonrasında kontrol çizelgeleri AP PE ND IX C APPENDIX B
vii
ve istatistiksel süreç control analizi ile sonuçlar izlenmiş, belgelenmiş ve kontrol edilmiştir. SUPSAN’da 6 Sigma DMAIC metodolojisi uygulaması sonucunda fire oranı 4.34% den 2% ye azaltılmıştır.
viii
ABSTRACT
MINIMIZING THE DEFECT RATE USING SIX SIGMA DMAIC METHOD; A CASE STUDY IN SUPSAN A.Ş.
N.YAĞMUR ASLAN
Master of Science in Industrial Engineering Advisor: Prof. Dr. Zeki AYAĞ
Mayıs, 2016
Today manufacturing industries are highly impacted by the fast changing economic conditions. In this scenario, manufacturing industries become face to face with global competition due to globalization. The major problems of these industries are declining profit margin, customer demand for high quality product and product variety. Therefore so many organizations, especially in manufacturing sector, understand the importance of quality. Companies try to implement various strategies and innovations for enhancing their producing process. A very powerful philosophy in this area is Six Sigma. The aim of Six Sigma is to reduce cost, waste and increase productivity to produce high-quality products. So this study is applied to improve the quality of the manufactured valves, reduce the manufacturing waste and increase the yield of the manufacturing process by applying the Six Sigma methodology. Also comparison analysis is made between approaches as DMAIC, Jidoka, Value Stream Tranformation, Kaizen. In result of the analysis DMAIC is chosen for this project. DMAIC approach is a business strategy help to improve business profitability and efficiency of operations to meet customer needs and expectations.
In this search discusses the quality and productivity improvement in an manufacturing enterprise which is called SUPSAN. And this search deals with an application of Six Sigma DMAIC methodology in SUPSAN to improve quality performance, to identify root causes of failure in Stellite Coating Process which is found with help of DMAIC APPENDIX B AP PE ND IX C
ix
tools. Several tools are used to identify root causes and situation analysed with help of Pareto Charts, FMEA, SIPOC, C&E Diagram. In improve phase Process Capability Analysis and Implementation Plan are made. Also improvement solutions are applied. Then with the help of tools as Control Charts, SPC Analysis results tracked, documented and controlled.In SUPSAN, the appliation of Six Sigma DMAIC methodology resulted in a reduction in the defect rate from 4.34% to 2%.
x
ACKNOWLEDGEMENTS
Foremost, I would like to express my sincere gratitude to my advisor Prof. Dr. Zeki AYAĞ for the continuous support of this study and research, for his patience, motivation, enthusiasm, and immense knowledge. His guidance helped me in all the time of research and writing of this thesis.
Second, I would like to thank Prof. Dr. Cengiz KAHRAMAN for encouragements, valuable time, advice, comments and all the helping hand provided towards the successful completion of this thesis.
I especially thank my parents and all of my friends who have gave their support and encouragement, otherwise, I could not have completed this much volume of study.
AP PE ND IX C AP PE ND IX C
xi
Table List
Table 12.1: Project Report-rvz00………53
Table 12.2: Project Calender………...………...54
Table 12.3: Communication Plan…………..………...54
Table 12.4: 6 Sigma Risk Action Plan-rvz00………..…...…..55
Table 12.5: SIPOC Diagram……….………..……...58
Table 12.6: 6 Sigma Risk Action Plan-rvz001………...60
Table 12.7: Stakeholder Management Plan………...61
Table 12.8: Measurement Plan………...………...68
Table 12.9: Measurement Plan-continue………..69
Table 12.10: Critic Indicator………...….70
Table 12.11: C&E Diagram………...71
Table 12.12: 38738 Analysis of Burr Direction………...….…78
Table 12.13: Solution Evaluation Matrix………...83
Table 12.14: Implementation Plan………...………….87
Table 12.15: Failure mode and Effects Analysis……….….87
Table 12.16: Six Sigma Risk Action Plan-rvz02……….…….88
Table 12.17: Process Control System of Stellite Defects………...….92
Table 12.18: Benefit/Return Tracking………..…...92
Table 12.19: Project Report-rvz01………94
xii
Figure List
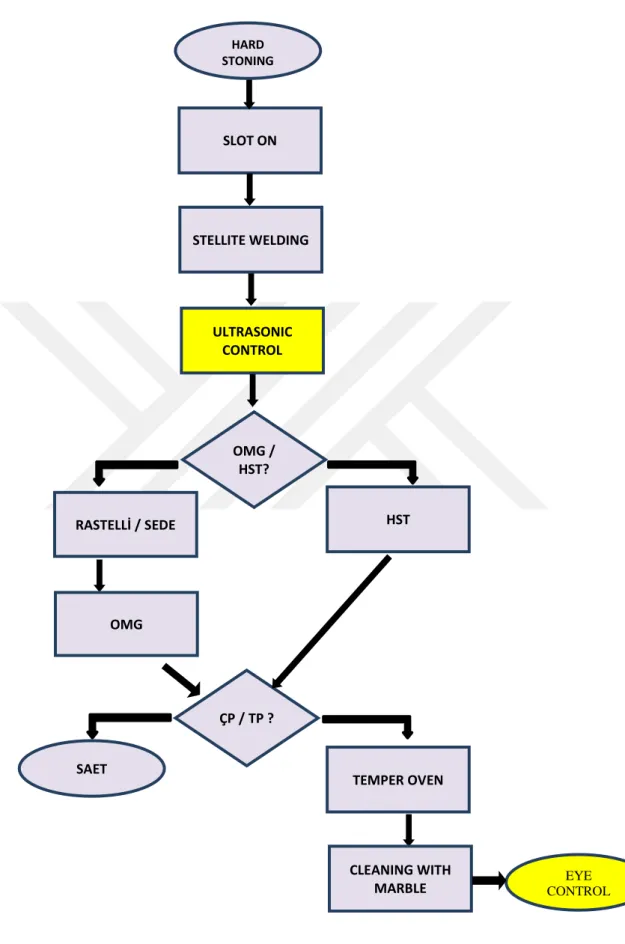
Figure 12.1: Process Map………...….…....59
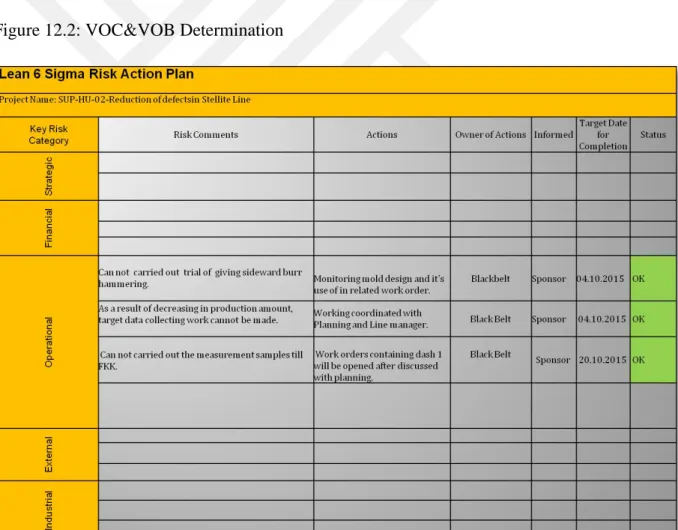
Figure 12.2: VOC&VOB Determination………....60
Figure 12.3: Defect Rates on Daily Basis………...…....62
Figure 12.4: Defect Rates………...…...63
Figure 12.5: First Four Defect Types………..………...64
Figure 12.6: Defected Valves………...65
Figure 12.7: Distribution of Defect Types………...…....66
Figure 12.8: Defect Rates According to Work Order Amount………...67
Figure 12.9: Discarded at Line-Discarded at FKK Defect Rates………….………...67
Figure 12.10: Defect Comparison of Extrusion-Upset………...…....68
Figure 12.11: Effect of Overhead Secretion……….…...72
Figure 12.12: Valve 39344……….……...72
Figure 12.13: Overhead Process Capability of Rectification of Valve 39344………...73
Figure 12.14: Valve 37359………...73
Figure 12.15: Overhead Process Capability of Rectification of Valve 37359 ……...74
Figure 12.16: Effect of Bottomneck Thickness of Valve 38737………...74
Figure 12.17: Sample of Lefted Burr………...75
Figure 12.18: Sample of Deep-Taken Burr……….………75
Figure 12.19: Effect of Burr of Valve 38737………...…...75
Figure 12.20: Effect of Burr of Valve 39876………..76
Figure 12.21: Effect of PTA Process of PTA 38737………...…..…..76
Figure 12.22: Effect of PTA Plate of Valve 38737………..….…..77
xiii
Figure 12.24: Defect Rates between PTA Stalls……….….78
Figure 12.25: Effect of Burr Direction of Valve 38738………... ..79
Figure 12.26: Technical Drawing of Valve………... .85
Figure 12.27: Sideward Burr Hammering of Valve 38737 Regime Entry Pieces….…..89
Figure 12.28: Vertically Burr Hammering of Valve 40239 Regime Entry Pieces…...89
Figure 12.29: Process Bottomneck Thickness Capability of Valve 40215…………...90
Figure 12.30: Process Bottomneck Thickness Capability of Valve 40215…………...90
xiv
ABBREVIATIONS
C&E Diagrams: Cause and Effect Diagrams
SPC Analysis: Statistical Process Control
PCA: Process Capability Analysis ANOVA: Analysis of Variance
DMAIC: Define-Measure-Analyse- Improve-Control FMEA: Failure Modes and Effects Analysis
SIPOC: Supplier-Input-Process-Output-Customer VOC: Voice of Customer
VOB: Voice of Business
CCR: Critical Customer Requirement CBR: Critical Business Requirement BRM: Business Risk Management AHP: Analytic Hierarchy Process VST: Value Stream Transformation DOE: Design Of Experiment
1
1. INTRODUCTION
In today’s world, business is more competitive. All industries and organisations have to themselves survive and be profitable in industry. SUPSAN, engine parts manufacturing company, studied in this thesis for helping company to maintain the quality of its products, to help meet with company’s customers needs. Therefore, SUPSAN will effectively compete in the market. SUPSAN aims to improve quality for creating competitive strategic advantage. This thesis investigates quality issues for finding best method to implement in SUPSAN and provides a solution to reduce defects. In order to accomplish this, most effective and suitable quality methodologies are chosen. So Six Sigma DMAIC is followed in this search to reduce defects in company. Today, Six Sigma has a great interest for manufacturers in the world. It is because this principle affects companies of all sizes. Companies apply Six Sigma technologies and see dramatic improvements in quality, production, customer service, and profitability.
DMAIC approach is used to reduce the number of defects in the stellite line, improve customer satisfaction and profitability. In industry, nonconforming products cause unsatisfied customers. This is why company needs to pay attention to detail of the product through a stellite line in valve production. Whether the process is producing defective parts or scrap, company will certainly have higher operating costs due to the need to reproduce or rework product. This thesis provides systematic approach by using the Six Sigma methodology to assess the application of Six Sigma and its techniques. Aim of this thesis is to show how to apply Six Sigma methodology in a manufacturing problem. Besides, company should to adopt a process improvement method, so Six Sigma is one of the best tools to improve quality of products by reducing defect in manufacturing. In this thesis, SUPSAN company valve manufacturing part is aimed to find out strategy for developed solutions to reduce product defect by using DMAIC approach from Six Sigma method.
2
From February 2015 to the middle of August, 53.755 pieces of defects threw from within the 1.237.468 valves which is produced in Stellite line and percentage of defect materialized as %4.34. In this process, defect cost is 102.134$. This situation block the sending intended products to stated lines and causes problems as additional labor, traceability. VOB, make a demand the enhancement of situation that create extra cost due to high ratio of defect in related line. Percentage of defect of Stellite Line in last 6.5 months amounted %4.34 at 2015, daily 9.000 pieces and yearly 2.565.000 pieces of valve production envisioned. Unless making an enhanement in process, production will have same defect ratio and 2.565.000 pieces of valves 111.321 pieces of it will be defect. Cost of defect will be 211.510$. With this project, defect ratio withdraw to the target valve level %2 defect goal will cause reduce %53 of wastes becauseof this helps to gain 91.386$ return. Also project will support the SUPSAN in achieving their general defect goals.
3
2.SIX SIGMA
In 1980 Six Sigma is developed by Motorola in companies. Today, it is the most popular management methodology. The objective of Six Sigma is improving the quality of process by identifying and removing the defects.
The goal is to increase level of performance which reflects the customer needs. Achieving a Six Sigma level means that less than 3.4 ppm. Hence, Six Sigma is seen as a problem solving approach with help of tools to improve process.
Six Sigma is a disciplined, statistical method that aimed to increase profitability by reducing defects. The foundation logic and approach is “DMAIC” which has phases as; Define, Measure, Analyze, Improve and Control. Six Sigma has a variety of tools available to reduce defects and improve quality.
The improvement tools used in Six Sigma processes to measure, gather data to track progress. Six Sigma provides high quality, low cost, customer-defined value, a never-ending stream of efforts for eliminating waste and nonvalue-added activities, relentless improvement. After Motorola such companies used this methodology too as ABB, Allied Signal, General Electric (GE), DuPont, Nokia and Toyota.
Six Sigma systems improve customer satisfaction, quality, speed of process and expand knowledge of product and processes. Six Sigma philosophy states that defects can be eliminated by reducing variations as improved customer needs, reduced operating costs and increased profitability.
In addition, it is a problem identification technique. 6 Sigma has tools to define process and make statistical analysis. It improves quality and minimizes defects. 6 Sigma is a business strategy for reducing process variability, minimizing defects. Key factors of 6 Sigma projects are; management involvement, commitment, progress tracking and monitoring, training and teamwork and Project selection and its link to business. Cost of poor quality, tool expenses, labour expenses, production
4
time, index cost, volume, production time, control time, material and internal scraps reduced with help of Six Sigma and so annual benefits increased.
In conclusion, Motorola developed and implemented Six Sigma to achieve perfection in manufacturing and to sustain competitive advantage. Six Sigma uses statistical methodologies as Business Process Engineering, Kaizen, Dmaic, Value Stream Mapping, jidoka and techniques to solve problems of production process. Six Sigma is an zero defect approach. First of all, Six Sigma aims to identify avoiding defects, besides it helps to decrease operating cost and increase customer satisfaction by reducing defect, linking to business strategy. Six Sigma focus on customer needs, waste prevention, cost saving and cycle time reduction and it eliminates costs.
5
2.1 Six Sigma Application Reasons
1-To focus on continuous improvement and innovation for meeting customer expectations so 6 Sigma can ensure this.
2- It is possible with 6 Sigma to apply approaches which adoptable most quickly to technologic changes in product and production systems.
3- 6 Sigma ensures success to adobt to changing global conditions with help of continuous innovations.
4- Allow to achieve the goal to provide products that meet customer needs and expectation for anyone working in the business and services.
5- Six Sigma is able to providee to accelerate, production and sharing of new ideas. 6- Six sigma can make strategic changes easily which better understands and evaluate company processes and entire operating systems.
6 Sigma program basically can be useful to companies seeking solutions to issues in 3 different levels, as follows;
-A need of transformation which creates fundamental change in the style of the organization’s work.
-Strategic improvements which targeted basic strategic or operational weaknesses or opportunities.
-Ensure help to subjects as problem solving or resolve issues as high cost, repetitive tasks and delays.
6
2.2 Six Sigma History
Quality management developed with conceptual foundations but it continued to grow as a strategic process improvement. It begins with Motorola in the 1980s, many companies as GE, Honeywell, Sony etc. adopted Six Sigma. 6 Sigma uses quantitative and critical quality metrics for continuous improvement and to measure defects.
Motorola developed Six Sigma in 1985 with aim of 3.4 defects in million. In 1994 Six Sigma produces better results and improve processes.
In 1995 General Electric began to implement Six Sigma. Lots of studies are made about Six Sigma as it is a data-driven approach to analyze causes of problems and solves them by ensuring performance. 6 Sigma is a business process that improve and monitor business activities by minimizing waste and increasing customer satisfaction.
The first generation of Six Sigma between1987 and 1994 had focused reducing of defects and Motorola saw success of it.
The second generation of Six Sigma between 1994 and 2000 had concentrated on cost reduction. Therefore companies as General Electric, Du Pont and Honeywell adopted it to their organizations.
The third generation of Six Sigma created value to customers and the enterprises. By this way, its application can be founded within the companies as Posco and Samsung. This processes give importance to delivery times, customer waiting time and inventory service levels.
Six Sigma application of in service sector and manufacturing sector grew. Besides, in the manufacturing sectors automatic data collection started to be used especially in assembly lines and to measure impact of the quality became more easier. As a result of this innovation, large organisations introduced Six Sigma in their manufacturing facilities.
7
2.2.1 Six Sigma In Automobile Industries
“Dr. Rajeshkumar U. Sambhe (2012) this case study focused on mid-sized auto ancillary unit. The Six Sigma approach reduced defects level and implementation caused a financal hit on the bottom-line of the enterprise” [1].
“J Antony, M Kumar, and M K Tiwari (2005) this study was Six Sigma based methodology to eliminate an engine-overheating problem in an automative company. The aim was to reduce process variation and high defect rate. The process capability increased from 0.49 to 1.28 and the financial impact saved over $US110.000 per annum” [2].
“Rajeshkumar U.Sambhe and Dr. Rajendra S. Dalu (2011) used Six Sigma to implement in medium scale Indian automotive enterprises. The survey is used. Study found that 25.64% of medium scale automobile sector has implemented Six Sigma. S.Suresh, A.L.Moe and A.B.Abu (2015) applied DMAIC methodology reduce defects in manufacturing of automobile piston ring. The rejection percentage reduced to 13.2% from the existing 38.1%” [3].
“S.N.Teli, Dr.V.S.Majali, Dr.U.M.Bhushi, Sanjay Patil (2012), 6 Sigma tools reduce the cost of quality for automobile industry. DMAIC approach discussed with its advantages. Research is presented about Reduction in Exhaust Pipes&Silencer Failures. In addition, use of Six Sigma concept helps to keep quality controlled to avoid unnecessary downsizing of one’s overall profits” [4].
8
2.3.Comparison Analysis of Methods
There are many other valuable methods that should be used in defect reduction projects. Many methods depend on the size and industry of the company. These methods as follow;
Six Sigma, DMAIC; this method has data based conclusions. DMAIC process includes defining project, identifying root causes and finalizing the improvements. It ensures long lasting solutions, flexibility in timing and quality training. Also this approach is so beneficial for corporate organizations. Especially in big companies, it identifies the problems easily and it is used to adress this problem with great efficiency. Dmaic method is reliable and extremely result oriented as well and has huge pool of satisfied clients. This method helps workers to carry out the job to solve potential problems. Thus, they become more aware of the process. 6 Sigma also has customer focus, employee involvement, continuous improvement. In addition, Six Sigma increases cash flow, improves knowledge on tools and tehniques, reduces variability in process performance, product capability and reliability. It ensures new customer opportunities and improves market position.
2.3.1 Kaizen
Kaizen is a methodology that identifies the opportunities for continuous improvement in a short period of time. Also Kaizen is a team-based improvement. It selects and organizes team members and informs them about steps and possible outcome. Besides Kaizen has sense of urgency, immediate resource availability and it gives immediate results.
Kaizen; is a Japanese workplace philosophy that focuses on making continuous improvements. It means continuous improvement that involves everyone in the organization and it is also customer-driven strategy. This scientific approach uses statistical quality control and adoptive to organazitional values and beliefs which
9
focus on zero defects. So Kaizen emphasises on problem awareness and identifying problems.
Kaizen has advantages; it encourages the development self managing groups, consolidates team-working. It also helps leads understanding to change and helps to recognise employee efforts. On the other hand Kaizen has disadvantages as, permanent change of management system. Hard to return to previous management systems, difficult to apply to other cultural contexts and it increases the burden or lower level management. Also they have to work after hours to compute administative tools in the implementation of the method. It concentrates attention process and activities are centired. It is an approach for active problem solving. Kaizen gives employees a sense of purpose, it eliminates the need for inspection and helps to breakdown departmental barriers. It focuses on improvement is returned to the needs for the customer.
Kaizen; while there are advantages of using Kaizen and there are some limitations that worth to be aware of before deciding to implement to company. Kaizen is necessary for companies to undergo a complete reset of their tactics and approach on the other hand it can be difficult and cause problems to the business if they are not ready to do so. It is necessary for companies to be open to change so employees speak up easily. Kaizen can not have success for a while, hence the long term goals must clearly be understood by those involved. Some companies should bring a change in their style of functioning and mind set but sometimes this is difficult and initial problems created can be very bad for business overall. Also the initial excitement around using a new management style dies down all too soon. As a result; companies are not able to get the results they are expecting.
Kaizen is a rapid choice it emphasizes creativity before capital. In this approach, a cross functional team improve the process or problem within specific area. Team meets full time for 3 to 5 days and study rapidly phases as training, discovery, analysis, assessment, brainstorming, implementation. Specialized on training that is about setup reduction methodology and defect prevention. And team takes a guided tour to understand basic process flow, products produced, machines used. Team gathers datas from current situation, demand, defect history, downtime history etc. In last, team implements prioritized ideas. Kaizen; it is process centered and able to identify what is going wrong and reduces defects and reduces waste of resources.
10
2.3.2 Jidoka
This method is human integrated automation and it aims to find machine detects and stop immediately preventing producing bad product. The principle of this method is to stop and respond to every abnormality and it can be applied to all processes. It detects the abnormality, stops, fixs or corrects the immediate condition, investigate the root cause and install a counter measure are steps of Jidoka. An organization need Jidoka because JIT can’t run smoothlity and effectively without Jidoka. Jidoka, adds human judgment, minimizes poor quality, gives the employee responsibility. Also it prevents equipment breakdown and ensures high quality products, improves productivity.
2.3.3 Business Process Engineering
BPR is invented in the early 1990s. It focuses on the analysis and design of workflows in the company. BPR aims to help to rethink how company do its work in order to improve customer service, decrease operational costs, and become world-class competitors. Re-engineering focuses on business objectives, encourages full-scale recreation of processes. It increases effectiveness, all processes are monitored under the control of the management. It reduces cost, improves efficiency and ensures quick delivery of products to the buyers. BPR also help to growth of business. On the other hand it has disadvantages as, its implementation is very difficult. Employees are very resistant to this kind of change therefore, it is important to have support from the top management. Also it can not be appropriate for all processes for all organisations. The core-business processes designed to satisfy customer needs.
11
2.3.4 Value Stream Transformation
A Value Stream Transformation begins with a realisation of there is a need for change and it continues with a detailed Value Stream Analysis and the implementation of a planned future state. Advantages of VST; reduction of the time for the process from beginning to completion, increases productivity, increases process reliability by removing errors and inconsistent quality. It gives a clearer picture of processes involved in a work flow. It helps to identify waste and its sources and where change is required. VSM brings standardisation to process also it helps identify potential problems and help to make organizations more efficient by improving their processes.
Key stages; to make trainings to understand strategy, tools and techniques in the organisation, coaching value stream managers, development of metrics to create value, eliminate waste and enhance customer service and company performance. On the other hand disadvantages of VST are; It does not include any significant monetary measure for value. It has responsibility of the stakeholder to determine which activity can be termed. VST fails to handle multiple products that do not have identical maps, transportation and quening delays.
In this search, all methods examined and Six Sigma DMAIC method selected to use in this company to help defect reduction in Stelllite Line. In recent years, implementation of Six Sigma became a source of competitive advantage within the businesses. Because its properties are more useful for process in this company.So we applied it to the line that causes defects.
12
2.4 WHY SIX SIGMA, DMAIC IS CHOSEN?
Six Sigma become a key of knowledge-based businesses and it guides companies to achieve specific goals and objectives.
After making a comparison analysis between each methods, Six Sigma, DMAIC method is choosed to implement target production line. Six Sigma found as the most suitable approach for the line conditions. It is different from other quality efforts because it targets higher standards of quality and lower defects, related to the customer needs. In any organization it is important to create a culture that allows employees to feel connected to their work environment, Six Sigma method ensure this. The culture that follows Six Sigma differs from that of any traditional business mentality in many ways as pulling on the key concept of continuous improvement while achieving financial goals. Six Sigma creates a culture of continuous improvement and it is a combination of changing the way of work by changing processes. Six Sigma enables workers to not only attain new tools for solving problems, but also it creates new approaches to problem solving all together by examining a process in a very methodical fashion. Six Sigma culture allows to collect input from all different facets of the organization, including bottom-up suggestions from project leaders and team members. Besides the team members should have with different skill sets to allow for the best possible brainstorming sessions and innovative solutions. Six Sigma allows employees to work by interacting with the managers where the improvement work needs to happen. The main advantage of DMAIC is to help project management. Unlike other quantitative techniques of Six Sigma, DMAIC is easy to follow for all members of the project team. In the Six Sigma implementation, DMAIC method helps to integrate human aspects as culture change, helps to make training, it focuses on customer.
Six Sigma projects use the DMAIC process to improve quality by reducing defects and makes by decisions analyzing related to amount of data. For example, a Six Sigma/DMAIC Project would be the best approach if your goal is defect reduction or reduction of cost in the organization as in this thesis.
13
Benefits of Six Sigma; improves quality, ensures lower cost, maximizes invested capital, helps to company have market share in the competitive global markets. Hence global competitiveness is almost impossible without Six Sigma. Every company would benefit by adopting Six Sigma concepts and philosophy. In addition, profitability improves to all workforces in every department of the corporation.
Also it helps to reduce operational costs. Six Sigma has benefits from implementing 6 Sigma interms of cost savings, enhancement of productivity and improvement of process. Behind the 6 Sigma philosophy, there is a fundamental plan to monitor process continuously and aim to eliminate wastes from manufacturing process.
DMAIC is the best way for improving work process to eliminate the defect rates in the final product. Six Sigma, DMAIC projects increase performance of the company, make enhancement in customer satisfaction. It improves quality by analyzing data. As a business improvement DMAIC strategy, improves profitability by reducing defects and efficiency to meet customer-focused program, helps to identify improvement opportunities, defines and solves problems and establishes measures to sustain the improvement.
In conclusion, Six Sigma provides tools to improve services and increases quality. It is known as important way for improving competitive advantages to reach quality excellence. Six Sigma should be choosen to implement this Project because it has lots of advantages besides other methods. The elimination of waste costs means more profit. In addition, Six Sigma generates long-term success because it involves a cultural change.
14
3. DMAIC
In the late 1980s, DMAIC was introduced by Motorola. Since then, DMAIC has become the essential component for Six Sigma that aim to improve processes. DMAIC is a well-known methodology for problem-solving. DMAIC reduces defects, reduces cost and time. Also, DMAIC identifies requirements and tools for a project team to utilize. The DMAIC methodology is fundamental to 6 Sigma process improvement projects.
DMAIC has five phases; define, measure, analyse, improve and control. The simplified definitions of each phase are;
Define phase; help to select right project and identify scope,aim. Measure phase; gather datas and parameters.
Analyse phase; identifies potential causes and processes.
Improve phase; changes the current process is enhanced and performance of the process is increased.
Control phase; monitor and track new process.
The detailed version of process steps are;
Define phase; define the purpose, scope, objectives, define resources of the project. It includes project charter and describes Voice of Customer (VOC), defines Voice of Business (VOB), understands the current process. It identifies problem statement/opportunity and goal statement. Develops high-level process map, gather business requirements, develops communication plan and finalizes project charter. Also this phase identifies business financial drivers and determines critical-to-quality processes, defines project issues. This phase include selecting project, identifying process parameter input, establishing process flowchart, setting boundaries of process, selecting fully trained project team members, establishing execution plan. After determining what needs to be accomplished, resources and milestones put in place in order for the completion of these steps. These steps are located within the
15
goals and objectives, milestones and the roles and responsibilities sections of the team charter. After illustration of team charter, the process should be mapped out. Once completed, the process map provides a great visual for the duration of the project and also helps to more specifically identify the customer’s needs and requirements in relation to the specific process being improved. A clear statement of the project will be written, a basic timeline will be created, and a business case will be developed. In conclusion, this step starts with problem identification. The goal of the project and resources should have to be defined. This phase helps to understand the needs of the customers, defines the goal statement.
Measure phase; helps to identify, summarize and gather datas from what source and develops a plan to gather it. This usually involves utilization of graphical tools. The tools of this stage are flow charts, SPC tools, pareto analysis and run charts. This phase measures the problem, determines if the process in control and if measurement system is accurate. Measure phase determines current process performance. Measurement objectives; developing and defining key process measures and clarifying aim, identifying processes that have the huge impact on the project, collecting and analyzing data, measuring performance. The main purpose of the measure stage is the focus on improvement effort by gathering the proper information or data that is being produced in the process. Usually flowcharts and histograms are used in the process and the graphs, charts help to identify problems within the process. Pareto charts may also help team to display the relative importance of specific problems. Process Sigma can be calculated to describe the capacity of the current process. The failure modes with higher RPN should be solved first. Measure phase focuses on ensures the data needed is available and accurate. In conclusion measure phase; determines how the process currently performs, looks for cause of problem, creates a plan to collect the data.
Analyze phase; validates the root causes of problems and determines if the process capable of producing the customer requirements. The Analyze phase steps are; establishing process capability, defining performance goals and identifying the sources of variation. The aim of this stage is to determine and validate the root causation of our original problem. The next step is to organize these potential causes
16
using tools such as fishbone diagrams. A simple way of analyzing the data and creating a good visual for root cause is frequency distribution checklist. Fishbone diagrams can be used to take the raw data and analyze root causes. Run charts is another key element in the analyze stage that monitors the performance of processes to detect trends, shifts, or cycles. This information allows teams to focus attention on changes in the process, enables the most beneficial solutions to be created for the next stage. Knowledge that is gained in the analyse phase is used to develop solutions and improvements in the improve phase.
The improvement phase; DOE can help to optimize the process for reaching financial goals. The performance can be improved and financial goal is reached by implementing brainstorm solutions and prioritize them related to customer needs and make a selection between them, then and test to see if the solution resolves the problem. During this step, ideas and solutions are put to work. There must be checks for results to find best solution. Improve phase help to develop ımprovements for main causes, develops evaluation criteria. Also it measures results, develops detailed future process map of improvement and updates project plan. Certain charts may be used to compare before and after results of the implementation. Some of those charts include histograms, Pareto, and the many different control charts. Run charts provide a glimpse of whether or not a solution has a real or lasting effect on the process. In conclusion improve phase; brainstorms solutions that might fix the problem, selects the practical solutions, develops maps of processes based on different solutions, selects the best solutions, implements the solutions, measures improvement.
Control phase; at the final phase the stability and reliability of the process is controlled and the final capability is determined. It requires revision and a control plan to monitor ongoing performance. This phase; demonstrates how the improvements can be sustained, manages risks, documents new measurement process, defines control plan, documents recommendation or improvement summary and highlight changes. The final step of the DMAIC methodology monitors ongoing measures and actions to sustain improvement. Control phase assess proposed solutions and make controls to ensure the desired results and prevent future defects and problems. Critical inputs set under control and process outputs monitored.
17
Outputs of the contol phase; analysis of data before and after, well monitored system, completed documentation of process results.
In conclusion control phase; ensures continuous improvement in the process, monitors process and applies new knowledge to other processes in organization.
3.1 Tools Of Phases
Define Tools; Project charter, VOC tools, process map.
Measure Tools; Measurement system analysis, exploratory data analysis, descriptive statistics, pareto analysis, data collection plan, check/data sheet, histograms, process capability.
Analyze Tools; cause and effect diagrams, tree diagram, brainstorming, SPC, process maps, DOE, FMEA. Several tools are used to determine root causes of the defects as the affinity diagram, brainstorming, data collection, flow diagrams, pareto charts, tree diagrams or statistical process control, process maps and simulation. These tools calculate the amount of variation and helps to determine which inputs are the most important for the overall performance.
Improve Tools; project planning and management tools, brainstorming, data-collection forms, flow diagrams, frequency plots, FMEA, planning tools, Pareto charts, prioritization matrix, process capability, stakeholder analysis. Also simulation analysis, DOE, tolerance analysis can be used. FMEA and pilot plan can develop the solution of problems in the process too.
Control Tools; SPC, FMEA, ISO900, change budgets, cost estimating models, reporting system and benefits tracking. Some of the tools used in the control phase include control charts, data-collection forms, flow diagrams, quality-control process charts, sampling, statistical process control, reporting systems, process control plan, pareto chart and process capability.
18
3.2 Dmaic Roles
3.2.1 Executive Sponsor
The executive sponsor communicates, leads and directs the company’s overall objectives toward successful and profitable Six Sigma implementation. The sponsor supports the team and the program in every step. Thus, the executive sponsor needs to be involved in project selection. Also ensures the projects required resources.
3.2.2 Champion
The champion is part of executive members of the company. Champion should have managerial and technical skills to reinforce, to make plan, to allocate resources, and provide the necessary tools. Champions make improvement plan and charter of the projects, identifies teams required to facilitate 6Sigma deployment, determines goals, directs projects, identifies and removes barriers, monitors and reports Six Sigma progress, validates project results. Champions train green belts and black belts. Champions; who are committed to six sigma success and they are informal leaders of six sigma in their day-to-day work. Champion; fix the scope of projects, confirm changes and give directions about scope and aim of project, find sources for project, represent top quality council, work with process owners to finish project without obstacles.
19
3.2.3 Master Black Belt
Master Black Belts are technical leader who support data analyzes and trains green belts and black belts. They also help the champion on project selection. Master Black Belt has technical knowledge in Six Sigma and managerial skills. MMB has knowledge about statistical analysis. This professional has highest level of technical profiency in applying. They work with process owners to reduce defects, track progress and improve quality. Master black belts collaborates with champions, helps to define project, supports Black Belts at project works, joins project investigations to give technical consulting. Master black belt; they have highest level of technical and organizational proficiency. They have additional skills to success six sigma program as deep understanding of mathematical theory of statistical methods. MBB must processes excellent communication and teaching skills. Master Black Belts; communicate with Project sponsor and top quality council, make program for project, eliminates inability to cooperate, predict potensials and control results, collect data and analyze them about team workers.
3.2.4 Black Belt
The BB should have leadership and communication skills. They coach Green Belts in accomplishing their projects. Black Belt has technical problem-solving skills help achieving strategic objectives and improve bottom-line performance. Also they explain the basic tools. Training of the black belt completes in a six months period of time. In addition Black belts determine project boundaries, directs the team to verify the projects, reports progress to leaders, help champions if it is necessary, determine active tools in implementation. Black belt; they are actively involved in the process of organizational change and development. Their proficient involves use of advanced statistical analysis software pachages too. Black Belts; clarify the Project logic with sponsor, create and update the Project report and improvement plan, choose Project
20
team, search and define sources, help the use of 6 sigma tools and management techniques, help to ensure improvement of Project programs and control it, work with process owners and department manager and help to make easy finding new solutions for in progress applications.
3.2.5 Green Belt
They involve with 6Sigma projects before obtaining the certification. Statistical tools are available in Minitab software for training. Green Belts are trained in the use of Six Sigma methodology and tools. The number of projects per year is around two to three, because green belts work only part time on their projects. Green belts; provide a supporting role on improvement projects. They are able to forming and facilitating six sigma teams and manage projects. Green Belts; help to restoration of process and carry the improvement activities out personally, know basic analysis and measurements besides make analysis easily with the help of software, take 2 weeks training, green belts involve part time to projects.
3.2.6 Process Owners
They are responsible for the processes related to objective of project. It is important help to ensure sustained gains.
21
3.2.7 Project Sponsor
Sponsor is ultimately responsible of project success, assures adequate resources of project. Sponsors are owner of processes and they coordinate six sigma improvement activities.
3.2.8 Yellow Belts
All of the employees work for Project, take introducing education of Six sigma, join in suitable projects and contribute to continuous improvement.
3.2.9 Top Quality Council
Within 6Sigma, determine roles and create infrastructure of it, choose projects and find sources, evaluate progress in projects, give idea and support, support 6 Sigma projects as “sponsor”, determine the company’s net profit from 6 sigma efforts, find weaknesses and strong parts of work and evaluate progress, share best application examples of projects with employees and if it is necessary with supplier and customer, eliminate barriers which is reported by team.
3.2.10 Management Representative
Prepare 6 sigma education plans and track it, if it is necessary, take help from educational institutiens and consulting firms, answer demands of institutients which need help about 6 Sigma, help to quality champion in selecting project and occuring teams, confirm teams which is designated for projects, evaluate needs of teams and
22
supply them, support in every subject to quality champion, track all restoration projects and report them to champions.
3.2.11Financial Representative
Determine how will project cost and return calculated, supervises the benefits of the Project, financial representative should be independent from project team.
3.3 Tools Of Dmaic
Methods, Tools & Techniques are important to the success of any Six Sigma, DMAIC. Every stage of a Six Sigma project requires these tools & techniques. Six Sigma and its tools have created an impact in the operations of many companies. Six Sigma tools can be utilized to promote improvements in quality both as a systematic and strategic manner. Six Sigma is a customer focused, well defined methodology for process improvement. Companies included tools of Six Sigma approach ensure more effective process and to eliminate defects. These toolsets include statistical and analytical tools. Six Sigma tools are included in DMAIC improvement project roadmap. It is important to ensure total commitment and leadership from the top management to have success with use of tools and techniques.
Application of tools and techniques;
Checklists, Control plans support Checking.
Check sheets, Bar charts, Histograms, Graphs help to collect data. Pareto Analysis, Quality Costs set priorities and help to planning.
23 Affinity Diagrams, Brainstorming structures ideas. Statistical Process Control helps to measure capability.
Flow Chart, C&E Diagram help to analyse problem and process. Scatter Diagram help to identify relationships.
DOE identifies Control Parameters.
Mistake Proofing, FMEA, Matrix Data Analysis monitor and maintain control.
Definitions of main tools;
3.3.1 The Affinity Diagram
Help to generate a high volume of ideas or issues. It creatively brainstorms and organizes a large number of ideas. Affinity Diagram brainstorms ideas to find solutions and problems also it summarizes them to understand the basic of the problem. It also states the question, records and reviews ideas. Ideas which generated from a brainstorming session is analyzed, prioritized before they can be implemented with help of this diagram. Affinity diagramming is an effective technique for a large number of ideas.
3.3.2 SIPOC
SIPOC means Supplier, Inputs, Processes, Outputs, and Customer. It identifies these elements of process improvement project. SIPOC is a high level map of a process to view how a company satisfies their customer requirements in the supply chain. SIPOC addresses any of the problems, as long leadtime, poor quality, high cost etc.
24
3.3.3 Process Mapping
It is a process flowchart that helps to see detailed version of the process. Process Mapping is a method that used during the define step of a Six Sigma project to illustrate how a product is processed. A process map is a type of flowchart that uses symbols connected with arrows to represent visually how the parts of a process interact. Process Mapping helps to represent a process that contains a series of linked tasks activities which produce an output. It clarifies current situation and simulates targeted solution. It shows adds resources, costs, volumes and durations to build up cost models and identifies how the performance of this process can be measured.
3.3.4 Pareto Charts
It constructs and prioritizes the defect factors. So it will determine which issue has the huge impact in the process. Pareto Chart; ranks orders the bars from highest to lowest in order to prioritise problems of any nature. It shows importance of a particular categories which might be types of defects, expenditure categories, and reasons for a situation, categories of complaints. Working on the category with the highest occurence has the potential to give you the most benefit. This tool helps to allow us to devote our energies to the areas that will have the biggest impact.
25
3.3.5 Experimental Design (DOE)
It identifies key process input variables and its optimum settings that effect process mean. DOE establishes critical and noncritical variable selection and identifies process performance. Design of Experiments method identifies experimentation. DOE focuses on planning experiments to reduce the effects of random, uncontrollable the most effective method for identifying key input factors, establishing a mathematical relationship between inputs and outcomes, determining optimal input levels and setting process tolerances. The goal of DOE is to determine the most important process factors and find its optimal settings. It also helps to identify less important process for final product that may be set to a more economical level than previously thought. In not clear situations that causes problem or there are so many process parameters to consider nearly impossible to find the right combination to provide optimum performance, DOE tool is used.
3.3.6 Failure Mode Effects Analysis (FMEA)
It is an analytical approach for preventing defects by prioritizing problems. FMEA is a systemized group of activities aimed to recognize the failure of a product/process. It also identifies actions that eliminate the probability of the potential failure. FMEA is a proactive quality planning process. And the calculation of reducing risks by identifying the ways in which a product, process, or service can fail. FMEA approach facilitates the relative weighting of a potential failures before the action is committed at a conceptual or an early stage of operation. It prioritizes risks and documents recommended actions. Potential type of failure of product is assessed relative to 3 criteria on scale of 1 to 10. The 3 scales of potential failure are multiplied together to produce a combined rating which is risk priority number to provide the focus process efforts.
26
3.3.7 Process Control Plan
It establishes a process control system and it monitors the process response. Then it maintains the control of process inputs under SPC guidelines.
3.3.8 Project Charter
It help to link process to strategic business requirements, identifies customer characteristics, includes team charter and problem statement, shows scope and goals. In addition identifies and calculates financial benefits. A Project Charter is the starting point and it takes place in the Define stage of DMAIC. Project Charter is a guide for the team members to be focuse on the project.
3.3.9 Brainstorming
It is a group activity that people interacts with each other collaboratively to solve a problem have almost always had a better outcome than the average of the outcomes of each person working on the same problem individually. It establishes the aim of the meeting, does not criticize or compliment ideas as they are represented, records every each of ideas presented. In addition, brainstorming is an improvement tool to generate ideas on any topic by encouraging free thinking. All ideas are recorded without discussion until a complete list is constructed. BB or MBB act as an observer to guide the process and this technique actively manages team member participation.
27
3.3.10 Cause and Effect Matrix
It is used to identify and prioritize inputs that impact a set of output requirements based on their importance to the customer. It creates a process map prior to attempting to create a C&E matrix so that no factors are missed on the matrix. It arranges identified outputs the outputs on the process map in columns and assignes each one a rank, either relative to each other, or on a rating scale where 10 indicates an important output variable and 1 indicates a minor one. Cause and effect matrix captures VOC and also helps to find out less important steps so team can focus on critical input variables. It lists customer-related outputs and rank them interms of importance, therefore these outputs are key-process outputs of project. C&E lists process inputs that is taken from process map and brainstorming session and rates steps by using scale of 0,1,3,9 where 0 means no correlation and 9 is strong correlation. And finally it multiplies the process correlation times the customer weighting and adds the scores across the row to get a total score for each process input.
3.3.11 Cause And Effect Diagram
This tool is specialied idea organizing which helps to identify potential causes. 6 M’s (method, manpower, machine, material, measurement, mother nature-environment) organized in categories that looks like fish skeleton to collect data and resolve the issues. C&E is a graphical representation of potential causes. The aim of the diagram is to identify main causes of the problem. This diagram is using to study a problem or improvement opportunity to identfy root causes.
28
3.3.12 Statistical Process Control
This tool help to monitor a production process to help the process meets with quality standards. Some main tools can be involved in SPC as Process Control Charts, which establishes process control limits, and then are used over time ensure that the process stays “in control”. The seven basic tools as includes SPC tools as; Pareto Chart, C&E Diagram, Check Sheet, Scatter Diagram, Flow Charts, Control Charts. SPC helps process stability and guides on reduction of defects. SPC lies in applying it to the key process input variables identified with the DMAIC process, uncovering key inputs which is achieved in process control was the path to dramatic process improvement in the first place. Main comparents of SPC are creating a control chart, removing special causes of variation, instituting procedures for immediate detection and correlating of future problems.
3.3.13 Gage R&R Studies
It is used to evaluate a measurement system. These studies measure the amount of variability introduced into the measurement and compares it to the total variability observed in the process being measured. It is useful to identify an inconsistent tool or operator differences in measuring techniques and helps to establish the quality of the data which is collected and used to make decisions.
29
3.3.14 Flow Diagram
It represents and helps to understand of all steps in the process. It identifies flow of events. Flow Process Diagram shows the hierarchical structure of operations and the sequence of activities, non-value added activities.
3.3.15 Run Chart
It allows team to observe data over a period of time. Run chart detects trends, variations or cycles and allows team to compare performances of a process before and after the implementation of the solution. Run Chart tracks one or more variables over time. It is used to track variation and trends in the occurence of a defect over time. Data is collected will be produced over time such as key process measures taken each shift, number of defects produced per hour or per day, total lead time each day and so on. Run chart displays and analyzes data in the order is collected.
3.3.16 Scatter Diagram
It identifies the relationship between variables and factors. Scatter diagram is an initial step of Regression Analysis. Scatter diagram is useful for problem solving and to detect if there are more than two variables between causes and effects.
30
3.3.17 Control Charts
A control chart help to determine is process stable. Three control limits are drawn: the central line, the lower control limit and the upper control limit. The points above the UCL or below the LCL indicate a special cause. If no signals occur, the process is assumed to be under control, only common causes of variation are present. In addition, control chart helps to determine whether the variation seen in the data points is a normal part of the process or if something different is happening.
3.3.18 Process Capability Analysis
It helps to understand how well process variation fits within the range of customer specifications process or product should have stability before assessing capability. Therefore, capability analysis will be conducted after control charts confirm which the process is stable.
3.3.19 Measurement System Analysis
It is a measurement system that uses Gage R&R studies to quantify the measurement repeatability and reproducibility.
31
3.3.20 Multi-vari Study
It samples and operates the process identify statistical and graphical analysis identifies the important controlled and uncontrolled variables.
3.3.21 Value Stream Mapping
It identifies the flow of materials. The aim is to analyze the current process to determine which steps actually add value to the customer or identify which steps cause waste of time and money. This approach looks at the production flow from customer demand. VSM follows the production path from customer to supplier and draw a visual representation of every process in the material and information flow. In general, it helps to visualize process level and helps to see sources of wastes. It forms the implementation plan and shows the linkage between information flow and material flow. It improves process by identifying added value and eliminating waste also it is a process map that help to follow value creation process and describe what the firm will do to effect numbers. It is sequence of steps required to satify a need categories are, demand, delivery, development, support. It identifies waste to eliminated within the current state and design and implement future state map. VSM visualizes the work processes and helps to highlight problem as well as areas for improvement.
3.3.22 Analysis Of Variance (ANOVA)
It helps to find difference in averages among shifts, investigates and try to answer. It standardizes shifts, finds different ways to set up machines, determines which output will have greatest effect and which areas should we explore. ANOVA compares the response variable means to assess the importance of factors. ANOVA requires data
32
from approximately normally distributed populations with equal variances between factor levels.
3.3.23 Tree Diagrams
It breaks down ideas in greater detail. The goal is to divide problems into its smaller component help tree diagram to make the idea easier to understand, and make the problem easier to solve. It also shows the goal or objective the means of accomplishing the goal.
3.3.24 Critical To Quality Tree
It describes the output characteristics of a process. A CTQ tree helps data collection stage of an improvement project. After establishing who the customers are by project team, team should determine the customer needs and requirements.
33
3.4 Dmaic Literature Review
Motorola was the first organization that has used DMAIC as a quality performance measurement and improvement program. Also General Electric, Sony, Allied Signal used quality tools to gain knowledge. Especially, General Electric spent 500 million dollars and gained 2 billion dollars on DMAIC works in 1995.
“In 2012 Ganguly, has analyzed the reduction of cycle time for reducing inventory” [5].
“In 2013 Dambhare, has analyzed the main problem to what leads wastage of man hours and labor cost” [6].
Various researchers worked on DMAIC approach and is described in below;
“Snee (2000) defined the concept of DMAIC for reducing product and process variation. Statistics of rejection collected and critical causes identified for corrective actions. Then, suggestions implemented, rejections collected and compared with the previous rejection. So considerable improvements found. The results achieved were demonstrated by using Pareto diagrams. Accordingly rejections were reduced to 5.9%” [7].
“Horel (2001) explained DMAIC approach. It is applied in manufacturing operations and it started to expand to other functional areas such as marketing, engineering, purchasing and servicing. Whirlpool increased their quality by 10% by adopting DMAIC technique” [8].
“Anthony and Banuelas (2002) explained a case study on bulb manufacturing company for reducing the shell cracking during the manufacturing of bulbs and achieved improvements in defects by using DMAIC method” [9].