DOES ECONOMICS EDUCATION DECREASE BIASES:
EVIDENCE FROM TURKEY ON REPRESENTATIVENESS
AND MONEY ILLUSION
SALİH KAMİL SALİHOĞLU
111620007
ISTANBUL BİLGİ ÜNİVERSİTESİ
SOSYAL BİLİMLER ENSTİTÜSÜ
ULUSLARARASI FİNANS YÜKSEK LİSANS PROGRAMI
TEZ DANIŞMANI:
Yrd. Doç. Dr. ENDER DEMİR
3
ABSTRACT
The aim of this thesis is to study the impact of economy education on reducing the behavioral biases and the degree of this impact on male and female subgroups separately. The difference of influence level of behavioral biases on males and females had been a field of study just for couple of years. Additionally, the impact of economy education on mitigating behavioral biases is an attention getting field of study. Nevertheless, studies that work on both at the same time are not common. In such a bare field of study, data gathering is a hard issue. During the study, we executed a questionnaire to both students with economy education and no economy education. In the study; finance, mathematical finance or any other equivalent field of economy are considered in the same way in the econmy education. According to the findings of the study; economy education has an effect on reducing the behavioral biases, that is also true for male and female subgroups.
4
ÖZET
Bu tezin amacı, ekonomi eğitiminin davranışsal sapmaları indirgemedeki etkisini ve bu etkinin erkek ve kadın alt gruplarda ayrı ayrı düzeyini çalışmaktır. Erkek ve kadınlarda davranışsal sapmaların farklı etki dereceleri yalnızca birkaç yıldır çalışılmakta olan bir alandır. İlaveten ekonomi eğitiminin davranışsal sapmaları indirgemede etkisi, dikkatleri çekmekte olan bir alandır. Ancak her ikisini de aynı anda irdeleyen çalışmalar yaygın değildir. Böylesi açık bir alanda veri toplamak zor bir konudur. Bu çalışma esnasında ekonomi eğitimi olan ve olmayan öğrenciler üzerinde bir anket gerçekleştirdik. Çalışmada finans, finans matematiği ya da bunların benzeri ekonominin muadili diğer alanlar da ekonomi eğitimiyle aynı şekilde değerlendirildiler. Çalışmanın sonuçlarına göre; ekonomi eğitimi davranışsal sapmaları azaltmada etkiye sahip olmaktadır, bu durum erkek ve kadın alt gruplar için de doğrudur.
5
ACKNOWLEDGMENTS
It was an honor for me to work with my dear instructor and thesis advisor Ender Demir. I really thank him for his strong support during my study. He was more than an advisor but also a close friend for me. I also want to express my gratitude to my dear insructors Serda Selin Öztürk and Engin Volkan for their comments on my study. Additionally I am thankful to the students who took part in the questionaraes and their instructors who allow me to collect data for the study.
I also express my gratitude to my family for all the support that they gave me throughout my education; especially, to my father with whom I consult on financial markets and also to my sister Feyza from whom I learned so much about psychology. Their perspective on financial markets and cognitive psychology gave me useful comments on my thesis.
6
TABLE OF CONTENTS
ABSTRACT……….………….……3 ÖZET……….………….………..4 ACKNOWLEDGMENTS……….………….…………..……..5 TABLE OF CONTENTS……….………..…..……..6 LIST OF TABLES……….……….……7 1. INTRODUCTION……….……….……82. REPRESENTATIVENESS & MONEY ILLUSION ….…...9
2.1 Representativeness Bias...………...……….….9 2.1.1 Definition………..…….…..9 2.1.2 Literature Review ………..………..15 2.2 Money Illusion………..…………..…….19 2.2.1 Definition ………...………...…19 2.2.2 Literature Review……...………...20
2.3 Economy Education, Gender and Behaviraol Biases…...22
3. DATA & METHODOLOGY………..…..…..27
3.1 Questionare………..…27
3.2 Subjects………....…31
3.3 Methodology……….…...33
4. RESULTS………..………34
4.1 General Results……….34
4.2 Question Level Results………...…....35
7
References ………...…42 Appendices……….…..47
8
LIST OF TABLES
Table 3.1: Demographics of the subject group……….….33 Table 4.1: Results of 1st question of representativeness ………….…..35 Table 4.2: Results of 2nd question of representativeness ………….….37 Table 4.3: Results of 1st question of money illusion …….…… …...38
Table 4.4: Results of 2nd question of money illusion………..… ……...39
9
1. INTRODUCTION
The importance of behavioral finance on finance world is continuously increasing; and concept of behavioral biases is the most important pillar of behavioral finance. Investment managers, bankers, investors and all kinds of financial decision makers are threaten by behavioral biases which can manipulate the rationality of our decisions.
Traditional economy assumes that, people are rational and take rational decisions; as a result financial markets are effective. On the other hand, the claim of behavioral finance includes some motives from sociology and psychology to explain the irrational behaviors of investors.
Knowing such irrational behaviors, or so called behavioral biases, is one thing; but getting rid of them is the important one. In order to get rid of behavioral biases, economy education has an important mission. If behavioral biases really manipulate our financial decisions, and actually they do so, then we should learn how to deal with them with the help of an effective economy education.
From that starting point, this study tries to evaluate the effectiveness of economy or any related field of education in reducing behavioral biases. The aim of this study is analyzing the difference between economy literate and economy illiterate students in terms of expressing behavioral biases.
We have chosen two very known and common behavioral biases to make our study. These are representativeness and money illusion biases. We used a questionnaire with five questions, which were inspired by some well known questions from previous studies on behavioral biases, to see the reactions of our subjects.
10
Our subjects were university students from both economy background and not economy related fields. After studying the difference between economy and non-economy students, we also conducted t-tests to see whether there is a difference between male and female students. We searched for male and female difference, because gender is an important parameter in behavioral finance.
With this study, we hope to contribute behavioral finance literature especially in Turkey by experimenting on university students and analyzing the behavioral differences between economy and non economy students. This study also contributes gender perspective of behavioral finance literature.
11
2. REPRESENTATIVENESS & MONEY ILLUSION
2.1 Representativeness Bias 2.1.1 Definition
“Fit no stereotypes. Don’t chase the latest management fads. The situation dictates which approach best accomplishes the team’s mission.”
Colin Powell
Representativeness bias or in other use representativeness heuristic, is a shortcut used by our minds to decide on uncertain events in a quick but sometimes in a wrong way. This concept of behavioral bias is not well-known before 1970’s before two psychologists Amos Tversky and Daniel Kahneman proposed it. Tversky and Kahneman (1974) described representativeness heuristic as a way of thinking when people encounter with new events. People in general have a tendency to classify newly encountered events according to their past experiences, and if such new events reflect some most basic characteristics of a group of former events, then people simply think that the new events is just a member of the related former group. But meaning that the new event, let’s say it A, has the characteristic of a former group, let’s say it B, does not always increase the likelihood of A to belongs to B.
In order to make the definition clearer, below example would be useful: (Nofsinger, 2008, p. 63) “-Mary is quiet, studious and concerned with social issues. While an undergraduate at Berkeley she majored in English literature and environmental studies.
12
Given this information, indicate which of the following three cases is most probable:
(a) Mary is a librarian.
(b) Mary is a librarian and a member of the Sierra Club (America’s largest and most influential environmental organization with 1.3 million members).
(c) Mary works in the banking industry.”
As shown in the example, there is a new event to decide on which is the occupation of Mary. On the other hand, people who were asked such a question have some ideas about librarians, bankers and Sierra Club members. According to the study of Nofsinger (2008); half of the questionnaire takers chose choice (b), a quarter to a third chose (a) and the rest chose (c).
However choice (a) includes choice (b) and that makes it clearly more likely. And the number of people working in banking sector is much more than the number of librarians which makes choice (c) definitely more likely than choice (c).
Despite these facts, people favors choice (b), because the description of Mary’s personality influences the thinking way of people and prevents them from rationality. This very common departure from rational thinking is called representativeness bias.
In Barberis et al. (1998) extended the literature on representativeness bias and its aspects which were proposed by Tversky and Kahneman (1974) beforehand. They mentioned the investor behavior under the effect of representativeness as “investors might classify some stocks as growth
13
stocks based on a history of consistent earnings growth, ignoring the likeli- hood that there are very few companies that just keep growing.” (Barberis et al., 1998, p.309)
There are sub aspects of representativeness bias according to Tversky and Kahneman. With their first study on representativeness, the main concepts of representativeness bias were clearly defined. In their study Tversky and Kahneman (1974) describes five major aspects of representativeness bias which are: Insensitivity to prior information (also named as base rate neglect), insensitivity to sample size, misconceptions of chance, insensitivity to predictability and misconceptions of regression.
Base rate neglect explained by Richard J. Taffler (Taffler, 2010, p. 261) as follows: “Ignoring prior probabilities or base rate frequencies, and relying on the representativeness of the event alone.” The example question at the start of the chapter about the occupation of Mary is an example of base rate neglect.
Another aspect of representativeness bias is insensitivity to sample size, or simply sample size neglect. This is the tendency of people to neglect the sample size of the information. Another name of this phenomenon is law of small numbers. This phenomenon is simply the tendency of people to approach the likelihood of an event without considering its sample size; as a result, even the sample size is not big enough, people consider the statistical result of the event confidential. Or when considering two different events with different sample sizes, they do not give the required value to the sample size.
A good example to sample size neglect is shown in the study of Tversky and Kahneman (1974); they ask a question to the subjects about two hospitals serving the same town. According to the scenario the first
14
hospital gives birth to 45 babies a day and the second only 15. In each hospital the days in which more than the 60% of babies born were recorded. Finally question asks for the likelihood of more such event recorded days. According to the sampling theory, larger sample sizes tend to show the general pattern. So such events (more than 60% boys) are more likely to be seen in smaller hospital. But 56% of the subjects thought the likelihood of occurrence of such rare events are same in both hospitals.
Tversky and Kahneman (1974) also described another aspect of representativeness bias which is “misconceptions of chance”. Reported in their study, misconception of chance can be described as; “People expect that a sequence of events generated by a random process will represent the essential characteristics of that process even when the sequence is short.” (Tversky& Kahneman, 1974, p. 1125) This aspect is also related with law of small numbers or more accurately with gambler’s fallacy. The most well-known example of this fallacy is the event occurred on August 1913 in Monte Carlo Casino. (David, 2004) In the roulette table, the ball fell in black rows in a sequence of 26 times. Such a rare event captured the attention of gamblers and at the very last rounds people tend to bet for red thinking that after so many blacks the probability of a red row increased. Actually the probability of independent events does not change with the past events.
Another aspect of representativeness is “insensitivity to predictability”, which is people’s tendency to make predictions based on the information given them about the situation, but most cases the information is not enough to judge accurately. As an example; after getting some good news, that are just a small piece of the whole picture, about a stock; an investor tends to make good predictions about the possible outcomes of the stock profit. This action stems from the false belief that the information about the stock represents the whole situation.
15
And lastly, Tversky and Kahneman (1974) defined the concept of “Misconceptions of regression”. In statistics, if all the subjects are equal, then outliers will tend to regress towards the mean of the whole event, in the long run. But people have a tendency to not think in this way. They see the past events as a representative of upcoming events.
2.1.2 Literature Review
After the study of Tversky and Kahneman in early 1970’s, like other areas of cognitive decision making, studies on representativeness were not so common in the following two decades. Especially in the field of behavioral economy, the progress was on low speed.
Behavioral finance got importance after the market anomalies of early 2000’s which could not be explained by traditional economy theories. Representativeness bias was also used as a tool to explain such anomalies.
In addition to Tversky and Kahneman, another psychologist Maya Bar-Hillel studied representativeness in 1970’s. Bar-Bar-Hillel asked around 1500 subjects which are university students or new entrants, a set of problems in order to detect their tendency to fall base rate neglect. The set of problems includes simple paradigms which did not require any specific educational background to understand. The study (Bar-Hillel, 1979) favors that people’s decision are manipulated by base rate neglect. The result of the study explained by the tendency of people to ignore the low relevant information and only use the high relevant information when they supplied with two distinguished information about a decision. That tendency is the reported as the main cause of base rate neglect of the subjects in the study (Bar-Hillel, 1979).
16
Gilovich, Vallone and Tversky studied representativeness in a very different area: Basketball. According to Gilovich, Vallona and Tversky (1985), there is a common belief among basketball fans and some players that if a player make a series of good shots (scores) in a game then the likelihood of good shots will increase, and vice versa. This common belief is called “hot hand” or “streak shooting”. The data of the study which are the shooting records of Philadelphia 76ers and Boston Celtic, showed no evidence of “hot hand”. They explained this false belief with representativeness bias.
After 2000’s like the other areas of behavioral finance, studies on representativeness gained speed. In their study on capital markets Daniel, Hirschleifer and Teoh (2001, p. 145) stated that: “Investors use past performance as an indicator of future performance in mutual fund and stock purchase decisions” and additionally describe representativeness as a false judgment method stems from behavioral attributes. In their study, Daniel and his colleagues argued that systematic mispricing of the capital markets stems from psychological biases.
There are also some studies in the literature which are not in favor of representativeness bias. As an example; two years after the study of Daniel and his colleagues; Chan, Frankel and Kothari made a study on the effect of representativeness bias on investors. But unlike the previous study they find no effect of representativeness in pricing of the market (Chan, Frankel and Kothari, 2002)
Another directly finance related study of representativeness is done by Cooper, Dimitrov and Rau (2001). They worked on “dot.com effect” which is simply the positive effect on company stocks after the companies have a website with the ending “.com”. At the first place it seems irrelevant to think that there is a correlation between such a change in
17
companies’ websites and their stocks but the study ( Cooper, Dimitrov and Rau, 2001) stated that, companies which changed their name according to dot.com style, their stocks earn significant abnormal in the following days. 3 years after the study of this study; a group of academicians made another study on the dot.com effect (Cooper et al., 2004). In this study, they presented a data set of the stock values of tradable companies from NYSE, Amex, NASDAQ and OTC. This time results were also significant but in another way: “Following the Internet “crash” of mid-2000, investors react positively to name changes for firms that remove dot.com from their name. This dot.com deletion effect produces cumulative abnormal returns on the order of 64 percent for the sixty days surrounding the announcement day.” (Cooper et al., 2004, p.1)
From a rational view such names changes should not affect the performance of stocks. When a company changes its name or changes some other belonging of itself it would not increase the future cash flows of the company or even it would not increase the possibility to gain advantage against other stocks. But people see a relation with naming of a company, stock or even a fund with the probability of success. In their study Cooper, Gulen and Rau (2005) used a data from The Center for Research in Security Prices to investigate whether name changes of funds have an effect on their performance. They showed that, if the fund changed its name accordingly to current hot style of investment word, then fund experiences abnormal flow of 28% in a period of one year.
Like other behavioral biases, representativeness bias is common among the investors. Investors’ decisions shape the market, and when irrational investment decisions are extremely common among the market players, the market itself becomes biased. In order to observe the Chinese investment market, in a study (Chen et al., 2007) using nearly 50 thousands individual Chinese investor’s accounts, Chen and his colleagues
18
showed, investors show representativeness bias by believing past returns are indicative of future returns.
The effects of representativeness on stock markets do not always come from pure economic events. In their study; Chen et al. (2007) showed that market is biased because of the biased opinions of investors about the relationship between past prices of stocks and their possible future gains. This seems somehow normal, because both past returns and future returns are primarily related with the market itself.
However, in a study on NFL championship game, called Super Bowl, Chang, Jiang and Kimb (2009) used television commercial records between 1989 and 2005 to show that the liked commercials which were released on TV during the Super Bowl increase their companies’ stock prices. Super Bowl is the most important match of the NFL; as a result to release a commercial during super bowl is a very prestigious issue. Companies wait for the Super Bowl night to release new types of commercials. Some of the commercials get real attention and liked so much. There is an index for the appreciation of the public for the commercials which is used during the study (Chang, Jiang & Kimb, 2009) When rationally thinking, liked commercials should not have an effect on stock prices. However when people liked a commercial, they associate the commercial with the success of the company. They see the commercial as a representative for the companies stocks, which explained the increase of the stocks after the commercials.
Analyst recommendations done by investment banks or other such intuitions are important sources to get information and idea about the picture of the market and specifically interested stocks for investors. In a recent study (Mokoaleli-Mokoteli, Taffler and Agarwal, 2009) on cognitive bias and conflicts of interest in analyst stock ratings with a data sample between 1997 and 2002 gained from the top 10 US sell-side
19
brokerage houses, it is shown that: “analysts are prone both to behavioural bias as well as potential conflicts of interest in theirnew buy stock recommendation decisions” (Mokoaleli-Mokoteli, Taffler and Agarwal, 2009, p. 384)
2.2 Money Illusion
2.2.1 Definition
“Money is not everything.”
English Proverb
As we all know, money is not everything and there are much more important things like; health, happiness, having a good family and friends or maybe someone should add here the inflation. Speaking of which money illusion is the tendency of people to think money itself alone without comparing it to the prices of the staff that are going to be bought with the money. Or in other words, money illusion refers to a tendency to think in terms of nominal monetary values rather than real monetary values.
The term money illusion has been used nearly for a century to define the difference between money in nominal and real terms. Firstly, Irving Fisher mentioned the term money illusion in his book “Stabilizing the Dollar” which was published in 1920. After that, Irving Fisher published “The Money Illusion” a book specific for money illusion in 1928.
In a more technical way, Patinkin refers to money illusion as any deviation from decision making in purely real terms: “An individual will be said to
20
be suffering from such an illusion if his excess-demand functions for commodities do not depend [...] solely on relative prices and real wealth…”(Patinkin, 1965, p. 22)
On the other hand, money illusion disapproved by some economists. They thought even the ordinary people can distinguish between nominal and real money. One of them was Tobin who reported in his paper (1972) that: “An economic theorist can, of course, commit no greater crime than to assume money illusion” (Tobin, 1972, p.3) But especially studies done in the recent two decades favors the common existence of money illusion among both ordinary people and investors.
2.2.2 Literature Review
The interest on money illusion, especially, emerged in 2000’s. Shafir, Diamond and Tversky made a study (1997) on money illusion by asking some problems to detect whether the subjects biased with money illusion.
Fehr and Tyran (2001) designed a computerized simulation to run their experiment and 130 subjects were participated in a study to work on the individual level money illusion and its effect on aggregate nominal inertia. They use a nominal negative shock during the experiment and find the results as follows: “a fully anticipated negative nominal shock can cause long-lasting nominal inertia that is associated with large real income losses during the adjustment phase. Our results indicate that a large part of this nominal inertia can be attributed to the direct and indirect effects of money illusion.”(Fehr and Tyran, 2001, p. 1239)
21
Not all of the findings are in favor of the existence of money illusion. As an example; Boes, Lipp and Winkelmann (2007) used a data set from GSOEP surveys dated between 1984 and 1990 to study whether the people’s self reported satisfactions with their income are biased with money illusion. But the results of the study showed that there is no evidence for money illusion in the subjects which are German households, in this case.
Svedsater, Gamble and Garling worked on a study with 247 subjects (2007). They tested the money illusion in intuitive financial decisions by using three set of experiments. With the first experiment they evaluate the influence of nominal representation on participants’ expectations about share prices. In experiment two, same influence was studied but this time the share prices were given to some participants in Euro and some participants in Swedish Crown. Because of the exchange rate, there was a difference in share prices at nominal terms. It is reported that, such difference caused participants to expect different percentages of share changes after they were given both positive and negative information about the profit of stock companies. The last experiment was on splits and reverse splits of share prices which theoretically should not affect share prices. But here again the results were positive, due to the money illusion bias the participants’ willingness to trade changed after both splits and reverse splits.
In a recent study related with money illusion, Schmelinga and Schrimpf (2011) explained the relationship between future stock returns and inflation expectations. They used inflation expectation surveys which were conducted by the Centre for European Economic Research and covers 190 monthly observations between December 1991 and September 2007. According to the results of the study, inflation expectations are strong pre determinants of future stock returns. Future real returns of stocks found to
22
be positively correlated with the inflation expectation surveys. The explanation for such situation is the investors’ tendency to think in nominal terms in state of real terms. Money illusion is shown by the authors, as the main reason behind the study results.
In very recent days of this year, Acker and Duck (2013) proposed a study to examine the positive correlation between inflation and equity values. They used the data of stock records which are traded on NYSE, AMEX and NASDAQ, the data source was Center for Research in Security Prices database and data period was between 1955 and 2007. The results of the study showed that there is “an anomalous positive correlation between inflation and equity values—that it is due to investors suffering from money illusion” (Acker and Duck, 2013, p.586)
2.3 Economy Education, Gender and Behaviraol Biases
Millions of students are taken economy or finance education each years. Hundred millions of dollars spent for this struggle. In brief, all of these efforts are done in order to understand the dynamics of the economy. The belief in superiority of the individuals who know the rules of the economic machine, while managing the economy related issues; make us continue to spend a significant portion of our power on economy education.
The effectiveness of economy education is an area of interest. In this context, as an example to the studies related with the effects of economy education the relationship between economy education and people’s tendency to cooperation is studied.
23
Cox (1998) conducted a survey on 301 students in order to evaluate the difference in cooperation attitudes between economy students and non economy students. The results of the experiment showed that economy students are less cooperative. Iida and Oda (2011) also did an experiment on the same topic, but this time on prisoners. They Divided the prisoners into two group; ones who with economics majors and the others without economics education. They used a dilemma test to evaluate whether there is a different between people with economics education and the others in terms of the tendency to cooperate. And the results of the study showed that people with economy education are less inclined towards cooperation.
McCannon and Peterson (2013) recently studied another aspect of the effectiveness of economy education. They conducted experiments with undergrad students. They used a Public Goods Game in order to see whether economics students behave differently in social helping issues. They showed that the more economics courses one takes, the more selfish s/he becomes.
Economy education already matters; people with better economy education manage the biggest firms, banks and funds. However, some recent developments in the last decade made people interrogate the effectiveness of economy education. Top managers of the biggest banks, who were graduated from the prestigious economy schools, could not forecast the financial crises. At its very worst, they even took very wrong decisions.
“Mistakes are a part of being human. Appreciate your mistakes for what they are: precious life lessons that can only be learned the hard way. Unless it's a fatal mistake, which, at least, others can learn from.” Said Alan Stuart Franken. It is true that mistakes are part of being human, but systematic mistakes done by the whole society are not.
24
On the other hand, behavioral studies of economy are getting more and more attention, especially after the recent financial crisis. The traditional camp of the economy sometimes cannot explain the situation, and then behavioral economists come into help.
After the blooming of behavioral economy, understanding of behavioral biases got more importance. To be a good economist, maybe requires to understand not only the traditionally thought aspects of economy but also the behavioral sides.
If behavioral biases exist, and they do, then economy education should teach its followers how to get rid of them. From this perspective, studies on the effectiveness of economy or finance education on reducing behavioral biases are increasing.
In this context, the effectiveness of economy education on reducing the behavioral biases is studied. Cipriani, Lubian and Angelo Zago (2008) carried out a survey on undergrad students to evaluate whether economy education makes a difference in terms of reducing money illusion. The results of the study favors that economy education has no effect on reducing money illusion. Wond (2005) studied the same topic in a similar study. He conducted some scenario based experiments to undergrad student of economy and non economy. He found very little evidence to favor the effect of economy education in reduction of money illusion bias.
Impact of economy education on peoples’ behaviors and, more specifically, on behavioral biases; provides an open area to study on. On the other hand, gender difference does matter on financial decisions of individuals. Males and females act differently on economic issues.
25
The literature on gender effect on economic decisions is broader. In their study Seguino, Stevens and Lutz (1996) studied the effect of both economy education and gender at the same time. They tested the level of tendency for self interested behavioral attitudes and aptitude for cooperation among graduate students. Their control variables were sample group size, economy education and gender. Their findings favor the effect of economy courses on reducing co-operational behavior but they reported that gender has a stronger effect on self interested attitudes. According to the results of the study males are less bent to cooperation than females.
The studies of gender difference in behaviors are not only limited with level of individualism, there are also other behavioral motivations that has been studied. One is the level of risk aversion. Risk aversion which is also a behavioral bias that holds back individuals from rational economic decisions, is studied by Borghans, Golsteyn, Heckman and Meijers (2009). They studied on gender differences in risk aversion and ambiguity aversion. They studied with students on an experiment which includes gambling and ambiguity scenarios. The results of the study favors that women are more risk averse than men. However there is no evidence for difference in the level of ambiguity aversion in males and females.
In another study which is on overconfidence; Deaves,Luders and Luo (2009) studied on gender affect. Overconfidence is also another behavioral bias and gender related studies on overconfidence are very frequent. The results of the study showed that overconfidence increase trade, but the results do not strongly support the overconfidence difference between genders. The authors reported that there is only little evidence that shows a gap between men’s and women’s level of overconfidence.
26
In a study on mutual fund management Beckmann, Lütje and Rebeggiani (2011) studied the gaps between men and women when dealing with risk. They studied the level of overconfidence bias among 375 Italian asset managers. Their findings prove that women are more risk averse than men. That makes women asset managers less likely to display extreme performance.
27
3. DATA & METHODOLOGY
3.1 Questionare
In order to show the behavioral difference between students who took economy courses and who didnot, we perform a questinonare. Then, we also test whether those differences between male and female students are statistically significant or not.The questionare includes two questions about representativeness bias and two questions about money illusion.
The first question in the representativeness part comes from a very famous study (Kahneman and Tversky, 1983, p.297 ). The question’s original text is as follows:
“Linda is 31 years old, single, outspoken, and very bright. She majored in philosophy. As a student, she was deeply concerned with issues of discrimination and social justice, and also participated in anti-nuclear demonstrations.
Which is more probable? (a) Linda is a bank teller.
(b) Linda is a bank teller and is active in the feminist movement.”
We translated this question into Turkish and reordered it in order to make it more understandable for Turkish students. (For the Turkish question text please see the appendix 1)
28
The aim of the question is to manipulate the subject into the wrong answer (b) which is actually a subgroup of answer (a). If one considers the question rationally, he or she can easily see that choice (a) is more probable. But the study done by Kahneman and Tversky (1983) surprisingly showed that most of the subjects ( 85%) choose (b) against (a). This illogical way of thinking stems from the biased minds of ours. Subjects considered choice (b) as a better representative of the given information about Linda.
The second question about the representativeness bias is also from the behavioral finance literature. But we reorder the question in order to make it more understandable for Turkish students because in the original text the question was about squash game which is not so common in Turkey. We change it with backgammon which is more common in Turkey and its rules are known even by ordinary people. The original question’s text was as follows (Pompian, 2006, p.68):
“A game of squash can be played either to nine or to fifteen points. If you think you are a better player than your opponent, then which game the shorter version, or lengthier version provides you a higher probability of winning?
Suppose, instead, that you are the weaker player. Which game is your best bet now?”
(For the Turkish question text please see the appendix 1)
By asking this question we want to show the difference between economics and non-economics students in terms of their understanding of
29
probability. In a logical thinking there is a difference between the probability of occurrence of high probability events in a long sequence and in a short sequence. The chance of greater number of occurrence of less probable events than the probable events is more in smaller sequences.
In our example of backgammon case, if the player knows the game better than his/her opponent than he/she should select a long game sequence in order to increase the probability of winning more game.
The result of this question shows people’s misunderstanding about the probability concepts, and this misconception allows them to make rational decisions in their investment choices.
In the second part of the questionnaire we asked three questions about money illusion. For the first two questions we inspired by a question which was used in a discussion paper (Thomas and Tyran, 2012).
The original text of the question was as follows, and asks the subjects to select the advantage of Maria by selling the house in a 1 to 15 scale:
“Maria bought a house for 2 million (2,000,000) DKK. Some years later she sold the house. In the period she owned the house, inflation was 31% (i.e. over the entire period, prices in society increased by 31%). Maria received 2,515,200 DKK for the house (i.e. 25.8% more than she paid for it).
How advantageous do you think that the purchase and sale of the house was?”
30
The results of the study (Thomas and Tyren, 2012) showed that subjects are biased and cannot think in real money terms. So the differences resulted by inflation cannot be considered rationally.
Our questions in the money illusion part which are inspired by Thomas and Tyren’s study (2012) was simply an adjustment of the original question into Turkey. (For the Turkish question text please see the appendix 1)
Here we asked a question with no inflation case, the aim of this question is understand the subjects’ reaction in no inflation case. Even in the no inflation case, some subjects may choose wrong answers, but adding the inflation effect on the question makes it harder to understand and increases the error rate. (For the Turkish question text please see the appendix 1)
In the second question which includes inflation, subjects are manipulated by the inflation rate. Rational subjects should consider the real and nominal terms easily, and should see the difference. However results of such questions showed that people are, in general, not capable of differentiate between real and nominal terms.
Our last question in this part is inspired by a question that was used by Shafir, Diamond and Tversky (1997, p.350). The original question text is as follows:
“Carol and Donna, who graduated from same college and upon graduation, took similar jobs with publishing firms. Carol was said to have started with a yearly salary of $36,000 in a firm where the average starting salary was $40,000. Donna started with a yearly salary of $34,000 in a firm where the average starting salary was $30,000.
31
Do you think who is happier with her job situation?”
In this question Carol actually has more salary than Donna but compare to her coworkers Carol is in a worse situation. On the other hand Donna earns more than her coworkers. Form a rational point of view, subjects should choose Carol, but the manipulation in the question which gives information about the other coworkers makes people choose Donna. According to the study (Shafir, Diamond & Tversky, 1997) 80% of the subjects answered this question in a wrong way.
(For the Turkish question text please see the appendix 1)
The aim of this question is to analyze the subjects’ behavioral attitude towards nominal term. The question simply asks for two individuals which has very similar backgrounds but has different salaries. In a rational point of view, the one who gets the more salary should be considered as the happier one. When comparing two individuals the others (here coworkers of Zeynep and coworkers of Sema) should not have any effect on the comparison.
3.2 Subjects
The aim of our study is to show the effectiveness of economy or any equivalent education in terms of reducing behavioral biases. In order to show this we prepared a questionnaire for university students.
We conducted our questionnaire total of 115 students. However we did not use the results of 3 subjects because they were stepped at the middle of two groups (we divided the subjects according to their relation with
32
economy education, will be explained later). They were between 18 and 30; only 4 of the subjects were between 30 and 35. The average age was 23.68 and 62 of the subjects were female and 50 of them were male.
The questionnaires are done in classes, especially before the starting of lectures. No one was forced to attend the questionnaires; all of the subjects were volunteers. So there was no need for any incentives. The only incentive in participation was to helping somebody to do his study. We see this is a good motivation than a material incentive.
The results of subjects’ answers were divided into two groups according to the number of economy courses that they were taken. That division also represents their major education branches. First group of the subjects called econs and it represents the subjects who took at least 5 economy courses. The other group consists of subjects with no economy education or the ones who took only 1 economy course during his/her educational career. We called the second group of subjects: nonecons.
In econs group we collected subjects from: economics, finance, international trade, accounting and business. On the other hand, the subjects in nonecons group were from: literature, law, media and psychology. In total we have 58 econs and 54 nonecons.
The test are done in order to analyze the difference between these two major groups but we also perform tests to understand whether there is also a difference between male and female students in terms of showing behavioral biases.
33
3.3 Methodology
The methodology of our study is inspired by a study (Charness, Karnib & Levinc, 2009) in which the famous Linda question was used. The results of the questions are taken into account with an error rate perspective in that study.
We used error rates of each group to find out the difference between two groups of subjects. To calculate error rate we simply divide number of wrong answers to the number of total answers for each of the questions. After we get the error rates, we compare them in pairs to see whether there is a significant difference in the subject groups’ reactions to our questions.
We used STATA to run our results. STATA command for the test was prtesti. To test the hypothesis that two samples are different in terms of their error rate, STATA runs t-test and give the p values for each pair of sample groups.
Beside econ versus nonecon comparision we also did a comparison between male and female subgroups of students in order to see whether there is a difference in subgroups. Also in this part we use error rate concept and STATA t-test command.
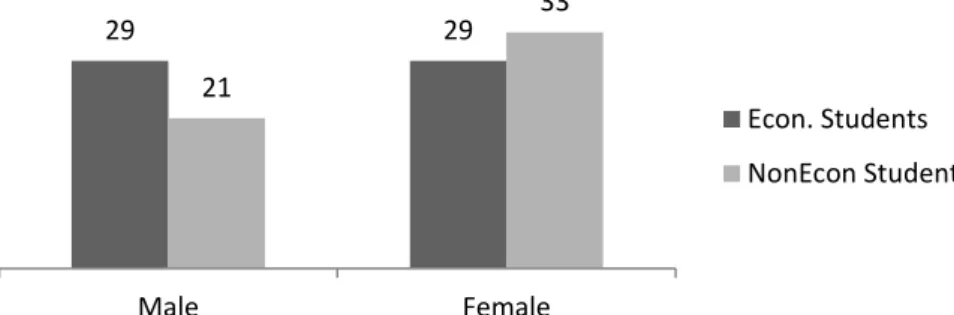
Table 3.1: Demographics of the subject group
29 29 21 33 Male Female Econ. Students NonEcon Students
34
4. RESULTS
4.1 General Results
The results of the study, as we expected, shows us that, at first both group suffer from behavioral biases. Both economy literate and economy illetarate students, and both males and females suffer from representativeness and money illusion biases. But the levels of commonness of these biases in those groups are different. Economy education makes students better at thinking rationally.
Firstly, the results of representativeness bias questions showed that; econs are better than nonecons in terms of dealing with representativeness bias. It is also true for subgroups; when we look at the subgroups which are male-econs versus male-nonmale-econs and female-male-econs versus female-nonmale-econs; we see the same results. Economy education makes students better in terms of getting rid of representativeness bias.
Secondly, the results of the money illusion part showed that economy literate students are better in detecting the difference between real and nominal terms when dealing with inflation. Two of the questions in that part included inflation based real and nominal term difference; economy students significantly done well in these questions. That situation is also true for male and female subgroups. But, on the other hand, the last question in money illusion part did not include inflation manipulator, the manipulator was somehow emotional. The question asks for the subject opinion about an emotional situation that was level of happiness. In that question nonecon students done slightly better than econ students, but the difference was not significant. So we took the general result of the money illusion part and reported that economy education also has an effect on reducing money illusion bias.
35
4.2 Question Level Results
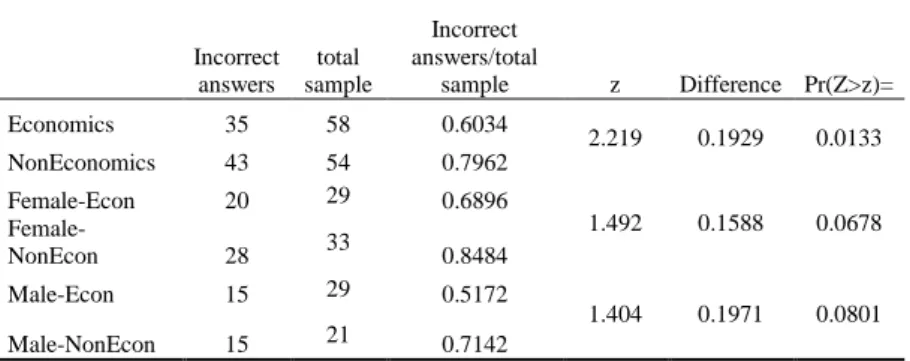
The results for the backgammon question, which was the first question in representativeness part, shows that economy literate students are more capable of thinking rationally (Table 4.1). Economy illiterate students significantly made more mistakes in the backgammon question. This situation is true for both male and female subgroups. Male economy students are less biased compare to male non economy students; it is also true for females but the difference in male subjects is clearer.
In details the results of the question shows that, there is a 19.29% difference in economy and non-economy students. The error rates for econ and nonecon groups are 60.34% and 79.63% respectively. The difference shows that, economy students have lower error rates with a 5% level of significance. For female economy students error rate was 68.97% and for non-economy female students it was 84.85%. For male economy students and male non-economy students the error rates were: 51.72% and 71.43%. These findings are also consistent with the previous studies which indicate commonness of representativeness bias between 60% and 90%. This question favors the claim that economy education has an effect on reducing representativeness bias in general, for male students and for female students.
Table 4.1: Results of 1st question of representativeness
Incorrect answers total sample Incorrect answers/total sample z Difference Pr(Z>z)= Economics 35 58 0.6034 2.219 0.1929 0.0133 NonEconomics 43 54 0.7962 Female-Econ 20 29 0.6896 1.492 0.1588 0.0678 Female-NonEcon 28 33 0.8484 Male-Econ 15 29 0.5172 1.404 0.1971 0.0801 Male-NonEcon 15 21 0.7142
36
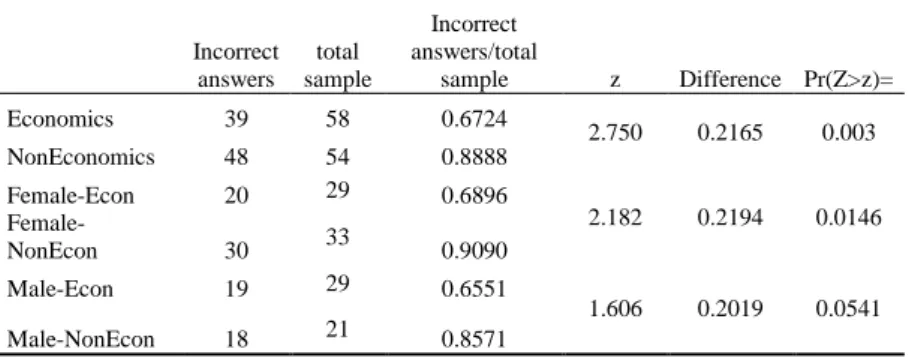
For the second question, which was inspired by Linda question, we also find similar results with the previous question. Economy students significantly have lower error rates then non-economy students. This situation is same for both male and female subgroups. ( Table 4.2)
Economy students’ group has a 67.24% error rate while non-economy group has 88.89%, which indicates a 21.65% difference with a 1% level of significance. Likely, female groups have error rates: 68.97% and 90.91 respectively. Error rates for male counterparts were 65.52% and 85.71%.
When we compare the error rates of our subject and the error rates of the subjects that were used by Tversky and Kahneman (1983) we can say that our subjects do better ( the general error rate in Tversky and Kahneman’s study was 85.2). And when we compare our results with the most similar group in Charness, Karnib and Levinc’s study (2010), we have a greater error rates ( error rate was 58.1 in Charness, Karnib and Levinc’s study for the “UCSB students, singles, no incentives group”)
For the representativeness part of the study, it is clear that economy education has an effect in reducing this bias. This could be a result of statistic and probability perspective that can be achieved by some economy courses like econometrics, economy statistics, and regression models. Our non-economy subjects possibly know less about probability theory. As a result, they were more vulnerable to representativeness bias. Base rate neglect or misconception of chance could be more common in nonecons.
Here we see probability and statistics education as the reason of reducing representativeness bias in econs, but there could be more complex reasons
37
for such difference. To understand such other reasons could be another topic of interest for further researchers.
Table 4.2: Results of 2nd question of representativeness
Incorrect answers total sample Incorrect answers/total sample z Difference Pr(Z>z)= Economics 39 58 0.6724 2.750 0.2165 0.003 NonEconomics 48 54 0.8888 Female-Econ 20 29 0.6896 2.182 0.2194 0.0146 Female-NonEcon 30 33 0.9090 Male-Econ 19 29 0.6551 1.606 0.2019 0.0541 Male-NonEcon 18 21 0.8571
For the money illusion part we asked three questions and first one of them was the Suzan’s house question. In this question we were not expecting a big difference between econ and nonecon groups, because there was 0% inflation rate in the scenario. However, even mentioning of inflation made a difference. Econ group made fewer mistakes in their answers (Table 4.3). Both male and female subgroups show the same difference. Econ students significantly do better score in question 3.
The results show that econ group has an error rate of 6.9%, on the other hand nonecon group has a 15.31% point more which is 22.22%. Economy students gave better answers with 5% level of significance. Female economy students’ error rate was 10.34%, and female non-economy students’ error rate was 24.24%. Male groups did 3.45% and 19.05% respectively.
38
Table 4.3: Results of 1st question of money illusion
Incorrect answers total sample Incorrect answers/total sample z Difference Pr(Z>z)= Economics 4 58 0.0689 2.315 0.1532 0.0103 NonEconomics 12 54 0.2222 Female-Econ 3 29 0.1034 1.430 0.139 0.0764 Female-NonEcon 8 33 0.2424 Male-Econ 1 29 0.0344 1.815 0.156 0.0348 Male-NonEcon 4 21 0.1904
For the second question of money illusion part, we use another house buying and selling question but this time there was real inflation. Like the previous question, econ students significantly do better results. But this time the difference between econ and nonecon groups was severe. (Table 4.4)
In this question economy students did 18.97% error rate and non-economy students did 55.56% error rate. Economy students were better in dealing with money illusion with 1% level of significance. It was same for male and female subgroups; female econs did 13.76% on the other hand nonecons did 57.58%. For males the result were: 20.69% and 52.38%.
Our comment on such a great difference in the inflation included question is that: economy students know really much about term of inflation. They can differentiate between real and nominal terms, on the other hand nonecon students are not that much good at it.
39
Table 4.4: Results of 2nd question of money illusion
Incorrect answers total sample Incorrect answers/total sample z Difference Pr(Z>z)= Economics 11 58 0.1896 4.017 0.3659 0,000 NonEconomics 30 54 0.5555 Female-Econ 4 29 0.1379 3.562 0.4379 0,000 Female-NonEcon 19 33 0.5757 Male-Econ 6 29 0.2068 2.335 0.3169 0.0098 Male-NonEcon 11 21 0.5238
Lastly, the salary comparison question includes an emotional comparison between two friends which was very far from the field of economy. Economy students have no advantage on this question. Actually, nonecon students have a little advantage because some participants of this group were from social fields. As a result nonecons do better on this question but the difference was not significant. So we cannot say that the result of this question was notable. (Table 4.5)
The difference between economy and non-economy students was not statistically significant. Non-econs’ error rate was 75.93% and econs’ was 79.31%. Error rates in female economy students was 82.76% and in non-economy females 72.73%. For males: econs was 75.86% and nonecons was 80.95%.
Table 4.5: Results of 3rd question of money illusion
Incorrect answers total sample Incorrect answers/total sample z Difference Pr(Z>z)= Economics 46 58 0.7931 -0.4293 -0.0338 0.6661 NonEconomics 41 54 0.7592 Female-Econ 24 29 0.8275 -0.9425 -0.1003 0.827 Female-NonEcon 24 33 0.7272 Male-Econ 22 29 0.7586 0.4288 0.0509 0.334 Male-NonEcon 17 21 0.8095
40
5. CONCLUSION
The results of this study clearly show that; economy education has a positive effect on reducing representativeness bias. Representativeness bias is much related with probability theory, and familiarity with probability and statistics could has a positive effect on mitigation of representativeness bias. Economy students take probability and statistics courses, and that makes them familiar with the concepts of representativeness like base rate, sample size and predictability.
The representativeness questions in our questionnaire were directly related with probability concepts and asked for the probability of occurrence of some events under defined conditions. It was not surprising that economy students do better scores in representativeness questions.
When going into gender details, both male and female students showed same pattern as in general case. As a conclusion we can say that economy education reduces representativeness bias both for males and females.
We found similar results for money illusion bias. Students learn concept of real and nominal value by economy education. Economy education also includes inflation concept. On the other hand nonecon students do not know so much about inflation concept, real and nominal values. As a result our findings show that both male and female economy students have less money illusion bias.
41
However when going into question details, the results of the study shows that economy students significantly has less money illusion when the question includes real and nominal money terms. Economy student are not better than the others when dealing with the other concepts of money illusion.
For further researches more detailed concepts of representativeness and money illusion could be studied. And also, besides economy education, other parameters like: age, experience and mental performance could be analyzed as a reducer of behavioral biases. We know that; in our study we distributed subjects according to the number of economy courses they took. It is hard to say that, the difference in the results of two groups (econ and nonecon) purely depends on pure economy education. One reason could be the numeric background of economy courses, which could also be learned through other courses like mathematics, physics, engineering and other sciences. In order to learn the deep reason behind the difference between econ and nonecon students, one should analyze in a study economy and some other students from a numerical field like engineering, mathematics or science.
42
References
Acker, D. & Duck, Nigel W. (2013) Do Investors Suffer from Money
Illusion? A Direct Test of the Modigliani–Cohn Hypothesis. Review of
Finance 17: pp. 565–596
Bar-Hillel, M. (1980). The Base-Rate Fallacy In Probability Judgments., Acta Psychologica 44 , 211-233, North-Holland Publishing Company
Cooper, Michael J., Dimitrov, O. & Rau , Raghavendra P(2011). A
Rose.com by Any Other Name , The Journal of Finance VOL. LVI, NO. 6
DEC.
Beckmann, D., Lütje, T. & Rebeggiani, L. (2011). Italian Asset Managers’
Behavior: Evidence on Overconfidence, Risk Taking and Gender. Journal of
Modern Accounting and Auditing, ISSN 1548-6583, December 2011, Vol. 7, No. 12, 1368-1385
Binay, K. & Adhikari, Virginia O. L. (2011). Gender Differences In Risk
Aversion:A Developing Nation’s Case. Journal of Personal Finance,
Volume 10, Issue 2, p 122-147
Boes, S., Lipp, M. & Winkelmann, M. (2007). Money illusion under test. Economics Letters 94, 332–337
Borghans, L., Golsteyn, Bart H. H., Heckman, James J. & Meijers, H. (2009). Gender Differences In Risk Aversion And Ambiguity Aversion. Nber Working Paper Series, National Bureau Of Economic Research, Working Paper 14713
Chan,Wesley S.,Frankel, R. & Kothari, S.(2004). Testing behavioral finance
theories using trends and consistency in financial performance. Journal of
43
Chang, C. Jiang, J. & Kimb, Kenneth A. (2009). A test of the
representativeness bias effect on stock prices: A study of Super Bowl commercial likeability. Economics Letters 103, 49–51
Charness, G., Karnib, E. & Levinc, D. (2009). On the conjunction fallacy in
probability judgment: New experimental evidence regarding Linda. Games
and Economic Behavior,68(2) (2010) pp. 551–556
Cipriani, G. Pietro, Lubian, D. & Zago, A. (2008). "Money Illusion: Are
Economists Different?". Economics Bulletin, Vol. 1(3) pp. 1-9
Cooper, Michael J., Khorana, A., Osobov, I., patel,A. & Rau, Raghavendra P. (2004). Managerial actions in response to a market downturn: Valuation
effects of name changes in the dot.com decline. Forthcoming, Journal of
Corporate Finance, April
Cooper, Michael J., Gulen, H. & Rau, Raghavendra P.(2005). Changing
Names with Style: Mutual Fund Name Changes and Their Effects on Fund Flows The journal of finance, vol. Lx, no. 6, december
Chen, G., Kim, Kenneth A., Nofsinger, John R & Oliver, M. (2007) Trading
Performance, Disposition Effect, Overconfidence, Representativeness Bias, and Experience of Emerging Market Investors. Rui, Journal of Behavioral
Decision Making J. Behav. Dec. Making, 20: 425–451
Cox, Steven R. (1998). Are Business and Economics Students Taught to Be
Noncooperative?, Journal of Education for Business, 74:2, 69-74
Daniel, K., Hirshleifer, D. & Teoh, S., (2002). Investor psychology in
capital markets: evidence and policy implications. Journal of Monetary
44
Darling, D. (2004). "Roulette", The Universal Book of Mathematics: From
Abracadabra to Zeno's Paradoxes. New Jersey,John Wiley & Sons, p278
Deaves, R., Luders, E. & Luo, Guo Y. (2009), An Experimental Test of the
Impact of Overconfidence and Gender on Trading Activity. Review of
Finance 13: 555–575
Fisher, I. (1920). Stabilizing the Dollar. New York, Macmillan
Fisher, I. (1928). The Money Illusion. New York: Adelphi Company
Fehr, E. & Tyran, Jean R. (2011). Does Money Illusion Matter?. The American Economic Review, VOL. 91 NO. 5, pp. 1239-1262
Iida, Y. & Oda, Sobei H. (2011). Does Economics Education Make Bad
Citizens? The Effect of Economics Education in Japan. Journal Of
Education For Business, 86: 234–239
Mccannon , Bryan C. & Peterson, J. (2013). Does an Economics Education
Affect Behavior? Evidence from a Public Goods Experiment, and Jeffrey
Peterson, Electronic copy available at: http://ssrn.com/abstract=2213502
Nicholas, B., Shleifer, A. & Vishny., Robert W. (1998). A model of investor
sentiment. Journal of Financial Economics 49:3, 307–343.
Nofsinger, John R. (2008). The psychology of investing. 3rd ed. Upper Saddle River, NJ: Pearson Education.
Patinkin, D. (1965). Money, Interest and Prices. New York: Harper and Row
45
Pompian, Michael (2006). Finance and Wealth Management: How to Build
Optimal Portfolios That Account for Investor Biases. John Wiley & Sons
Inc. Hoboken, New Jersey
Schmelinga, M. & Schrimpf, A. (2011) Expected inflation, expected stock
returns, and money illusion: What can we learn from survey expectations?.
European Economic Review 55, 702–719
Seguino, S., Stevens, T., Lutz & Mark A.(1996). Gender And Cooperative
Behavior:Economic Man Rides Alone. Feminist Economics 2(1), 1-21
Shafir, E., Diamond, P. & Tversky, A.(1997). Money Illusion. The Quarterly Journal of Economics, Vol. 112, No. 2, May 1997, pp. 341-374,
Solt, M. E. & Statman, M. (1989). ‘Good Companies, Bad Stocks’. The Journal of Portfolio Management, pp. 39–44
Stephens, Thomas A. & Tyran,(2012). Jean R. “At least I didn’t lose
money” Nominal Loss Aversion Shapes Evaluations of Housing Transactions. Discussion Papers Department of Economics University of
Copenhagen
Svedsater, H., Gamble, A & Garling, T. (2007) Money illusion in intuitive
financial judgments:Influences of nominal representation of share prices.
The Journal of Socio-Economics 36 698–712
Taffler, R. (2010). Behavioral Investors. Corporations, and Markets , Wiley
Thabang, Mokoaleli M., Taffler, Richard J. & Agarwal, V.(2009)
Behavioural Bias and Conflicts of Interestin Analyst Stock
Recommendations. Journal of Business Finance & Accounting, 36(3) & (4),
46
Tobin, J. (1972). Inflation & Unemployment. American Economic Review, Vol. 62(1), p: 1–18.
Tversky, A. & Kahneman, D. (1974) Science, New Series, Vol. 185, No. 4157, (Sep. 27, 1974), pp. 1124-1131
Tversky, A. & Kahneman, D., (1983). Extensional versus intuitive
reasoning: The conjunction fallacy in probability judgment. Psychological
Review 90, 293–315.
Wong, Wei K.(2005). Does Money Illusion Still Matter After Some
Economics Education?
47
Appendices
Questionnaire Questions Question (1)
Ahmet 31 yaşında, bekar, açısözlü ve son derece zeki bir insandır. Lisans eğitimini felsefede almıştır. Öğrenciyken, ayrımcılık ve sosyal adalet konularına son derece ilgili olan Ahmet, ayrıca anti-nükleer gösterilerine de katılırdı. Sizce Ahmet ile ilgili olarak aşağıdakilerden hangisi daha muhtemeldir?
a) Ahmet bankacıdır.
b) Ahmet bankacı ve çok aktif bir greenpeace üyesidir.
Question (2)
Tavla oyunu tecrübenin önemli olduğu ancak şans faktörünün de etkili olduğu bir oyun olarak bilinmektedir. Çok iyi bir tavla oyuncusu olduğunuz farz edin ve rakibinizin de bir amatör olduğunu. Bu durumda galip gelmeniz için 5 elden oluşan bir oyun serisinde mi yoksa 10 elden oluşan bir oyun serisinde mi şansınız daha fazla olur?
a) 5 el b) 10 el
c) İkisi de aynı olasılıkta olur
Question (3)
Suzan 100.000$ nakit ödeyerek bir ev satın almıştır. Bir kaç yıl sonra bu evi 90.000$'a satmıştır. Evi alımı ile satımı arasında geçen zaman zarfında
48
Suzan'ın yaşadığı ülkede hiç enflasyon yaşanmadığına göre Suzan bu alım satımdan ne kadar karlı çıkmıştır?
a) Çok kar etmiştir b) Biraz kar etmiştir c) Biraz zarar etmiştir d) Çok zarar etmiştir
Question (4)
Ahmet 100.000$ nakit ödeyerek bir ev satın almıştır. Birkaç yıl sonra bu evi 110.000$'a satmıştır. Evi alımı ile satımı arasında geçen zaman zarfında Ahmet'in yaşadığı ülkede %25 oranında enflasyon yaşanmadığına göre Ahmet bu alım satımdan ne kadar karlı çıkmıştır?
a) Çok kar etmiştir b) Biraz kar etmiştir c) Biraz zarar etmiştir d) Çok zarar etmiştir
Question (5)
Zeynep ve Sema, aynı liseden mezun olup ardından birlikte aynı Üniversite'de işletme okumuşlardır. Mezun olduktan kısa bir süre sonra
49
Zeynep, aylık ortalama işe başlama gelirinin 3.000TL olduğu bir şirkette 2.500TL net gelirle işe başlamıştır. Sema ise aylık ortalama işe başlama gelirinin 2.000TL olduğu bir şirkette 2.300TL maaşla işe başlamıştır. Eğitimleri ve iş performanslarını etkileyebilecek tüm diğer özellikleri aynı olan Zeynep ve Sema'dan sizce hangisi maaşı konusunda daha mutludur?
a) Zeynep b) Sema