CERN-EP-2017-107 2017/11/22
CMS-B2G-16-024
Search for pair production of vector-like T and B quarks in
single-lepton final states using boosted jet substructure in
proton-proton collisions at
√
s
=
13 TeV
The CMS Collaboration
∗Abstract
A search for pair production of massive vector-like T and B quarks in proton-proton
collisions at √s = 13 TeV is presented. The data set was collected in 2015 by the
CMS experiment at the LHC and corresponds to an integrated luminosity of up to
2.6 fb−1. The T and B quarks are assumed to decay through three possible channels
into a heavy boson (either a W, Z or Higgs boson) and a third generation quark. This search is performed in final states with one charged lepton and several jets, exploiting techniques to identify W or Higgs bosons decaying hadronically with large transverse momenta. No excess over the predicted standard model background is observed. Upper limits at 95% confidence level on the T quark pair production cross section are set that exclude T quark masses below 860 GeV in the singlet, and below 830 GeV in the doublet branching fraction scenario. For other branching fraction combinations with B(T → tH) + B(T → bW) ≥ 0.4, lower limits on the T quark range from 790 to 940 GeV. Limits are also set on pair production of singlet vector-like B quarks, which can be excluded up to a mass of 730 GeV. The techniques showcased here for understanding highly-boosted final states are important as the sensitivity to new particles is extended to higher masses.
Published in the Journal of High Energy Physics as doi:10.1007/JHEP11(2017)085.
c
2017 CERN for the benefit of the CMS Collaboration. CC-BY-4.0 license
∗See Appendix A for the list of collaboration members
1
Introduction
The discovery of a light mass Higgs boson (H) [1–3] motivates searches for new interactions and particles at the LHC [4]. Cancellation of the loop corrections to the Higgs boson mass without precise fine tuning of parameters requires new particles at the TeV scale. Such new particles are the bosonic partners of the top quark, in supersymmetric models, or the fermionic top quark partners predicted by many other theories, such as little Higgs [5, 6] and composite Higgs [7– 10] models. These heavy quark partners predominantly mix with the third-generation quarks of the standard model (SM) [11, 12] and have vector-like transformation properties under the SM gauge group SU(2)L×U(1)Y×SU(3)C, hence the term “vector-like quarks” (VLQ). While
a chiral extension of the SM quark family has been strongly disfavored by precision electroweak studies at electron-positron colliders [13, 14] and by observed production cross sections and branching fractions of the Higgs boson [15], models with VLQs are not excluded by present data.
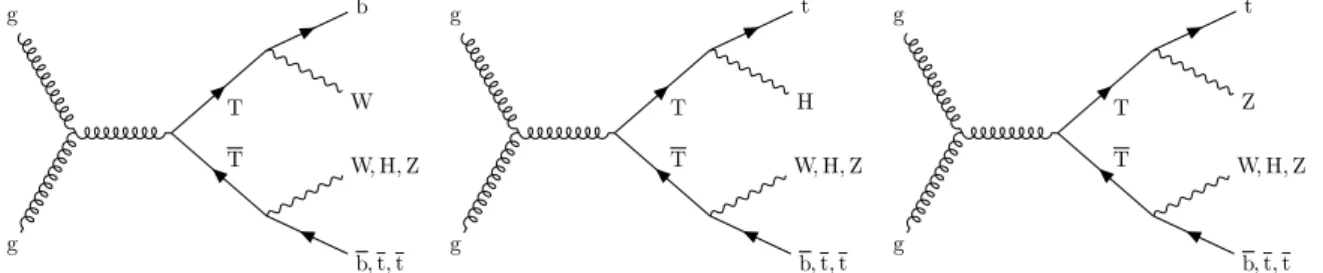
We search for a vector-like T quark with charge 2/3 (in units of the electron charge) that is produced via the strong interaction in proton-proton collisions along with its antiquark, T. Many models in which VLQs appear assume that T quarks decay to three final states: bW, tZ, or tH [16]. Leading-order Feynman diagrams of these three processes are shown in Fig. 1, created with the tools of Ref. [17]. The partial decay widths depend on the particular model [18], so that the branching fractions of these decay modes can take on various possible values, with the sum of all three branching fractions equal to unity. An electroweak isospin singlet T
quark is expected to have a branching fraction of approximately 50% for T→bW, and 25% for
each of T→tZ and tH, and is used as a benchmark for figures and tables. A T quark in a weak
isospin doublet has no decays to bW and equal branching fractions for tZ and tH decays [18– 20]. As these are, however, not the only possible representations of T quarks, the final results are interpreted for many allowed branching fraction combinations.
Though this search is optimized for TT production, decays of vector-like bottom quark partners (B quarks) can produce similar topologies and BB production is also considered. The B quark
with charge −1/3 is expected to decay to tW, bH, or bZ and can also transform either as a
singlet or doublet under the electroweak symmetry group. The respective branching fractions are equal to those of the corresponding T quark decays to the same SM bosons. For this search we assume that only one new particle is present, either the T or B quark.
Most recently, searches for pair-produced T and B quarks were performed by both the ATLAS
and CMS collaborations at √s = 8 TeV [21–26]. Depending on the assumed combination of
branching fractions to the three decay modes, the CMS collaboration observed lower limits on the T quark mass with values ranging from 720 to 920 GeV and on the B quark mass with values ranging from 740 to 900 GeV at 95% confidence level (CL) [21, 25]. The ATLAS collaboration found similar lower mass limits, so that vector-like T and B quarks with masses below 720 GeV
g g b W , t, t , H, Z W b T T g g b W , t, t , H, Z H t T T g g b W , t, t , H, Z Z t T T
Figure 1: Examples of leading-order Feynman diagrams showing production of a TT pair with the T quark decaying to bW (left), tH (middle), and tZ (right).
2 2 The CMS detector and event reconstruction
are already excluded for all possible branching fraction combinations. We therefore only con-sider VLQ masses above 700 GeV in this search. The ATLAS collaboration has also searched for
pair production of T and B quarks at√s=13 TeV [27, 28].
We require one electron or one muon in the final state, along with several jets. All decay modes of the T and B quarks produce t quarks and/or W bosons, which are the dominant sources of leptons. In the high mass region that we consider, the decay products can have a large Lorentz boost and result in highly collinear final state particles. This search makes use of techniques to identify b quark jets and reconstruct hadronic decays of massive particles that are highly Lorentz-boosted in the reference frame of the TT system. The data are analyzed in two chan-nels that are optimized for sensitivity to either boosted W or Higgs bosons, referred to as the “boosted W” and “boosted H” channels. The boosted W channel is most sensitive to scenarios where the T quark has a large branching fraction for bW decays (such as the electroweak singlet benchmark) while the boosted H channel has the highest sensitivity to scenarios with a large
branching fraction to tH (such as the electroweak doublet benchmark). The T→tZ decay mode
is not a particular target of this search, but Lorentz-boosted Z bosons decaying hadronically can be selected in either channel since the signatures are similar to those of boosted hadronic W or Higgs boson decays, thus providing some sensitivity to the tZ decay mode.
2
The CMS detector and event reconstruction
The central feature of the CMS apparatus is a superconducting solenoid of 6 m internal diame-ter, providing a magnetic field of 3.8 T. Within the solenoid volume are a silicon pixel and strip tracker, a lead tungstate crystal electromagnetic calorimeter (ECAL), and a brass and scintilla-tor hadron calorimeter (HCAL), each composed of a barrel and two endcap sections. Forward calorimeters extend the pseudorapidity (η) [29] coverage provided by the barrel and endcap detectors. Muons are measured in gas-ionization detectors embedded in the steel flux-return yoke outside the solenoid.
A particle-flow (PF) algorithm [30] is used to reconstruct and identify each individual particle in an event with an optimized combination of information from the various elements of the CMS detector. The energy of photons is directly obtained from the ECAL measurement, cor-rected for zero-suppression effects. The energy of electrons is determined from a combination of the electron momentum at the primary interaction vertex as determined by the tracker, the energy of the corresponding ECAL cluster, and the energy sum of all bremsstrahlung photons spatially compatible with originating from the electron track. The momentum resolution for
electrons with transverse momentum pT ≈ 45 GeV from Z → e+e− decays ranges from 1.7%
for low-bremsstrahlung electrons in the barrel region to 4.5% for showering electrons in the endcaps [31]. The energy of muons is obtained from the curvature of the corresponding track. Matching muons to tracks measured in the silicon tracker results in a relative transverse mo-mentum resolution for muons with 20< pT<100 GeV of 1.3–2.0% in the barrel and better than
6% in the endcaps. The pT resolution in the barrel is better than 10% for muons with pT up to
1 TeV [32]. The energy of charged hadrons is determined from a combination of their momenta measured in the tracker and the matching ECAL and HCAL energy deposits, corrected for zero-suppression effects and for the response function of the calorimeters to hadronic showers. Finally, the energy of neutral hadrons is obtained from the corresponding corrected ECAL and HCAL energy.
Jets are reconstructed from the individual particles produced by the PF event algorithm,
clus-tered using the anti-kT algorithm [33, 34] with distance parameters of 0.4 (“AK4 jets”) or 0.8
and is found from simulation to be within 5 to 10% of the true momentum over the whole pT
spectrum and detector acceptance. All jets are required to have|η| < 2.5 and AK4 (AK8) jets
must have pT > 30(200)GeV. An offset correction is applied to jet energies to take into
ac-count the contribution from additional proton-proton interactions within the same or nearby bunch crossings (pileup) [35]. Jet energy corrections are derived from simulation, and are
con-firmed with in situ measurements of the energy balance in dijet and photon/Z(→ee/µµ)+ jet
events [36]. A smearing of the jet energy is applied to simulated events to mimic the energy res-olution observed in data, typically 15% at 10 GeV, 8% at 100 GeV, and 4% at 1 TeV. Additional selection criteria are applied to each event to remove spurious jet-like features originating from isolated noise patterns in the HCAL [37], anomalously high energy deposits in certain regions of the ECAL, and cosmic ray and beam halo particles that are detected in the muon chambers. The missing transverse momentum vector is defined as the projection on the plane perpendic-ular to the beams of the negative vector sum of the momenta of all reconstructed particles in an event. Its magnitude is referred to as EmissT . The energy scale corrections applied to jets are propagated to ETmiss.
A more detailed description of the CMS detector, together with a definition of the coordinate system used and the relevant kinematic variables, can be found in Ref. [29].
3
Data and simulated samples
The data used in this analysis were collected during 2015 when the LHC collided protons at √
s=13 TeV with a bunch spacing of 25 ns. The data set for the boosted W channel corresponds
to an integrated luminosity of 2.3 fb−1. The data set for the boosted H channel in the electron
(muon) channel corresponds to 2.5 (2.6) fb−1 and includes additional data collected with poor
forward calorimeter performance where the EmissT has been re-computed excluding the affected
region of the detector.
To compare the SM expectation with the experimental data, samples of events for all relevant SM background processes and the TT signal are produced using Monte Carlo (MC) simulation.
Background processes are simulated using several matrix element generators. ThePOWHEGv2
generator [38–41] is used to simulate tt events, as well as single top quark events in the tW
channel at next-to-leading order (NLO). The MADGRAPH5 aMC@NLO 2.2.2 generator [42] is
used for generation at NLO of Drell–Yan + jets and tt + W events, as well as tt + Z events, and s- and t-channel production of single top quarks. The FxFx scheme [43] for merging matrix
element generation to the parton shower is used. The MADGRAPHv5.2.2.2 generator is used
with the MLM scheme [44] to generate W + jets, Drell–Yan + jets, and multijet events at leading
order. PYTHIA8.212 [45, 46] is used for the simulation of multijet and diboson events.
The boosted W channel uses the NLO Drell–Yan + jets simulation and the MADGRAPHmultijet
simulation. The boosted H channel uses the MADGRAPH Drell–Yan + jets simulation, and the
PYTHIAmultijet simulation which is filtered for processes likely to pass the lepton selection in
this channel. Background samples are grouped into three categories for presentation: “TOP”, dominated by tt and including single top quark and tt + W/Z samples; “EW”, dominated by W + jets and including Drell–Yan + jets and diboson samples; and “QCD”, including multijet samples.
Signal samples for both TT and BB production are simulated using MADGRAPHfor mass points
between 700 and 1800 GeV in steps of 100 GeV. A narrow width of 10 GeV is assumed for the vector-like quarks. Predicted cross sections, which depend only on the vector-like quark mass,
4 4 Reconstruction methods
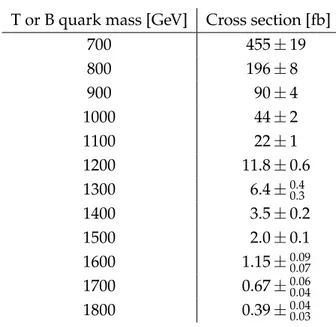
Table 1: Predicted cross sections for pair production of T or B quarks for various masses. Un-certainties include contributions from energy scale variations and from the PDFs.
T or B quark mass [GeV] Cross section [fb]
700 455±19 800 196±8 900 90±4 1000 44±2 1100 22±1 1200 11.8±0.6 1300 6.4±0.4 0.3 1400 3.5±0.2 1500 2.0±0.1 1600 1.15±0.09 0.07 1700 0.67±0.06 0.04 1800 0.39±0.04 0.03
are computed at next-to-next-to-leading order (NNLO) with the TOP++2.0 program [47–52]
and are listed in Table 1.
Parton showering and the underlying event for all simulated samples are obtained withPYTHIA
using the CUETP8M1 tune [53, 54]. To simulate the momentum spectrum of partons inside the colliding protons, the NNPDF3.0 [55] parton distribution functions (PDFs) are used. Detector
simulation for all MC samples is performed with GEANT4 [56] and includes the effect of pileup.
4
Reconstruction methods
We perform a search for T quarks that decay to final states with an electron or a muon, and jets. Selected events must have one or more pp interaction vertices within the luminous re-gion (longitudinal position |z| < 24 cm and radial position ρ < 2 cm), reconstructed using a deterministic annealing filter algorithm [57]. The primary interaction vertex is the vertex with the largest∑ p2T from its associated jets, leptons, and ETmiss. The number of pileup interactions differs between data and simulation, so simulated events are weighted to reflect the pileup distribution expected in data given a total inelastic cross section of 69 mb [58].
Two observables that are useful in discriminating signal from background events, exploiting the fact that the decays of T quarks to single-lepton final states produce a large number of hadronic objects, are the following: the quantity HT, defined as the scalar pTsum of all
recon-structed AK4 jets with pT > 30 GeV and|η| < 2.4, and the quantity ST, defined as the scalar
sum of EmissT , the pTof the lepton, and HT.
4.1 Lepton reconstruction and selection
This search requires one charged lepton, either an electron or a muon, to be reconstructed within the acceptance region of |η| < 2.4. The event must satisfy a electron or
single-muon trigger. The choice of triggers is adapted to the particular final state targeted in each
channel. In T → bW decays, the W boson is generally well separated from the associated
bottom quark since the T quark has low pT compared to its mass, leading to a low level of
quark decay (e.g., from a T → tH decay) becomes increasingly collinear with the associated bottom quark as the T quark mass increases and the Lorentz boost of the top quark rises. As a consequence of the above, the boosted W channel uses triggers selecting leptons that are
isolated with respect to nearby PF candidates, either electron candidates with pT > 27 GeV
and |η| < 2.1, or muon candidates with pT > 20 GeV. The triggers used in the boosted H
channel do not require that the leptons are isolated. In the electron channel, events with at
least one electron candidate with pT > 45 GeV, one AK4 jet with pT > 200 GeV, and another
AK4 jet with pT > 50 GeV are selected by the trigger. The muon channel trigger selects events
with a muon candidate with pT > 45 GeV and|η| <2.1. Methods to evaluate lepton isolation
efficiency after trigger selection are described below.
Additional lepton identification quality criteria are required to reduce the contribution from background events containing other particles misidentified as leptons. For electrons these qual-ity requirements [31] combine variables measuring track qualqual-ity, the association between the track and electromagnetic shower, shower shape, and the likelihood of the electron to originate from a photon. Electrons are identified in the boosted H channel using a set of selection
crite-ria with an efficiency of≈88% and misidentification rate of≈7%. In the boosted W channel,
two working points are defined based on a multivariate identification algorithm: a tight level with≈88% efficiency (≈4% misidentification rate) and a loose level with≈95% efficiency (≈5% misidentification rate).
Muons are reconstructed by fitting hits in the silicon tracker together with hits in the muon detectors [32]. Identification algorithms consider the quality of this fit, the number or frac-tion of valid hits in the trackers and muon detectors, track kinks, and the minimum distance between the extrapolated track from the silicon tracker and the primary interaction vertex. Sev-eral working points are defined: the boosted W channel uses so-called “tight” (“loose”) muons
with≈97% (100%) efficiency in the barrel region, and the boosted H channel uses “medium”
muons with≈99% efficiency in the barrel region. All muon identification working points have
hadron misidentification rates of<1%.
Leptons that pass the requirements in the two channels are removed from jets that have an
angular separation of ∆R < 0.4 from the lepton. This is done by matching PF candidates
identified as leptons to the ones identified as jets and subtracting the four-momentum of a matched lepton candidate from the jet four-momentum.
In order to reduce the rate of background events that contain a soft lepton (e.g., from semilep-tonic bottom quark decays in multijet events), several metrics can be used to evaluate the iso-lation of a lepton from surrounding particles. In the boosted H channel, either an angular separation of∆R(`, j) > 0.4, or prelT (`, j) > 40 GeV is required. Here,`denotes the highest pT
lepton, j is the jet closest to that lepton in angular separation, and prelT (`, j)is the projection of
the lepton momentum on the direction perpendicular to the jet momentum in the `-j plane.
These criteria, also referred to as “2D isolation”, ensure a high signal efficiency for decays such
as T → tH, with leptons produced close to jets, while rejecting a large fraction of the multijet
background.
In the boosted W channel, where fewer leptons with nearby b quarks are expected, isolation
is evaluated using mini-isolation (Imini), defined as the sum of the transverse momenta of PF
candidates within a pT-dependent cone around the lepton, corrected for the effects of pileup
and divided by the lepton pT. The radius of the isolation cone, RI, is defined as:
RI =
10 GeV
min(max(pT, 50 GeV), 200 GeV)
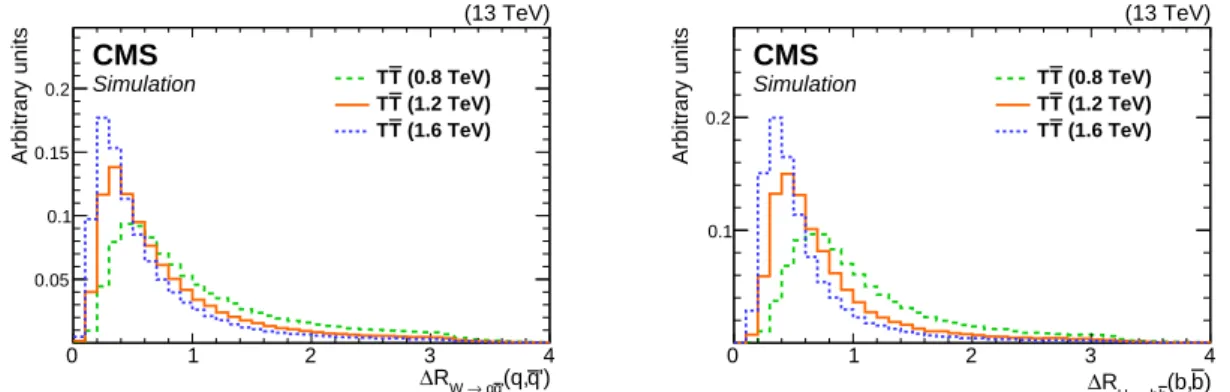
6 4 Reconstruction methods ') q (q, ' q q → W R ∆ 0 1 2 3 4 Arbitrary units 0.05 0.1 0.15 0.2 TT (0.8 TeV) (1.2 TeV) T T (1.6 TeV) T T (13 TeV) CMS Simulation ) b (b, b b → H R ∆ 0 1 2 3 4 Arbitrary units 0.1 0.2 (0.8 TeV) T T (1.2 TeV) T T (1.6 TeV) T T (13 TeV) CMS Simulation
Figure 2: Angular separations∆R between the products of simulated W→qq0(left) and H→
bb (right) decay processes for three different mass points of the T quark. Even for the lowest
mass point shown, the final state particles are typically emitted with a separation of∆R< 0.8
and are merged into an AK8 jet.
Using a pT-dependent cone size allows for greater efficiency at high energies where jets and
leptons are more likely to overlap. “Tight” electrons (muons) must have Imini <0.1(0.2)while
“loose” electrons and muons satisfy Imini < 0.4. In addition, the 2D isolation requirement is
applied to remove any residual overlap between mini-isolated leptons and jets.
Scale factors that account for selection efficiency differences between data and simulation are
calculated as a function of lepton pTand η using a “tag-and-probe” method [31, 32, 59]. These
were calculated in separate measurements for the single-lepton trigger, lepton identification,
and Iminirequirements.
These scale factors are applied to simulated events for both lepton flavors. For the 2D isolation requirement, no significant difference is found between the selection efficiencies in data and simulation and hence no scale factor is applied.
4.2 Hadronic W and H tagging
In the decay of a heavy T quark, particles are produced with high momentum and large Lorentz boost. The decay products of top quarks and W, Z, or Higgs bosons are therefore often
colli-mated. This can be seen in Fig. 2 in which the angular separation∆R between the products of
simulated W → qq0 and H → bb decays are shown for several T quark masses. Even for the
lightest considered mass point this separation often has values of∆R < 0.8, where the decay
products of heavy bosons can merge into a single AK8 jet.
A jet shape variable called “N-subjettiness” [60], denoted as τN, is defined as the sum of the
transverse momenta of k constituent particles weighted by their minimum angular separation from one of N subjet candidates (∆RN,k), which are in a jet of characteristic radius R0:
τN =
1
R0∑kpT,k
∑
kpT,kmin(∆R1,k,∆R2,k, . . . ,∆RN,k). (2)
This variable quantifies the consistency of a jet with originating from an N-prong particle
de-cay. The ratio τ2/τ1 provides high sensitivity to two-prong decays such as W → qq0. Jet
grooming techniques (“pruning” and “soft drop”) are used to remove soft and wide-angle radiation so that the mass of the hard constituents can be measured more precisely [61, 62]. The pruning procedure reclusters the jet, removing soft or large-angle particles, while the soft drop algorithm recursively declusters the jet, removing sub-clusters until two subjets are iden-tified within the AK8 jet. AK8 jets are reconstructed independently of AK4 jets, so they will
frequently overlap. Unless otherwise stated, such overlapping jets are not removed when ap-plying selections based on jet multiplicity.
The AK4 jets and subjets of AK8 jets can be tagged as originating from b quarks based on information about secondary vertices and displaced tracks within the jet. The efficiency for
tagging b hadron jets in simulation is approximately 65%, averaged over jet pT (slightly lower
for subjets of AK8 jets), and the probability of mistagging a charm (light) quark jet is 13%
(1%) [63]. Scale factors, which are functions of jet pT and flavor, are applied to account for
efficiency differences between data and simulation.
An AK8 jet is labeled as “W tagged” if it has pT >200 GeV,|η| <2.4, pruned jet mass between
65 and 105 GeV, and the ratio τ2/τ1 < 0.6. Differences in the pruned jet mass distribution
and τ2/τ1 selection efficiency between data and simulation have been evaluated in Ref. [64].
To account for these differences, pruned jet mass scale factors and mass resolution smearing
factors are applied in simulation to all AK8 jets. A τ2/τ1 selection scale factor is applied in
simulation to jets that are spatially matched to true boosted products of a hadronic W boson decay.
Higgs boson candidate jets are reconstructed by exploiting the significant branching fraction of
the Higgs boson to bb pairs. AK8 jets are marked as “H tagged” if they have pT > 300 GeV,
soft drop jet mass in the range 60–160 GeV, and if at least one of the two subjets from the soft drop algorithm is tagged as a bottom subjet.
5
Boosted H channel
5.1 Event selection and categorization
In this channel, one electron with pT > 50 GeV and |η| < 2.4, or one muon with pT > 47 GeV
and|η| < 2.1 is required. In events with an electron, at least one AK4 jet with pT > 250 GeV
and a second AK4 jet with pT > 70 GeV are required to select events with a nearly constant
trigger efficiency. Furthermore, selected events must have ST > 800 GeV, at least three AK4
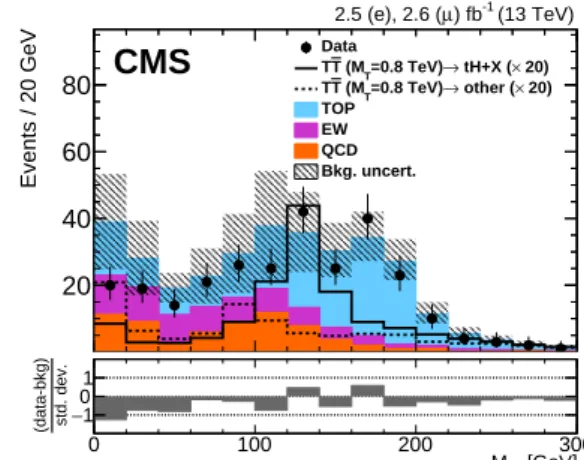
jets, and at least two AK8 jets, since we expect a hadronic decay of a boosted Higgs boson in each event along with at least one other hadronic t quark, W, Z, or further Higgs boson decay. For the rejection of non top quark backgrounds, at least one b-tagged AK4 jet is required. Distributions of the variables used in the H-tagging algorithm, as described in Section 4, are shown in Fig. 3. These distributions are from events that pass all selection criteria outlined above except for the b-tagging requirement, and that have the corrections described in
Sec-tion 5.2 applied. The distribuSec-tion of the number of b-tagged subjets for the highest pT AK8
jet with soft drop jet mass within 60–160 GeV is shown along with the mass of the highest pT
AK8 jet with two b-tagged subjets, before the mass requirement. To illustrate the sensitivity of the H-tagging algorithm to the presence of boosted Higgs bosons, the TT signal with a mass of 1200 GeV is split into two curves: the solid curve shows TT events where at least one Higgs
boson is present in the decay chain and the dashed curve shows TT events with only T → tZ
or T → bW decays. It can be seen that signal events with at least one T → tH decay produce
a clear peak at 125 GeV in the mass distribution of the H-tagged jet. Signal events without a Higgs boson in the decay chain have a less pronounced increase at 90 GeV because of hadronic Z boson decays.
After passing the selection defined above, events are split into two exclusive categories, which depend on the number of b-tagged subjets of H-tagged jets, and are defined as follows:
8 5 Boosted H channel N(b-tagged subjets) 0 1 2 Events 1 2 10 4 10 6 10 8 10 (13 TeV) -1 ) fb µ 2.5 (e), 2.6 ( N(b-tagged subjets) 0 1 2 std. dev. (data-bkg) −1 01 Data tH+X → =0.8 TeV) T (M T T other → =0.8 TeV) T (M T T TOP EW QCD Bkg. uncert. CMS [GeV] jet M 0 100 200 300 Events / 20 GeV 20 40 60 80 (13 TeV) -1 ) fb µ 2.5 (e), 2.6 ( [GeV] jet M 0 100 200 300 std. dev. (data-bkg) −1 01 Data 20) × tH+X ( → =0.8 TeV) T (M T T 20) × other ( → =0.8 TeV) T (M T T TOP EW QCD Bkg. uncert. CMS
Figure 3: Distributions of the number of b-tagged subjets of the highest pT H-tagged jet
can-didate with pT >300 GeV and Mjetin the range [60, 160] GeV (left), and Mjet of the highest pT
H-tagged jet candidate with pT >300 GeV and two subjet b tags (right). A T quark signal with
M(T) = 0.8 TeV is shown (right), normalized to the predicted cross section and scaled by a fac-tor of 20, with the singlet benchmark branching fractions assumed. The solid (dashed) curve shows TT events with at least one (zero) Higgs boson decay, where contributions from each decay mode are weighted to reflect the singlet branching fraction scenario. The uncertainty in the background includes the statistical and systematic uncertainties described in Section 7.
• H2b: events with at least one H-tagged jet with exactly two b-tagged subjets.
• H1b: events with at least one H-tagged jet with exactly one b-tagged subjet.
To avoid an overlap between the two categories, any event is first checked whether it falls into the H2b category and only if it does not, it can enter into the H1b category.
5.2 Background modeling
To evaluate the modeling of tt and W + jets production, the dominant background processes, two control regions that are enriched in events from these processes are defined by modifying the event selection defined in Section 5.1. In the tt control region, at least two b-tagged jets are required instead of at least one. In the W + jets control region, the requirement of at least one b-tagged jet is inverted and events with any b-tagged jets are rejected. Events with an H-tagged jet are rejected in both control regions to reduce the signal contribution in these regions, and EmissT >100 GeV is required to reject events from multijet production. The signal to back-ground ratio is about six times smaller than the one in the H2b category in the tt control region and about 30 times smaller in the W + jets control region. Events are corrected for all known sources of discrepancies between the data and simulation such as differing reconstruction or tagging efficiencies. It is observed that jets have a harder pTspectrum in simulation, leading to
significant discrepancies from observed distributions of quantities such as HT. The
discrepan-cies in both control regions are well described by 2-parameter linear fits with negative slopes to
the ratio between data and simulation in the HT distributions [65, 66]. Modeling of the tt and
W + jets background samples is corrected using the results of these fits. The STdistributions for
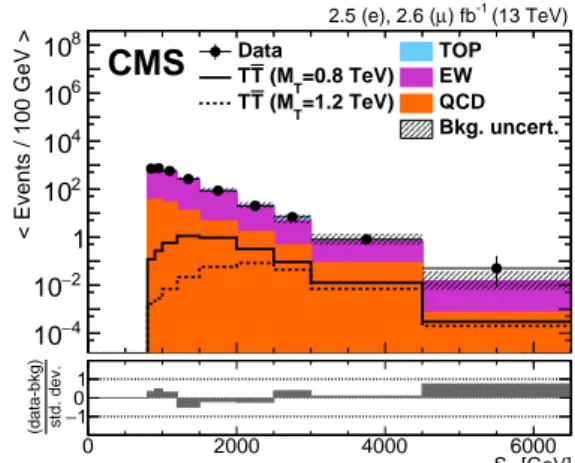
both control regions are shown in Fig. 4 with all corrections applied.
To evaluate the uncertainty in the normalization of the tt and W + jets background processes, a binned maximum likelihood fit [67] of the background-only hypothesis is performed in the
two control regions using the THETAframework [68]. All systematic uncertainties (discussed
[GeV] T S 0 2000 4000 6000 < Events / 100 GeV > 5 − 10 3 − 10 1 − 10 10 3 10 5 10 7 10 (13 TeV) -1 ) fb µ 2.5 (e), 2.6 ( [GeV] T S 0 2000 4000 6000 std. dev. (data-bkg) −1 01 Data TOP =0.8 TeV) T (M T T EW =1.2 TeV) T (M T T QCD Bkg. uncert. CMS [GeV] T S 0 2000 4000 6000 < Events / 100 GeV > 4 − 10 2 − 10 1 2 10 4 10 6 10 8 10 (13 TeV) -1 ) fb µ 2.5 (e), 2.6 ( [GeV] T S 0 2000 4000 6000 std. dev. (data-bkg) −1 01 Data TOP =0.8 TeV) T (M T T EW =1.2 TeV) T (M T T QCD Bkg. uncert. CMS
Figure 4: Distributions of STin the tt (left) and W + jets (right) control regions of the boosted H
channel after applying all corrections to their shape and normalization. The TT signal, shown for T quark masses of 0.8 and 1.2 TeV, is normalized to the theoretical cross section and the sin-glet benchmark branching fractions are assumed. The uncertainty in the background includes statistical and systematic uncertainties described in Section 7.
W + jets backgrounds that are constrained using this fit. The resulting uncertainties in the nor-malizations of the two backgrounds are 8.7% for tt and 6% for W + jets. These uncertainties are included in the final statistical interpretation of the results (discussed in Section 8) as rate uncer-tainties. In both control regions, data and simulation agree within the systematic uncertainties described in Section 7.
6
Boosted W channel
6.1 Event selection
The selection in this channel is optimized for the identification of boosted W boson decays. Selected events are required to have no H-tagged jets ensuring that the event sample in this channel is complementary to that for the boosted Higgs channel, allowing a straightforward combination of the two channels. Events are selected that have one electron or muon, usually
from the decay of a W boson in the T→bW decay mode or from a leptonic top quark decay in
the T→tZ or tH decay modes. Electrons (muons) must have pT >40 GeV,|η| < 2.1(2.4)and
pass the tight identification and isolation requirements described in Section 4. Events having additional loose electrons or muons with pT >10 GeV are rejected.
Each event must have three or more AK4 jets, and the three highest pT jets must satisfy pT >
300, 150, and 100 GeV, respectively. Since a neutrino is expected from a leptonic W boson
decay, EmissT is required to be greater than 75 GeV, which also significantly reduces the
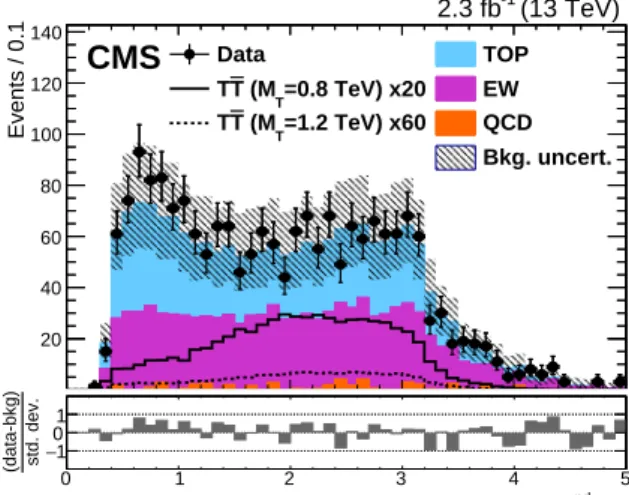
back-ground from multijet events. Control regions are separated from the signal region based on the angular separation between the lepton and the second-highest pTjet in the event,∆R(`, j2).
In both TT and background processes, the lepton is usually observed back-to-back with the
highest transverse momentum AK4 jet, and in TT events the second-highest pT jet also tends
to be back-to-back with the lepton, as seen in Fig. 5. The signal region selection requires ∆R(`, j2) > 1. Figure 5 shows the distribution of ∆R(`, j2) after all selection requirements
except for ∆R(`, j2) > 1. All selection efficiency corrections for differences between data and
simulation are applied, as well as the HT-based reweighting described in Section 5.2.
10 6 Boosted W channel Events / 0.1 20 40 60 80 100 120 140 Data TOP =0.8 TeV) x20 T (M T T EW =1.2 TeV) x60 T (M T T QCD Bkg. uncert. (13 TeV) -1 2.3 fb CMS jet) nd R(l, 2 ∆ 0 1 2 3 4 5 std. dev. (data-bkg) −1 01
Figure 5: Distribution of ∆R(`, j2) in the boosted W channel after all selection requirements
except for∆R(`, j2) > 1. Also shown are the distributions of TT signal events with T quark
masses of 0.8 and 1.2 TeV, scaled by factors of 20 and 60, respectively. The uncertainty in the background includes the statistical and systematic uncertainties described in Section 7.
based on lepton flavor (e, µ), the number of b-tagged jets (0, 1, 2, ≥3), and the number of
boosted W-tagged jets (0, ≥1). In events with no W-tagged jet, we require a fourth jet with
pT > 30 GeV. Figure 6 shows the distributions used for tagging boosted W bosons as well as
the number of b-tagged and W-tagged jets. The pruned mass distribution for AK8 jets with
τ2/τ1 < 0.6 shows a significant contribution of boosted W bosons in signal events weighted
to correspond to the singlet branching fraction benchmark. The τ2/τ1distribution in AK8 jets
with pruned mass between 65–105 GeV shows that W + jets and multijet backgrounds are con-centrated at higher values, as expected for jets without substructure.
We finally analyze the minimum mass constructed from the lepton (`) and a b-tagged AK4
jet, labeled min[M(`, b)]. In leptonic top quark decays, forming a mass from two of the three decay products, the lepton and b quark jet, produces a sharp edge near the top quark mass.
Therefore this distribution is particularly suited to identifying T→bW decays, where the
cor-responding edge forms at much higher masses, near M(T). In the categories with zero b-tagged
AK4 jets, we consider the minimum mass of the lepton and any AK4 jet, denoted min[M(`, j)].
This combination of discriminating variables provides the best sensitivity to low mass T quark
production (.1 TeV) in the singlet branching fraction scenario. Figure 7 shows distributions of
min[M(`, j)]and min[M(`, b)]after the final selection but before the likelihood fits described in Section 8.
6.2 Background modeling
To cross check the modeling of background processes, we consider two control regions enriched by two dominant background processes, W + jets and tt. To define these regions we invert the
signal region requirement of∆R(`, j2) > 1 and modify the requirement on the number of
b-tagged jets to maximize either W + jets or tt yield. For an 800 GeV T quark we expect only 3 events in both control regions compared to a total background of 444, for a signal to background ratio that is a factor of≈3 smaller than in the signal region.
The W + jets control region has zero b-tagged jets and events are categorized according to the
number of W-tagged jets (0,≥1). The tt region has one or more b-tagged jets and events are
categorized according to the number of b-tagged jets (1,≥2). Figure 8 shows distributions of
re-Jets / 10 GeV 20 40 60 80 100 120 140 160 180 200 220 Data TOP =0.8 TeV) x20 T (M T T EW =1.2 TeV) x60 T (M T T QCD Bkg. uncert. (13 TeV) -1 2.3 fb CMS
AK8 Jet Pruned mass [GeV]
0 100 200 300 400 500 std. dev. (data-bkg) −1 01 Jets / 0.02 10 20 30 40 50 60 Data TOP =0.8 TeV) x20 T (M T T EW =1.2 TeV) x60 T (M T T QCD Bkg. uncert. (13 TeV) -1 2.3 fb CMS 1 τ / 2 τ AK8 Jet 0 0.2 0.4 0.6 0.8 1 std. dev. (data-bkg) −1 01 Events 2 − 10 1 − 10 1 10 2 10 3 10 4 10 5 10 6 10 Data TOP =0.8 TeV) T (M T T EW =1.2 TeV) T (M T T QCD Bkg. uncert. (13 TeV) -1 2.3 fb CMS
N(b-tagged AK4 jets)
0 1 2 3 4 5 6 std. dev. (data-bkg) −1 01 Events 2 − 10 1 − 10 1 10 2 10 3 10 4 10 5 10 6 10 Data TOP =0.8 TeV) T (M T T EW =1.2 TeV) T (M T T QCD Bkg. uncert. (13 TeV) -1 2.3 fb CMS
N(W-tagged AK8 jets)
0 1 2 3 4
std. dev.
(data-bkg) −1 01
Figure 6: Distributions of (left-to-right, upper-to-lower) pruned jet mass for AK8 jets with
τ2/τ1 < 0.6, τ2/τ1 for AK8 jets with pruned mass within 65–105 GeV, number of b-tagged
AK4 jets, and number of W-tagged AK8 jets in the boosted W channel with all categories com-bined. Also shown are the distributions of TT signal events with T quark masses of 0.8 and 1.2 TeV, scaled by factors of 20 and 60, respectively, in the upper figures. The uncertainty in the background includes the statistical and systematic uncertainties described in Section 7.
gions show that simulation-based background predictions agree with data within the system-atic uncertainties described in Section 7. Observed and predicted event yields in the control regions for all categories are compared as a closure test, and differences in yields are assigned as an additional systematic uncertainty. This uncertainty accounts for any background mis-modeling after selection and scale factor application.
7
Systematic uncertainties
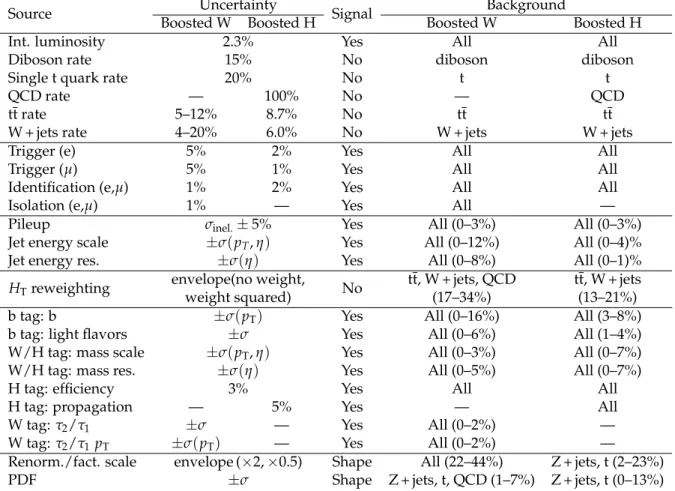
We consider sources of systematic uncertainty that can affect the normalization and/or the shape of both background and signal distributions. A summary of these systematic uncertain-ties along with their numerical values and whether they are applied to signal or background samples can be found in Table 2.
The uncertainty in the integrated luminosity is 2.3% [69] and is applied to all simulated sam-ples. Normalization uncertainties in the rates of SM processes include 20% for single top quark production and 15% for diboson production, based on CMS measurements [70, 71]. For multijet
12 7 Systematic uncertainties
production a rate uncertainty of 100% is assigned in the boosted H channel since the simula-tion used in this channel does not contain either the PDF or matrix element scale uncertainties, unlike those used in the boosted W channel. No rate uncertainty is applied to Z + jets produc-tion since for this process experimental and theoretical uncertainties are small compared to the energy scale and PDF uncertainties described below. Additionally, both channels derive nor-malization uncertainties for tt and W + jets samples from control regions, with values of 5–12% and 4–20% in the boosted W channel, and 8.7% and 6.0% in the boosted H channel. Trigger, lepton identification, and lepton isolation efficiency scale factor uncertainties are also applied as normalization uncertainties.
Uncertainties in both channels affecting the shape and normalization of the distributions in-clude uncertainties related to jet energy scale, jet energy resolution, pruned or soft drop jet mass scale and resolution, and b tagging and light-flavor mistagging efficiencies. These are evaluated by raising and lowering their values with respect to the central values by one stan-dard deviation of the respective uncertainties and recreating a distribution using shifted val-ues at each step of the analysis. An additional uncertainty of 5% is applied in the boosted H channel to account for potential differences when propagating the jet mass scale and resolu-tion scale factors, measured using hadronic W boson decays, to Higgs boson candidate jets.
This uncertainty has been determined by comparing samples simulated with thePYTHIA8 and
HERWIG++ [72] (with the CUETP8M1 tune [53, 54]) hadronization programs and evaluating the
difference between the two programs in the jet mass distributions for hadronically decaying W and Higgs bosons. In the boosted W channel we also apply shape uncertainties to the W bo-son tagging corrections for the τ2/τ1selection efficiency and its pTdependence. To account for
small differences in the H-tagging efficiency between the boosted W and boosted H channel, a 3% normalization uncertainty is assigned that is correlated with the b tagging uncertainty in the boosted H channel and anticorrelated in the boosted W channel.
The uncertainty due to pileup modeling is evaluated by varying by ±5% the total inelastic
cross section used to calculate the pileup distribution. The systematic uncertainty in the HT
-based background reweighting procedure is taken to be the difference between the unweighted distribution and a distribution where the correction factor is applied twice.
Events / 20 GeV 20 40 60 80 100 120 140 160 180 0 W, 0 b ≥ Data TOP =0.8 TeV) x20 T (M T T EW =1.2 TeV) x60 T (M T T QCD Bkg. uncert. (13 TeV) -1 2.3 fb CMS min[M(l,j)] [GeV] 0 200 400 600 800 1000 std. dev. (data-bkg) −1 01 Events / 20 GeV 20 40 60 80 100 120 140 160 1 b ≥ 0 W, ≥ Data TOP =0.8 TeV) x20 T (M T T EW =1.2 TeV) x60 T (M T T QCD Bkg. uncert. (13 TeV) -1 2.3 fb CMS min[M(l,b)] [GeV] 0 200 400 600 800 1000 std. dev. (data-bkg) −1 01
Figure 7: Distributions of min[M(`, j)] in events without b-tagged AK4 jets (left) and
min[M(`, b)]in events with≥1 b-tagged AK4 jets (right) in the boosted W channel with all cat-egories combined. Also shown are the distributions of TT signal events with T quark masses of 0.8 and 1.2 TeV, scaled by factors of 20 and 60, respectively. The uncertainty in the background includes the statistical and systematic uncertainties described in Section 7.
min[M(l,j)] [GeV] < Events / GeV > 4 − 10 3 − 10 2 − 10 1 − 10 1 10 2 10 +jets, 0 W, 0 b µ e/ Data TOP =0.8 TeV) T (M T T EW =1.2 TeV) T (M T T QCD Bkg uncert. (13 TeV) -1 2.3 fb
CMS
min[M(l,j)] [GeV] 0 200 400 600 800 std. dev. (data-bkg) −1 01 min[M(l,j)] [GeV] < Events / GeV > 4 − 10 3 − 10 2 − 10 1 − 10 1 10 2 10 1 W, 0 b ≥ +jets, µ e/ Data TOP =0.8 TeV) T (M T T EW =1.2 TeV) T (M T T QCD Bkg uncert. (13 TeV) -1 2.3 fbCMS
min[M(l,j)] [GeV] 0 200 400 600 800 std. dev. (data-bkg) −1 01 min[M(l,b)] [GeV] < Events / GeV > 4 − 10 3 − 10 2 − 10 1 − 10 1 10 2 10 0 W, 1 b ≥ +jets, µ e/ Data TOP =0.8 TeV) T (M T T EW =1.2 TeV) T (M T T Bkg uncert. (13 TeV) -1 2.3 fbCMS
min[M(l,b)] [GeV] 0 200 400 600 800 std. dev. (data-bkg) −1 01 min[M(l,b)] [GeV] < Events / GeV > 4 − 10 3 − 10 2 − 10 1 − 10 1 10 2 10 2 b ≥ 0 W, ≥ +jets, µ e/ Data TOP =0.8 TeV) T (M T T EW =1.2 TeV) T (M T T Bkg uncert. (13 TeV) -1 2.3 fbCMS
min[M(l,b)] [GeV] 0 200 400 600 800 std. dev. (data-bkg) −1 01Figure 8: Distributions of min[M(`, j)] in the W + jets control region of the boosted W
chan-nel (upper) for 0/≥1 W tag categories (left/right), and min[M(`, b)] in the t¯t control region
of the boosted W channel (lower) for 1/≥2 b tag categories (left/right). Also shown are the
distributions of TT signal events with T quark masses of 0.8 and 1.2 TeV. The uncertainty in the background includes the statistical and systematic uncertainties described in Section 7.
The uncertainties in the PDFs used in MC simulation are evaluated from the set of NNPDF3.0 fitted replicas, following the standard procedure [55]. Renormalization and factorization scale uncertainties are calculated by varying the corresponding scales up or down (either indepen-dently or simultaneously) by a factor of two and taking as uncertainty the envelope, or largest spread, of all possible variations. These theoretical uncertainties are applied to the signal simu-lation as shape uncertainties, together with small normalization uncertainty contributions due to changes in acceptance.
The PDF and scale variation uncertainties affect both the normalization and shape of back-ground distributions for multijet (in the boosted W channel), Z + jets, and single top quark MC
samples. For the tt and W + jets backgrounds the theoretical and HT reweighting uncertainties
dominate the total uncertainty in this search, and theoretical uncertainties are treated differ-ently across the two channels. Changes of energy scale or parton momentum strongly influence
HT and therefore these uncertainties are correlated with the uncertainty in the HT reweighting
method. In the boosted H channel, only the uncertainty in the HT reweighting procedure is
considered as this uncertainty dominates over energy scale variations and PDF uncertainties, especially in the tails of the STdistribution. In the boosted W channel the uncertainty in the HT
14 8 Results
Table 2: Summary of the systematic uncertainties, along with numerical values and application to signal and/or background samples. The second column gives the magnitude of normal-ization uncertainties or the procedure used to evaluate shape uncertainties. The symbol σ in-dicates one standard deviation of the corresponding systematic uncertainty. Renormalization and factorization energy scale uncertainties are treated as shape-only for signal but include normalization uncertainties in background. Values stated for shape uncertainties indicate a representative range over the categories for the dominant backgrounds and/or signal.
Source Uncertainty Signal Background
Boosted W Boosted H Boosted W Boosted H
Int. luminosity 2.3% Yes All All
Diboson rate 15% No diboson diboson
Single t quark rate 20% No t t
QCD rate — 100% No — QCD
tt rate 5–12% 8.7% No tt tt
W + jets rate 4–20% 6.0% No W + jets W + jets
Trigger (e) 5% 2% Yes All All
Trigger (µ) 5% 1% Yes All All
Identification (e,µ) 1% 2% Yes All All
Isolation (e,µ) 1% — Yes All —
Pileup σinel.±5% Yes All (0–3%) All (0–3%)
Jet energy scale ±σ(pT, η) Yes All (0–12%) All (0–4)%
Jet energy res. ±σ(η) Yes All (0–8%) All (0–1)%
HTreweighting envelope(no weight,weight squared) No tt, W + jets, QCD(17–34%) tt, W + jets(13–21%)
b tag: b ±σ(pT) Yes All (0–16%) All (3–8%)
b tag: light flavors ±σ Yes All (0–6%) All (1–4%)
W/H tag: mass scale ±σ(pT, η) Yes All (0–3%) All (0–7%)
W/H tag: mass res. ±σ(η) Yes All (0–5%) All (0–7%)
H tag: efficiency 3% Yes All All
H tag: propagation — 5% Yes — All
W tag: τ2/τ1 ±σ — Yes All (0–2%) —
W tag: τ2/τ1 pT ±σ(pT) — Yes All (0–2%) —
Renorm./fact. scale envelope (×2,×0.5) Shape All (22–44%) Z + jets, t (2–23%) PDF ±σ Shape Z + jets, t, QCD (1–7%) Z + jets, t (0–13%)
reweighting dominates over the PDF uncertainty, but is comparable in shape and magnitude to the scale variation uncertainty, with scale variations providing the dominant uncertainty at low values of min[M(`, b)]. In this channel both HT reweighting and scale variation uncertainties
are considered for tt and W + jets backgrounds. All of these shared uncertainties are treated as correlated between the two analysis channels in the statistical interpretation of the results.
8
Results
Signal efficiencies for all possible final states of TT and BB production in the boosted W and boosted H channels (after combining all categories in each channel) are listed in Table 3 for two signal hypotheses with a high and a low vector-like quark mass. The values are derived by dividing the number of signal events that have the corresponding decay mode in each category by the number of expected events in the same decay mode before any selection. It can be seen that the selection applied in the boosted H channel is most efficient if a Higgs boson is present
in the final state, whereas the selection in the boosted W channel favors T→ bW decays, thus
Table 3: Signal efficiencies in the boosted W and boosted H event categories, split into the six possible final states, of both TT and BB production for two illustrative mass points. Efficiencies are calculated with respect to the expected number of events in the corresponding final state before any selection. The relative uncertainty in the efficiencies after combining systematic and statistical uncertainties in the MC samples is about 8% in the boosted W categories and about 12% in the boosted H categories.
Production process Decay mode Boosted W categories Boosted H categories
TT (0.8 TeV) tHtH 2.9% 8.7% tHtZ 3.2% 7.3% tHbW 5.8% 6.3% tZtZ 3.7% 5.6% tZbW 6.3% 4.2% bWbW 10.0% 2.5% TT (1.2 TeV) tHtH 3.6% 10.5% tHtZ 4.1% 9.0% tHbW 7.3% 7.1% tZtZ 4.7% 6.7% tZbW 8.3% 4.8% bWbW 13.2% 2.5% BB (0.8 TeV) bHbH 1.7% 1.9% bHbZ 1.3% 1.9% bHtW 5.8% 6.1% bZbZ 0.8% 1.4% bZtW 6.4% 4.2% tWtW 7.9% 5.7% BB (1.2 TeV) bHbH 1.7% 2.1% bHbZ 1.4% 1.9% bHtW 7.3% 7.1% bZbZ 0.8% 1.5% bZtW 8.2% 4.7% tWtW 11.4% 7.0%
fraction combinations of the T quark. For B quark decays the boosted W channel has high efficiency for the tW decays and reduced efficiency for the bZ/bH decays owing to the lack of semileptonic top quark decays. Similarly, the boosted H channel is most efficient for the bHtW final state since a leptonic decay is required as well as an H-tag.
In Fig. 9, min[M(`, j)]or min[M(`, b)] distributions are shown for each of the 8 tagging cat-egories in the boosted W channel after the final event selection, with the electron and muon
channels combined. Figure 10 shows distributions of ST in the H1b and H2b categories after
combining the electron and muon channels. As these two variables provide good discrimina-tion between signal and background in their respective categories, they are used for the final statistical interpretation of the data. In all plots, the TT signal distributions assume the singlet benchmark branching fractions. The event yields are given in Table 4.
After the final event selection, no significant excess above the SM expectations is observed in data. We set 95% CL upper limits on the cross section of TT production in various branching fraction scenarios. These limits are defined as Bayesian credible intervals [67] and are derived
using the THETA [68] program. Statistical uncertainties due to the finite size of the MC
16 8 Results min[M(l,j)] [GeV] < Events / GeV > 3 − 10 2 − 10 1 − 10 1 10 2 10 +jets, 0 W, 0 b µ e/ Data TOP =0.8 TeV) T (M T T EW =1.2 TeV) T (M T T QCD Bkg. uncert. (13 TeV) -1 2.3 fb CMS min[M(l,j)] [GeV] 0 200 400 600 800 1000 std. dev. (data-bkg) −1 01 min[M(l,j)] [GeV] < Events / GeV > 3 − 10 2 − 10 1 − 10 1 10 2 10 1 W, 0 b ≥ +jets, µ e/ Data TOP =0.8 TeV) T (M T T EW =1.2 TeV) T (M T T QCD Bkg. uncert. (13 TeV) -1 2.3 fb CMS min[M(l,j)] [GeV] 0 200 400 600 800 1000 std. dev. (data-bkg) −1 01 min[M(l,b)] [GeV] < Events / GeV > 3 − 10 2 − 10 1 − 10 1 10 2 10 +jets, 0 W, 1 b µ e/ Data TOP =0.8 TeV) T (M T T EW =1.2 TeV) T (M T T QCD Bkg. uncert. (13 TeV) -1 2.3 fb CMS min[M(l,b)] [GeV] 0 200 400 600 800 1000 std. dev. (data-bkg) −1 01 min[M(l,b)] [GeV] < Events / GeV > 3 − 10 2 − 10 1 − 10 1 10 1 W, 1 b ≥ +jets, µ e/ Data TOP =0.8 TeV) T (M T T EW =1.2 TeV) T (M T T QCD Bkg. uncert. (13 TeV) -1 2.3 fb CMS min[M(l,b)] [GeV] 0 200 400 600 800 1000 std. dev. (data-bkg) −1 01 min[M(l,b)] [GeV] < Events / GeV > 3 − 10 2 − 10 1 − 10 1 10 +jets, 0 W, 2 b µ e/ Data TOP =0.8 TeV) T (M T T EW =1.2 TeV) T (M T T Bkg. uncert. (13 TeV) -1 2.3 fb CMS min[M(l,b)] [GeV] 0 200 400 600 800 1000 std. dev. (data-bkg) −1 01 min[M(l,b)] [GeV] < Events / GeV > 3 − 10 2 − 10 1 − 10 1 10 1 W, 2 b ≥ +jets, µ e/ Data TOP =0.8 TeV) T (M T T EW =1.2 TeV) T (M T T Bkg. uncert. (13 TeV) -1 2.3 fb CMS min[M(l,b)] [GeV] 0 200 400 600 800 1000 std. dev. (data-bkg) −1 01 min[M(l,b)] [GeV] < Events / GeV > 3 − 10 2 − 10 1 − 10 1 10 3 b ≥ +jets, 0 W, µ e/ Data TOP =0.8 TeV) T (M T T EW =1.2 TeV) T (M T T Bkg. uncert. (13 TeV) -1 2.3 fb CMS min[M(l,b)] [GeV] 0 200 400 600 800 1000 std. dev. (data-bkg) −1 01 min[M(l,b)] [GeV] < Events / GeV > 3 − 10 2 − 10 1 − 10 1 3 b ≥ 1 W, ≥ +jets, µ e/ Data TOP =0.8 TeV) T (M T T EW =1.2 TeV) T (M T T Bkg. uncert. (13 TeV) -1 2.3 fb CMS min[M(l,b)] [GeV] 0 200 400 600 800 1000 std. dev. (data-bkg) −1 01
Figure 9: Distributions of min[M(`, j)] or min[M(`, b)] in the combination of electron and
muon channels in the boosted W categories with 0 (left) or≥1 (right) W-tagged jets and (upper
to lower) 0, 1, 2, or≥3 b-tagged jets. Also shown are the distributions of TT signal events with
T quark masses of 0.8 and 1.2 TeV. The uncertainty in the background includes the statistical and systematic uncertainties described in Section 7.
[GeV] T S 0 2000 4000 6000 < Events / 100 GeV > 4 − 10 2 − 10 1 2 10 4 10 6 10 8 10 (13 TeV) -1 ) fb µ 2.5 (e), 2.6 ( [GeV] T S 0 2000 4000 6000 std. dev. (data-bkg) −1 01 Data TOP =0.8 TeV) T (M T T EW =1.2 TeV) T (M T T QCD Bkg. uncert. CMS +jets, H1b µ e/ [GeV] T S 0 2000 4000 6000 < Events / 100 GeV > 6 − 10 4 − 10 2 − 10 1 2 10 4 10 6 10 (13 TeV) -1 ) fb µ 2.5 (e), 2.6 ( [GeV] T S 0 2000 4000 6000 std. dev. (data-bkg) −1 01 Data TOP =0.8 TeV) T (M T T EW =1.2 TeV) T (M T T QCD Bkg. uncert. CMS +jets, H2b µ e/
Figure 10: Distributions of ST in the H1b (left) and H2b (right) categories in the combination
of electron and muon channels. The TT signal, shown for T quark masses of 0.8 and 1.2 TeV, is normalized to the theoretical cross section and the singlet benchmark branching fractions are assumed. The uncertainty in the background includes the statistical and systematic uncertain-ties described in Section 7.
treated as nuisance parameters with log-normal priors for normalization uncertainties, Gaus-sian priors for shape uncertainties with shifted templates, and a flat prior on the signal cross section. The limits are then calculated by simultaneously fitting the binned marginal
likeli-hoods obtained from the min[M(`, b)] distributions in all boosted W categories and the ST
distributions in all boosted H categories. This creates a combined search with 20 categories after dividing into electron and muon channels: 16 categories from the boosted W channel and 4 categories with a boosted Higgs boson. The systematic uncertainties for these categories are correlated, as described in Section 7.
Results for the individual channels are shown in Fig. 11. The boosted W channel excludes T quarks decaying only to bW with masses below 910 GeV (870 GeV expected), and the boosted H channel excludes T quarks decaying only to tH for masses below 890 GeV (860 GeV expected). In Fig. 12 we present combined 95% CL upper limits on the TT production cross section for two VLQ benchmark branching fraction combinations: singlet (50% bW, 25% tZ/tH) and doublet (50% tZ/tH). For an electroweak singlet T quark, the observed (expected) upper limits on the production cross section range from 0.26 to 0.04 pb (0.31 to 0.04 pb) and we exclude masses below 860 GeV (790 GeV). For a doublet T quark, the observed (expected) upper limits on the production cross section range from 0.37 to 0.04 pb (0.34 to 0.03 pb) and we exclude masses below 830 GeV (780 GeV). The corresponding benchmarks for B quark production are shown in Fig. 13, and we can exclude masses below 730 GeV (720 GeV expected) for the singlet branching fraction combination while for the doublet scenario, no lower mass limit above 700 GeV was observed. Sensitivity to BB production in this search is limited by the single lepton selection efficiency for bZ and bH decays, as noted above. The combinations benefit from the difference
in discriminating variables between the channels: the min[M(`,b)] distributions used in the
boosted W channel provide good sensitivity to low-mass T quarks, while the peaking signal
shape in the ST distribution drives the combination at high masses. The observed exclusion
limits are stronger than expected due to an over-prediction of the background that remains
after the HT-based reweighting, particularly in categories with a W-tagged jet and several
b-tagged jets. This effect is not significant given the systematic uncertainty in the reweighting procedure.
18 9 Summary
Table 4: Number of events in each category after combining the electron and muon channels. Uncertainties include statistical and systematic components from Table 2, with uncertainty in the total background yield accounting for correlations across background processes. Yields of TT signal assume the theoretically predicted production cross section within the singlet branch-ing fraction scenario.
Sample 0 W, 0 b 0 W, 1 b 0 W, 2 b 0 W,≥3 b TT (0.8 TeV) 2.5±0.7 5.3±1.3 3.9±1.0 1.4±0.4 TT (1.2 TeV) 0.23±0.06 0.42±0.11 0.26±0.07 0.09±0.02 TOP 103±41 205±78 111±41 16.3±6.8 EW 460±160 80±30 10.7±4.0 0.6±0.2 QCD 14.1±6.3 6.2±3.7 <1 <1 Total bkg. 570±170 292±84 122±41 16.9±6.8 Data 588 288 131 14 Sample ≥1 W, 0 b ≥1 W, 1 b ≥1 W, 2 b ≥1 W,≥3 b TT (0.8 TeV) 3.3±0.9 6.6±1.7 4.2±1.1 1.0±0.3 TT (1.2 TeV) 0.34±0.09 0.52±0.13 0.27±0.07 0.06±0.02 TOP 71±26 111±42 56±20 7.6±3.3 EW 180±50 29.0±8.4 4.4±2.0 0.2±0.1 QCD 12.6±7.0 3.5±2.6 0.2±0.2 <1 Total bkg. 263±57 143±43 60±20 7.8±3.3 Data 274 155 45 7
Sample H1b category H2b category
TT (0.8 TeV) 21.5±2.1 4.4±0.7 TT (1.2 TeV) 1.5±0.2 0.31±0.05 TOP 1050±220 29.6±8.6 EW 45±11 2.5±0.9 QCD 50±55 4.4±5.1 Total bkg. 1150±260 37±12 Data 1204 43
Figure 14 shows expected and observed exclusion limits at 95% CL on the T quark mass, for a scan of possible branching fractions: we set lower mass limits with values ranging from 790 to
940 GeV for combinations withB(T→tH) + B(T→bW) ≥0.4. Compared to the combination
of many leptonic and hadronic search channels in√s = 8 TeV collision data corresponding to
an integrated luminosity of 19.7 fb−1, the current combination of two single lepton channels
produces similar expected exclusion limits. This represents an improved sensitivity to TT pair
production at √s = 13 TeV due to the increase in the TT production cross section from 8 to
13 TeV as well as to significant improvements in techniques for identifying boosted hadronic
massive-particle decays. For branching fraction scenarios withB(T→tH) + B(T→bW) ≥0.4
these results extend the excluded mass range of the 8 TeV search by up to 160 GeV.
9
Summary
The first search by CMS for pair-produced vector-like T and B quarks at√s = 13 TeV is
pre-sented, using data from proton-proton collisions recorded in 2015 corresponding to integrated luminosities of 2.3–2.6 fb−1. The search requires at least one lepton in the final state and is
op-T quark mass [GeV] 800 1000 1200 1400 1600 1800 )[pb] T (T σ 2 − 10 1 − 10 1 bW) = 1.0 → (T Β 0 H (13 TeV) -1 2.3 fb
CMS
95% CL upper limits Observed Expected 68% expected 95% expected T T → ppT quark mass [GeV]
800 1000 1200 1400 1600 1800 )[pb] T (T σ 2 − 10 1 − 10 1 tH) = 1.0 → (T Β H1b/H2b (13 TeV) -1 ) fb µ 2.5 (e), 2.6 (
CMS
95% CL upper limits Observed Expected 68% expected 95% expected T T → ppFigure 11: The expected and observed upper limits (Bayesian) at 95% CL on the cross section
of TT production for 100% T → bW in the boosted W channel (left), and 100% T → tH in the
boosted H channel (right). The theoretically predicted cross section for TT production calcu-lated at NNLO is shown as red line, with the uncertainties in the PDFs and renormalization and factorization scales indicated by the shaded area. Masses below 700 GeV were excluded previously.
T quark mass [GeV]
800 1000 1200 1400 1600 1800 )[pb] T (T σ 2 − 10 1 − 10 1 bW) = 0.5 → (T Β tZ,tH) = 0.25 → (T Β (13 TeV) -1 2.3/2.5/2.6 fb
CMS
95% CL upper limits Observed Expected 68% expected 95% expected T T → ppT quark mass [GeV]
800 1000 1200 1400 1600 1800 )[pb] T (T σ 2 − 10 1 − 10 1 tZ,tH) = 0.5 → (T Β (13 TeV) -1 2.3/2.5/2.6 fb
CMS
95% CL upper limits Observed Expected 68% expected 95% expected T T → ppFigure 12: The expected and observed upper limits (Bayesian) at 95% CL on the cross section of TT production for the singlet benchmark (left) and the doublet benchmark (right) after com-bining the boosted W and boosted H channels. The theoretically predicted cross section for TT production calculated at NNLO is shown as red line, with the uncertainties in the PDFs and renormalization and factorization scales indicated by the shaded area. Masses below 700 GeV were excluded previously.
20 9 Summary
B quark mass [GeV]
800 1000 1200 1400 1600 1800 )[pb] B (B σ 2 − 10 1 − 10 1 10 Β(B → tW) = 0.5 bZ,bH) = 0.25 → (B Β (13 TeV) -1 2.3/2.5/2.6 fb
CMS
95% CL upper limits Observed Expected 68% expected 95% expected B B → ppB quark mass [GeV]
800 1000 1200 1400 1600 1800 )[pb] B (B σ 2 − 10 1 − 10 1 10 Β(B → bZ,bH) = 0.5 (13 TeV) -1 2.3/2.5/2.6 fb
CMS
95% CL upper limits Observed Expected 68% expected 95% expected B B → ppFigure 13: The expected and observed upper limits (Bayesian) at 95% CL on the cross section of BB production for the singlet benchmark (left) and the doublet benchmark (right) after com-bining the boosted W and boosted H channels. The theoretically predicted cross section for BB production calculated at NNLO is shown as red line, with the uncertainties in the PDFs and renormalization and factorization scales indicated by the shaded area. Masses below 700 GeV were excluded previously.
tH) → B(T 0 0.2 0.4 0.6 0.8 1 bW) → B(T 0 0.2 0.4 0.6 0.8 1 700 750 800 850 900 950 < 700 710 770 790 830 860 < 700 720 770 800 830 730 770 790 820 790 800 820 830 840 870
95% CL expected T quark mass limit (GeV)
(13 TeV) -1 2.3/2.5/2.6 fb
CMS
tH) → B(T 0 0.2 0.4 0.6 0.8 1 bW) → B(T 0 0.2 0.4 0.6 0.8 1 700 750 800 850 900 950 < 700 < 700 800 840 870 890 710 790 830 860 880 820 840 860 880 870 870 880 900 900 94095% CL observed T quark mass limit (GeV)
(13 TeV)
-1
2.3/2.5/2.6 fb
CMS
Figure 14: The expected (left) and observed (right) at 95% CL lower limits (Bayesian) on the T
quark mass for a variety of T → tH and T → bW branching fraction combinations, indicated
by the coordinates at the center of each box, after combining the boosted W and boosted H channels. A limit of<700 GeV indicates that this search is not sensitive to T quark decays with that branching fraction combination.
timized for cases where a T quark decays to a boosted W or Higgs boson. No excess above the standard model background is observed and 95% confidence level upper limits are placed on the cross section of TT and BB production. For an electroweak singlet T quark, masses below 860 GeV are excluded, and for a doublet T quark, masses below 830 GeV are excluded. Consid-ering other possible branching fraction combinations for T quarks, and assuming that the sum of the branching fractions to bW, tH and tZ is equal to unity, we set lower mass limits that range
from 790 to 940 GeV for combinations withB(T→ tH) + B(T→bW) ≥ 0.4. These results
ex-tend the sensitivity of previous CMS searches for many possible T quark decay scenarios, and showcase the importance of new techniques for understanding highly-boosted final states in extending searches for new particles to higher masses.
Acknowledgments
We congratulate our colleagues in the CERN accelerator departments for the excellent perfor-mance of the LHC and thank the technical and administrative staffs at CERN and at other CMS institutes for their contributions to the success of the CMS effort. In addition, we grate-fully acknowledge the computing centers and personnel of the Worldwide LHC Computing Grid for delivering so effectively the computing infrastructure essential to our analyses. Fi-nally, we acknowledge the enduring support for the construction and operation of the LHC and the CMS detector provided by the following funding agencies: BMWFW and FWF (Aus-tria); FNRS and FWO (Belgium); CNPq, CAPES, FAPERJ, and FAPESP (Brazil); MES (Bulgaria); CERN; CAS, MoST, and NSFC (China); COLCIENCIAS (Colombia); MSES and CSF (Croatia); RPF (Cyprus); SENESCYT (Ecuador); MoER, ERC IUT, and ERDF (Estonia); Academy of Fin-land, MEC, and HIP (Finland); CEA and CNRS/IN2P3 (France); BMBF, DFG, and HGF (Ger-many); GSRT (Greece); OTKA and NIH (Hungary); DAE and DST (India); IPM (Iran); SFI (Ireland); INFN (Italy); MSIP and NRF (Republic of Korea); LAS (Lithuania); MOE and UM (Malaysia); BUAP, CINVESTAV, CONACYT, LNS, SEP, and UASLP-FAI (Mexico); MBIE (New Zealand); PAEC (Pakistan); MSHE and NSC (Poland); FCT (Portugal); JINR (Dubna); MON, RosAtom, RAS, RFBR and RAEP (Russia); MESTD (Serbia); SEIDI, CPAN, PCTI and FEDER (Spain); Swiss Funding Agencies (Switzerland); MST (Taipei); ThEPCenter, IPST, STAR, and NSTDA (Thailand); TUBITAK and TAEK (Turkey); NASU and SFFR (Ukraine); STFC (United Kingdom); DOE and NSF (USA).
Individuals have received support from the Marie-Curie program and the European Research Council and Horizon 2020 Grant, contract No. 675440 (European Union); the Leventis Foun-dation; the A. P. Sloan FounFoun-dation; the Alexander von Humboldt FounFoun-dation; the Belgian Fed-eral Science Policy Office; the Fonds pour la Formation `a la Recherche dans l’Industrie et dans l’Agriculture (FRIA-Belgium); the Agentschap voor Innovatie door Wetenschap en Technologie (IWT-Belgium); the Ministry of Education, Youth and Sports (MEYS) of the Czech Republic; the Council of Science and Industrial Research, India; the HOMING PLUS program of the Foun-dation for Polish Science, cofinanced from European Union, Regional Development Fund, the Mobility Plus program of the Ministry of Science and Higher Education, the National Science Center (Poland), contracts Harmonia 2014/14/M/ST2/00428, Opus 2014/13/B/ST2/02543, 2014/15/B/ST2/03998, and 2015/19/B/ST2/02861, Sonata-bis 2012/07/E/ST2/01406; the National Priorities Research Program by Qatar National Research Fund; the Programa Clar´ın-COFUND del Principado de Asturias; the Thalis and Aristeia programs cofinanced by EU-ESF and the Greek NSRF; the Rachadapisek Sompot Fund for Postdoctoral Fellowship, Chula-longkorn University and the ChulaChula-longkorn Academic into Its 2nd Century Project Advance-ment Project (Thailand); and the Welch Foundation, contract C-1845.

![Figure 7: Distributions of min [ M (` , j )] in events without b-tagged AK4 jets (left) and](https://thumb-eu.123doks.com/thumbv2/9libnet/3994815.54245/14.892.116.781.778.1048/figure-distributions-min-events-tagged-ak-jets-left.webp)
![Figure 8: Distributions of min [ M (` , j )] in the W + jets control region of the boosted W chan-](https://thumb-eu.123doks.com/thumbv2/9libnet/3994815.54245/15.892.122.781.157.682/figure-distributions-min-jets-control-region-boosted-chan.webp)