O
h
r
c
i
r
g
a
in
e
a
s
l
R
e
Elif Karadeli1, Ayla Uckuyu2, Faika Ceylan Ciftci2, Erzat Toprak2, Erdem Turhan2, Emel Ozcimen2, Emin Alp Niron1 1Department of Radiology, 2Department of Obstetrics and Gynecology, Baskent University, Faculty of Medicine, Turkey
Renal Doppler Ultrasound, Polycystic Ovary Syndrome
Polycystic Ovary Syndrome: The Correlation Between
Renal Doppler Ultrasound and Laboratory Parameters
Polikistik Over Sendromu: Laboratuvar
Parametreleri, Renal Doppler Ultrasonografi İlişkisi
DOI: 10.4328/JCAM.3409 Received: 25.03.2015 Accepted: 06.04.2015 Printed: 01.05.2016 J Clin Anal Med 2016;7(3): 345-50 Corresponding Author: Elif Karadeli, Department of Radiology, Baskent University, Faculty of Medicine, Adana, Turkey.
T.: +90 3223272727 F.: +90 3223271274 E-Mail: [email protected]
Özet
Amaç: Tansiyonu normal olan üreme çağındaki polikistik over sendromlu (PKOS) kadınlarda sağ ve sol böbrek uzunluğu, parankim kalınlığı, renal arte-riyel, venöz kan akımı ölçümlerinde farklılık olup olmadığını araştırmak. Gereç ve Yöntem: Rotterdam kriterlerine göre PKOS tanısı almış 40 kadın olgu ve 36 sağlıklı kadın olgu çalışmaya dahil edildi. Hormonal, biyokimyasal analiz, renal Doppler ultrasonografi yapıldı, sağ ve sol böbrek uzunluğu, parankim kalınlığı, pik sistolik velosite (PSV), rezistiv indeks (RI) ,venöz impedans indeksi(VI), in-sülin rezistansı, bozulmuş glikoz toleransı, serum lipid konsantrasyonu araştı-rıldı. Student t testi ve pearson korelasyon testi istatistik analiz için kullanıl-dı. Bulgular: Böbreklerin ölçümleri açısından PKOS’lu ve sağlıklı kadınlar ara-sında fark yoktu. Ana renal arterin pik sistolik velositesi PKOS’lu grupta daha düşüktü. Ana renal venöz impedans PKOS’lu grupta kontrol grubundan daha yüksekti. Ana renal rezistif indeks PKOS’lu grupta daha yüksekti, fakat istatis-tiksel olarak önemli değildi. Tüm olguları içeren bivariate analizde, ana böb-rek uzunluğu, ana parankim kalınlığı ölçümleri ile BMI, bel kalça oranı, serum açlık glikoz, insülin, LDL, tirgliserit seviyeleri pozitif ilişkiliydi. Tartışma: Biz PKOS’lu normotansif üreme çağındaki kadınlarda böbrek kan akımında deği-şiklikler olduğunu bulduk . Bu bulgular PKOS’un uzun önem renal ve kardiyo-vasküler komplikasyonlarının sonucunu gösteriyor olabilir.
Anahtar Kelimeler
Doppler Ultrasonografi; Polikistik Over Sendromu
Abstract
Aim: To investigate whether there is alteration both right and left kidney lenght, parenchymal thickness, renal arterial,venous blood flow measure-ments in normotensive reproductive age women with polycystic ovary syn-drome (PCOS). Material and Method: Forty women with PCOS according to Rotterdam criteria and thirty-six healthy volunteers women were included in our study. Hormonal, biochemical analysis, renal Doppler ultrasonography were performed and were investigated in terms of both left and right renal lenght, parenchymal thickness, peak systolic velocity (PSV), resistive index (RI), venous impedance index (VI), metabolic characteristics having insulin resistance, impaired glucose tolerance, serum lipid concentration. The stu-dent t test and pearson corelation test were used for statistical analysis. Results: The measurements for kidneys were not different between women with PCOS and healthy women. The peak systolic velocity of mean renal ar-tery was lower in PCOS group. The mean renal venous impedance also was higher in PCOS group than control group. The mean renal resistive index was slightly higher in PCOS but not statistical significant. In bivariate corelation analyse including all patients, it was seen that BMI, WHR, level of serum fasting glucose, insulin, LDL, trigliserides were positively related with mean renal length and mean parenchymal thickness measurements. Discussion: We found that there was alterations kidney blood flow in normotensive reproduc-tive age women with PCOS. This findings may indicate results of long term renal and cardiovascular complications of PCOS.
Keywords
Polycystic Ovary Syndrome; Renal Doppler Ultrasound
Renal Doppler Ultrasound, Polycystic Ovary Syndrome
Introduction
Polycystic ovary syndrome (PCOS) is one of the most com-mon endocrinopathies in women of fertile age and affects up to 6–7% of this population [1] . Using the Rotterdam consen-sus criteria could increase the prevalence of PCOS by at least 65%. PCOS according to Rotterdam consensus criteria should be defined by the presence of at least three to two (1- chronic anovulation 2-clinical and/or biochemical hyperandrogenism 3- polycystic ovaries on ultrasound) with the exclusion of other androgen excess or related disorders [2]. It has been recognized that PCOS is associated with metabolic abnormalities such as insulin resistance, dyslipidemia, chronic low-grade inflamma-tion, and arterial hypertension[3]. Recently, most studies have linked PCOS with a potentially increased risk of cardiovascular disease [4].
Hypertension has a high prevalence in woman with PCOS in the perimenopausal period. Metabolic disturbances is expected to be less common in the phenotypically heterogenous group of PCOS patients diagnosed by Rotterdam criteria.
Overall, of major concern is to what extent the PCOS-related metabolic abnormalities translate into increased cardiovascu-lar (CV) morbidity and mortality in these women. Recent data in postmenopausal women show that PCOS is associated with an increased rate of CV events, which is partly independent of the presence of obesity, diabetes and MS, and partly dependent on the degree of hyperandrogenemia [5] Thus, the burdens of CV risk conferred by PCOS and by MS, respectively, appear to be not identical, but additive. PCOS emerges as an independent predictor of CV complications after menopause.
PCOS long term consequence lead to hypertension, atheroscle-rosis, proteinuria. It was reported previously that first finding of impared renal function was variance of renal hemodinamics [6]. As is known, B-mode ultrasonography is stil first radiologic method in the evaluation of native renal dysfunction. Renal length, cortical thickness and parenchymal echogenicity and collecting system dilatation are examined. In spite of these parameters correlate well with hystopathology, usually, these values may help in assesment disease chronicity rather than hystopathology[7]. Since 1980-1990 years, renal Doppler so-nography has been used primarily for the screening of renovas-cular disease in native and transplant kidneys [8] .
Doppler sonography is a nonivasive method of evaluation of lo-cal vascular resistance, such as resistance index [RI). Especially, renal RI values are useful for the assesment of renal paren-chymal damage and may provide a reliable parameter of renal atherosclerosis [9]. In addition, RI values of intrarenal arteries gives information about severity of target organ damage in diseases as hypertension, diabetes mellitus and chronic renal failure [10].
The purpose of the present cross sectional case-control study was to compare between women with PCOS and healthy con-trol and make correlations the Doppler parameters of renal ar-tery, the interlobar arteries, renal vein including synchronously obtained serum glucose, insulin, lipid levels, other parameters. Material and Method
In this study, after the evaluation of medical history, physical / gynecologycal examination and transvaginally ultrasonography
was performed. The diagnosis of PCOS was made according to the criteria of the Rotterdam ESHRE ASRM- sponsored PCOS consensus workshop group (2004) where 2 out of 3 criteria were present: 1- oligo and/or anovulation (menstrual cycle be-tween 35-50 days or secondary amenorrhea and/or anovula-tion); 2- clinic and/or biochemical signs of hyperandrogenism [Ferriman-Gallway modified score ≥8 and/or acne, and /or hy-perandrogenemia: total testosterone (T) >0,6 ng/ml (2 nmol/l); 3- polycystic ovaries (PCO), identified by transvaginal ultraso-nography (presence of ≥12 follicles in each ovary, measuring 2-9 mm in diameter and/or increased ovarian volume>10cm³) [2].
This study was approved by Baskent University Institutional Re-view Board and Ethics Committee (Project no: KA09/262) and supported by Baskent University Research Fund. After receiving local ethical approval, written informed consent was obtained from all patients before enrollment. Patients had no pregnancy. None of the patients had any other chronic kidney, systemic, endocrin disease such as Type 2 Diabetes mellitus or hyper-tension, the basis of clinical history and physical examination, routine blood tests. None of the patients had pharmacological treatment for PCOS-related disorders, including oral contrasep-tive, antiandogenic drugs, insulin sensitizer drugs, antiplatelet drugs. Smoking patients were excluded. Clinic blood pressure (BP) measurements were performed with a mercury phygmo-manometer. Patients having hypertension is defined as systolic BP greater than 140 mm Hg and/or diastolic BP greater than 90 mm Hg were not included in the study. Women having pre-vious history of kidney stone, kidney operation, pregnancy in-duced hypertention were excluded.
Ultrasonography was performed by 6,5mHz micro-convex transvaginal probe (Voluson 730 Pro, General Electric Co,USA). Ultrasound examination was carried out on second or thirth day of natural menses. Follicle which is smaller than 10mm diame-ter was coundiame-tered. Antral follicle count (AFC) were recorded to-tally for both ovary. Hormone profile ( luteinizing hormone (LH), Total testosterone, free tetosterone, tiroid stimulan hormone (TSH), insulin), and biochemistry profile (Fasting Glucose, HDL, LDL, Triglyceride, OGTT (75g)) were performed on the same day with ultrasound evaluation. Renal Doppler evaluation was also performed on the same day with other procedurs.
Anthropometric measurements were obtained at the umbilicus (waist circumference) and at the most prominent buttock level (hip circumference); their ratio (waist-to-hip ratio, WHR) was considered as a measure of body fat distribution. Insulin resis-tance was calculated using the HOMA index. HOMA index was calculated as: [fasting plasma insulin (μU/ml) × fasting plasma glucose (mmol/l)]/ 22.5. As we obtained glucose levels in g/dl, we had to multiply our data by 0.055 to change them to mmol/l for the calculation of HOMA index [11].
Laboratory Analysis
A blood venous sample was obtained after an overnight fasting to assess biochemical data.
Fasting glucose, high-density lipoprotein (HDL) cholesterol, low-density lipoprotein (LDL) cholesterol, and triglyceride (TG) levels were measured with original kits using an Abbott-Aeroset autoanalyzer (Chicago, IL, USA). Serum levels of FSH, LH, insulin
Renal Doppler Ultrasound, Polycystic Ovary Syndrome
were measured by microparticle enzyme immunoassay method (MEIA) in an AXSYM autoanalyzer. Serum total testosterone levels were measured by solid-phase competetive chemilumi-nescent enzyme immunassay in an Immulite 2000 autoanalyzer using BIODPC reagents.
Renal Doppler Ultrasonography
All patients with polycystic overian syndrome and healthy control subjects were examined by B-mode and duplex Dop-pler ultrasound using a commercially avaliable colour dopDop-pler scanner (Sonoline Antares, Siemens, Germany) with a 5 MHz convex probe. All examinations were performed with the pa-tient in the fasting state after 30 minutes of rest. Both kidneys were scanned in all women in the lateral decubitus position. All examinations were performed by the same radiologist to avoid interobserver variability. Cortical thickness and long axis of kidney were meausured and parenchyma echogenicity was determined.
Doppler spectra were obtained from the arcuate arteries at the corticomedullary junction. The Doppler angle was maintaned between 30 and 60 degrees to correct for the angle between the axis of the beam and the vessels. At least three resistive index ( RI) measurements were obtained in the lower pole, mid-portion, and upper pole, then were averaged for each kidney at each session. The peak systolic velocity and resistive index ( RI) of both main renal arteries and the peak venous flow signal and least flow signal of both main renal veins were calculated. Cortical thickness, echogenicity , and intrarenal RI values, peak systolic velocity and RI values of the main renal artery, peak venous velocity and least venous velocity were recorded in each of the kidney in all patients with polycystic overian syndrome and healthy control subjects. Venous impedance index was cal-culated as: (peak venous velocity- least venous velocity) / peak venous velocity .
Statistics
Statistical analysis were performed using SPSS 10.0 (SPSS for Windows 10.0; Chicago, IL, USA). Groups were compared us-ing student t test. When parametric tests were not appropriate, Mann-Whitney U test was used. For the analysis of categori-cal variables, we used the χ2 test and Fisher exact test, where available. Pearson’s correlation analysis was used to test uni-variate relations. A p value <0.05 was considered significant.
Results
There was not significant difference between PCOS and control groups in terms of age, body mass index (BMI), waist-to-hip ratio (WHR), systolic and diastolic blood pressure (BP) [Table 1]. The rate of hirsutism/acne, oligomenorrhea, impaired
glu-cose tolerance (IGT) and serum LH level and ovarian AFC in second day of cycle and serum total testorone were higher in with PCOS women than control healty women [Table 2]. 1- Kidneys size: There was no difference between the right renal length (RRL) (107,1mm) and the left renal length (LRL) (106,9mm). Both kidneys length were slightly lower (statisti-cally nonsignificant) in PCOS women [Table 3]. Both lengths correlated significantly and positively with BMI, WHR, fasting glucose, insulin, HOMA, LDL.
2- Kidneys parenchymal thickness: Right and left kidney paren-chymal thickness had similar patterns (respectivelly 13,84mm and 14,04mm). Both kidney parenchymal thickness also had no difference between two groups (Table 3). Both kidney parenchy-mal thickness correlated significantly and positively with BMI, fasting glucose, insulin, HOMA, trigliseride.
3- Kidney arteries PSV: There was no difference between right and left renal arteries PSV (respectivelly 94,8cm/sec; 95,7cm/ sec p>,05). In women with PCOS, average renal PSV and left renal PSV were significantly lower than healty women (respec-tively p=,001, p=,015) (Table 3). PSV correlated significantly and negatively with insulin, HOMA [Table 4].
3- Kidney arteries RI: There was no difference between right and left renal arteries RI (respectivelly 0,636; 0,629 : p>,05). In women with PCOS, average renal RI was slightly higher than healty women (statistically unsignificant) (p=,062). RI correlated significantly and positively with insulin and HOMA, negatively HDL (Table 4). Mean RI of upper, middle, bottom lobar renal arteries were not difference between two groups.
4- Venous impedance (VI) index: Right and left kidney veins had different impedance index (respectivelly 0,48; 0,41 p<,05). In women with PCOS, average renal VI index and left renal VI
in-Table1. Anthropometrical characteristics of PCOS and control group. characteristics PCOS group
N:40 Mean ±SD Control group N:36 Mean ±SD P value Age (year) 26,43±4,76 28,034,03± ,117 BMI 28,93±6,73 29,03±3,56 ,855 Waist Circumference (cm) 84,85±13,81 82,83±7,04 ,635 Hip Circumference (cm) 108,35±14,50 107,53±9,43 ,868 WHR ,78±,04 ,77±,03 ,768 Systolic BP (mmHg) 120,67±10,21 118,89±8,45 ,687 Diastolic BP (mmHg) 81,56±4,59 79,34±5,13 ,876
Legend 1: BMI: Body mass index, WHR: Waist-to- hip ratio, BP: Blood pressure
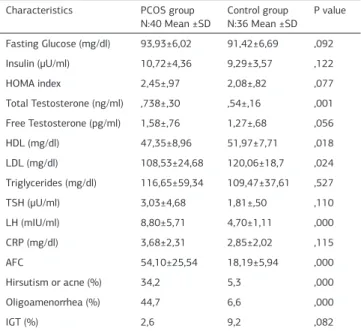
Table 2. Clinic and biochemical characteristics of PCOS and control group Characteristics PCOS group
N:40 Mean ±SD Control group N:36 Mean ±SD P value Fasting Glucose (mg/dl) 93,93±6,02 91,42±6,69 ,092 Insulin (μU/ml) 10,72±4,36 9,29±3,57 ,122 HOMA index 2,45±,97 2,08±,82 ,077 Total Testosterone (ng/ml) ,738±,30 ,54±,16 ,001 Free Testosterone (pg/ml) 1,58±,76 1,27±,68 ,056 HDL (mg/dl) 47,35±8,96 51,97±7,71 ,018 LDL (mg/dl) 108,53±24,68 120,06±18,7 ,024 Triglycerides (mg/dl) 116,65±59,34 109,47±37,61 ,527 TSH (μU/ml) 3,03±4,68 1,81±,50 ,110 LH (mIU/ml) 8,80±5,71 4,70±1,11 ,000 CRP (mg/dl) 3,68±2,31 2,85±2,02 ,115 AFC 54,10±25,54 18,19±5,94 ,000 Hirsutism or acne (%) 34,2 5,3 ,000 Oligoamenorrhea (%) 44,7 6,6 ,000 IGT (%) 2,6 9,2 ,082
Legend 2: Student t test, HOMA index, homeostasis model assessment index: HDL: High-density lipoprotein, LDL: Low-High-density lipoprotein, TSH: thyroid-stimulating hormone, LH: (in second day of cycle), CRP: c-reactive protein, AFC: Antral follicle count (in second day of cycle), IGT: Impaired glucose tolerance.
Renal Doppler Ultrasound, Polycystic Ovary Syndrome
dex were significantly higher than healty women (respectively p=,009, p=,007) [Table 3].
Discussion
PCOS is a metabolic disorder which have contraversial defini-tion yet. PCOS may cover to the differ extends of the glucose and lipid metabolism abnormalities. Obesity is common in PCOS and affects between 30–70% of women depending on the set-ting of the study and the ethnical background of the subjects. In Western society, incidence and prevalans of overweight/obesity increase recently [12]
Our population also have included large amount overweight women who have average BMI was 29. The overweight/obesity lead to impaired glycemic control and insulin resistance. There is evidence concerning the relationship between renal dysfunction and cardiovascular risk in non-diabetic patients. Even minor renal dysfunction causes a dramatic increase in car-diovascular risk. PCOS not only is a reproductive endocrinopa-thy but, like the metabolic syndrome, is associated with
long-term health risks including insulin resistance, diabetes mellitus, dyslipidemia, hypertension, and premature atherosclerosis [13]. Based on the prevalence of these risk factors, PCOS patients have an estimated 4–11-fold increased risk for coronary heart disease[14] . Epidemiologic studies have documented that dia-betes and hypertension are the major risk factors for the devel-opment and progression of chronic kidney disease (CKD)[15,16]. Chen et al suggested that the insulin resistance and concomi-tant hyperinsulinemia are presented in CKD patients without clinical diabetes [17]. They also suggest that even mildly el-evated blood pressure (130/85 mm Hg) or serum glucose levels (110 mg/dL) are associated with an increased risk for chronic kidney disease and microalbuminuria [18] .
In recent years, advanced ultrasonography transducers have led to inreased tissue information and spatial and contrast resolu-tion. Consequently, these improvements simplified to evaluation of renal anatomic details as dimension, thickness and echo-genicity of the renal cortex. These morphologic parameters are important, because ultrasonography shows findings of irrevers-ible renal parenchymal disease as decrease in renal size, pa-renchymal atrophy, sclerosis and fibrosis [7]. In addition, it can help to assess prognosis and avoid unnecessary diagnostic or therapeutic procedures. Especially, this radiologic method show a smaller kidney with parenchymal atrophy is diabetic nephrop-athy, the leading cause of chronic and end-stage renal failure in developed countries in recent years [19].
To our knowledge, there is no study investigating renal size measurements in women with PCOS. Whereas, the studies related to the normal ultrasonographic measurements of the kidney in adult volunteers has been reported by Emamian SA et al [20]. They demonstrated that renal dimensions and paren-chymal volume were correlated with age, height, weight, body mass index, and total body area. Median renal lengths were 11.2 cm on the left side and 10.9 cm on the right side. Renal size decreased with age, almost entirely because of parenchy-mal reduction. Renal length decreased with age and the rate of decline accelerates alter 60 years of age. Renal volume cor-related best with total body area. Renal length corcor-related best with body height [21]. It was known that there is a trend both for the right and left kidney longitudinal lengths to increase un-til reptoductive age .
Enamian et al demonstrated that renal size unchange in normal situation. In our study, renal size, cortical echogenicity and pa-renchymal thickness of all kidneys were normal. There was no difference between the right renal length (RRL) and the left re-nal length (LRL) . Both right and left kidney length were slightly lower (statistically nonsignificant) in women with PCOS (Table 3).
Color Doppler ultrasonography is noninvasive method for as-sesment renal vascular function. It meaures blood flow velocity in the renal circulation within small parenchymal arteries. The resistive index ( RI) shows vascular resistance and increase of this value demonstrates diseases of tubulointerstitial or vas-cular system. As is known, RI is an age-dependent parameter. Bude et al showed that RI in patents older than 60 years tends to be higher than in younger adults [22].
The peak systolic velocity (PSV) is direct proportional with flow volume ( left ventricle beat volume). In addition, PSV is inversely
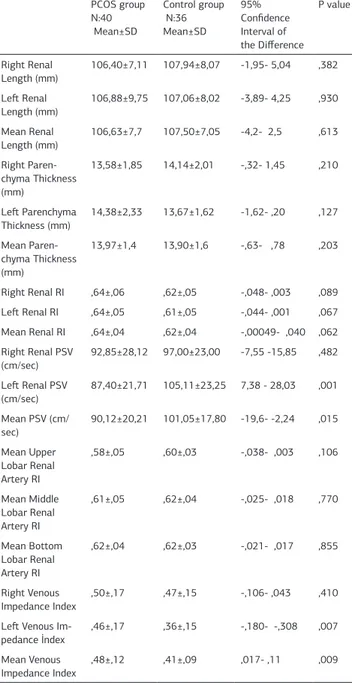
Table 3. Comparison of arterial and venous blood flow parameters and renal biometric measurements right and left kidney in PCOS and control groups.
PCOS group N:40 Mean±SD Control group N:36 Mean±SD 95% Confidence Interval of the Difference P value Right Renal Length (mm) 106,40±7,11 107,94±8,07 -1,95- 5,04 ,382 Left Renal Length (mm) 106,88±9,75 107,06±8,02 -3,89- 4,25 ,930 Mean Renal Length (mm) 106,63±7,7 107,50±7,05 -4,2- 2,5 ,613 Right Paren-chyma Thickness (mm) 13,58±1,85 14,14±2,01 -,32- 1,45 ,210 Left Parenchyma Thickness (mm) 14,38±2,33 13,67±1,62 -1,62- ,20 ,127 Mean Paren-chyma Thickness (mm) 13,97±1,4 13,90±1,6 -,63- ,78 ,203 Right Renal RI ,64±,06 ,62±,05 -,048- ,003 ,089 Left Renal RI ,64±,05 ,61±,05 -,044- ,001 ,067 Mean Renal RI ,64±,04 ,62±,04 -,00049- ,040 ,062 Right Renal PSV (cm/sec) 92,85±28,12 97,00±23,00 -7,55 -15,85 ,482 Left Renal PSV (cm/sec) 87,40±21,71 105,11±23,25 7,38 - 28,03 ,001 Mean PSV (cm/ sec) 90,12±20,21 101,05±17,80 -19,6- -2,24 ,015 Mean Upper Lobar Renal Artery RI ,58±,05 ,60±,03 -,038- ,003 ,106 Mean Middle Lobar Renal Artery RI ,61±,05 ,62±,04 -,025- ,018 ,770 Mean Bottom Lobar Renal Artery RI ,62±,04 ,62±,03 -,021- ,017 ,855 Right Venous Impedance Index ,50±,17 ,47±,15 -,106- ,043 ,410 Left Venous
Im-pedance İndex
,46±,17 ,36±,15 -,180- -,308 ,007 Mean Venous
Impedance Index ,48±,12 ,41±,09 ,017- ,11 ,009 Legend 3: RI: Resistive index, PSV : Peak systolic velocity,
Renal Doppler Ultrasound, Polycystic Ovary Syndrome
proportional with vascular diameter and elasticity of blood ves-sel wall. The normal frequency spectrum presents the typical form of a flow pulse, with low subsequent vascular resistance. In adults, the normal PSV is average 120 ±12 cm/sec (100–180 cm/sec) and the end-diastolic flow velocity is 20-50 cm/ s [8,23]. The kidneys offer a low resistance vascular bed, thus the Dop-pler spectral waveform from the normal kidney is that of a constant forward diastolic flow. In renal parenchymal disease, there is increase vascular resistance which in turn causes a de-crease in the diastolic flow component and inde-creased pulsatility of the Doppler spectral waveform. Parenchymal diastolic flow velocities less than 20 per cent of the peak systolic velocity are consistent with renal parenchymal disease. In renal artery stenosis, the PSV shows an increase of more than 150cm/sec. When vascular resistance is low, peak systolic velocity and peak flow volume increase with increasing blood pressure. Spon-taneous variations in subject’s systolic blood pressure were positively correlated with peak systolic volume and peak flow volume. Low resistance flow is blood pressure dependent [24]. Decreased PSV could show inceased vascular resistance. We found the lower PSV in PCOS women.
Color doppler ultrasound shows renal vascular resistance using
RI value, which corresponds to peak systolic velocity minus end-diastolic velocity divided by peak systolic velocity. The RI values are calculated in the segmental, interlobar, and arcuate arter-ies, these values are normally below 0.70 except significantly higher in elderly persons and in those younger than 6 years [24]. The effects of variation in vessel angulation and size are nul-lified in the calculation of these indexes [25]. Various abnor-mal waveforms may be compared by calculating the RI and PI. Physiologic events that alter vascular resistance and thus affect waveforms include exercise, changes in gravity orientation and stress level, and digestion [25].
Changes in the intrarenal arterial RI values are associated with diseases as urinary obstruction, various renal disorders, renal vascular disease, renal scarring . The RI provides information about arterial impedance. The pressure differential between the systole and diastole was shown to be a major factor influencing RI, along with the vascular compliance and the cross-sectional area of the downstream vascular bed [26].
In our study, there was no difference between RI values of right and left renal arteries (respectivelly 0,636; 0,629 : p>,05). In women with PCOS, average renal RI was slightly higher than healty women (statistically unsignificant) (p=,062). RI correlated
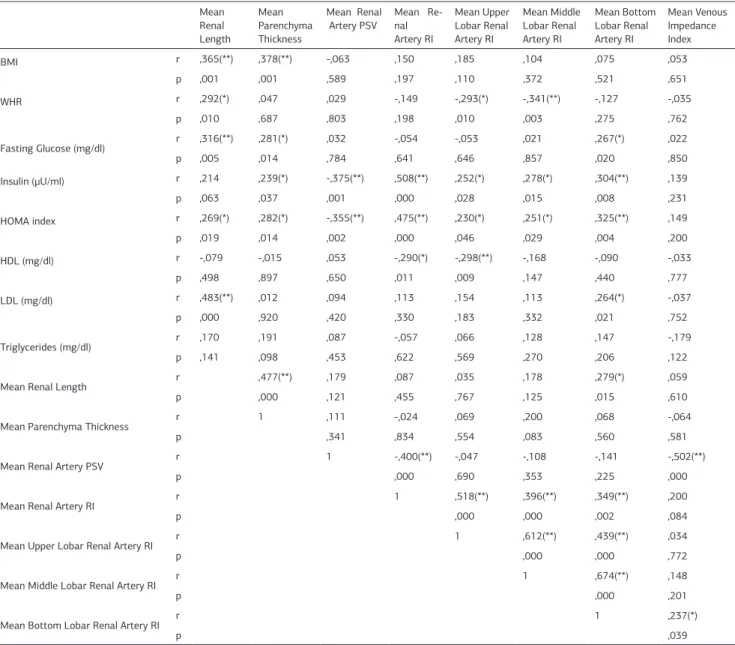
Table 4. Corelations of renal blood flow parameters with biochemical and clinic characteristics in all patients. Mean Renal Length Mean Parenchyma Thickness Mean Renal Artery PSV Mean Re-nal Artery RI Mean Upper Lobar Renal Artery RI Mean Middle Lobar Renal Artery RI Mean Bottom Lobar Renal Artery RI Mean Venous Impedance Index BMI r ,365(**) ,378(**) -,063 ,150 ,185 ,104 ,075 ,053 p ,001 ,001 ,589 ,197 ,110 ,372 ,521 ,651 WHR r ,292(*) ,047 ,029 -,149 -,293(*) -,341(**) -,127 -,035 p ,010 ,687 ,803 ,198 ,010 ,003 ,275 ,762 Fasting Glucose (mg/dl) r ,316(**) ,281(*) ,032 -,054 -,053 ,021 ,267(*) ,022 p ,005 ,014 ,784 ,641 ,646 ,857 ,020 ,850 Insulin (μU/ml) r ,214 ,239(*) -,375(**) ,508(**) ,252(*) ,278(*) ,304(**) ,139 p ,063 ,037 ,001 ,000 ,028 ,015 ,008 ,231 HOMA index r ,269(*) ,282(*) -,355(**) ,475(**) ,230(*) ,251(*) ,325(**) ,149 p ,019 ,014 ,002 ,000 ,046 ,029 ,004 ,200 HDL (mg/dl) r -,079 -,015 ,053 -,290(*) -,298(**) -,168 -,090 -,033 p ,498 ,897 ,650 ,011 ,009 ,147 ,440 ,777 LDL (mg/dl) r ,483(**) ,012 ,094 ,113 ,154 ,113 ,264(*) -,037 p ,000 ,920 ,420 ,330 ,183 ,332 ,021 ,752 Triglycerides (mg/dl) r ,170 ,191 ,087 -,057 ,066 ,128 ,147 -,179 p ,141 ,098 ,453 ,622 ,569 ,270 ,206 ,122
Mean Renal Length r ,477(**) ,179 ,087 ,035 ,178 ,279(*) ,059
p ,000 ,121 ,455 ,767 ,125 ,015 ,610
Mean Parenchyma Thickness r 1 ,111 -,024 ,069 ,200 ,068 -,064
p ,341 ,834 ,554 ,083 ,560 ,581
Mean Renal Artery PSV r 1 -,400(**) -,047 -,108 -,141 -,502(**)
p ,000 ,690 ,353 ,225 ,000
Mean Renal Artery RI r 1 ,518(**) ,396(**) ,349(**) ,200
p ,000 ,000 ,002 ,084
Mean Upper Lobar Renal Artery RI r 1 ,612(**) ,439(**) ,034
p ,000 ,000 ,772
Mean Middle Lobar Renal Artery RI r 1 ,674(**) ,148
p ,000 ,201
Mean Bottom Lobar Renal Artery RI r 1 ,237(*)
p ,039
Renal Doppler Ultrasound, Polycystic Ovary Syndrome
significantly and positively with insulin and HOMA, negatively HDL (Table 4). Mean RI of upper, middle, bottom lobar renal arteries were not difference between two groups. We thought that higher RI values in women with PCOS might be indicate early period of atherosclerosis . Especially, relationship be-tween RI and insulin values may be important to determine mild vascular changes.
The average flow velocity (Vmean) values of renal vein are given in the literature as 10-20 cm/ s. The flow in the renal veins is generally continuous, but mild fluctuations may be seen as a reflection of respiration and right atrial contraction [27]. The flow pattern in intrarenal veins depends on renal paren-chymal histology and cardiac physiology. The intrarenal venous impedance index obtained by Doppler ultrasound is related to compliance in vein, and can be helpful in the assessment of renal parenchymal compliance.
renal hemodynamics. Microalbuminuria and reduced glomerular filtration rate (GFR) are two different aspects of renal dysfunc-tion. It is known that renal hemodynamics associated with mi-croalbuminuria and reduced GFR [6]. We did not investigated to linked with renal hemodynamics and renal biometry in this study.
Potential limitations of our study should be noted. First, the cross-sectional study design makes it difficult to infer causality between the PCOS and risk for chronic kidney disease. Second, study population were heterogen in terms of age, BMI (both obes and lean), having insulin resistance. If it is created a pa-tient subgroup with obesity and insulin resistance papa-tient, It could obtain whether causes of hemodynamic alterations are PCOS or insülin resistance. It was suggested by Chen that the metabolic syndrome and insulin resistance might be an impor-tant factor in the cause of chronic kidney disease and microal-buminuria [18].
Third, in our study, it is indeterminate patient to what extent period with PCOS. As renal and vascular effect consist during long term period, our findings may be weak than expected re-ally. Fourth, the disadvantages of renal doppler ultrasound in-clude decreased reliability in a patient who is not fasting and/ or is obese, a high level of operator dependence, and poor de-tail resolution. But, renal doppler ultrasound examination was done by one radiologist for decrease of these disadvantages. Another limitation of our study is that we did not investigate the waveform in the inferior vena cava which might likely be altered and affect the intrarenal venous waveform.
In conclude, we suggested that there was alterations especially kidney blood flow in normotensive reproductive age women with PCOS. This findings may explain to results of long term renal and vascular complications of PCOS. However, a further study with a wider selected subgroups is required.
Competing interests
The authors declare that they have no competing interests. References
1. Azziz R, Woods KS, Reyna R, Key TJ, Knochenhauer ES, Yildiz BO. The prevalence and features of the polycystic ovary syndrome in an unselected population. J Clin Endocrinol Metab 2004;89(6):2745-9.
2. Rotterdam ESHRE/ASRM-sponsored PCOS consensus workshop group. Revised 2003 consensus on diagnosis criteria and long-term health risks related to poly-cystic ovary disease (PCOS). Hum Reprod 2004;19(1):41-7.
3. Dokras A. Cardiovascular disease risk factors in polycystic ovary syndrome. Semin Reprod Med 2008;26(1):39-44.
4. Lo JC, Feigenbaum SL, Yang J, Pressman AR, Selby JV, Go AS. Epidemiology and adverse cardiovascular risk profile of diagnosed polycystic ovary syndrome.J Clin Endocrinol Metab 2006;91(4):1357-63.
5. Shaw LJ, Bairey Merz CN, Azziz R, Stanczyk FZ, Sopko G, Braunstein GD, et al. Postmenopausal women with a history of irregular menses and elevated andro-gen measurements at high risk for worsening cardiovascular event-free survival: results from the National Institutes of Health – National Heart, Lung, and Blood Institute sponsored Women’s Ischemia Syndrome Evaluation. J Clin Endocrinol Metab 2008;93(4):1276-84.
6. Saif A, Soliman NA, Abdel-Hameed A. Early evaluation of renal hemodynamic alterations in type I diabetes mellitus with duplex ultrasound. Saudi J Kidney Dis Transpl 2010;21(2):295-9.
7. Moghazi S, Jones E, Schroepple J, Arya K, McClellan W, Hennigar RA, et al. Correlation of renal histopathology with sonographic findings. Kidney Int 2005;67(4):1515-20.
8. Avasthi PS, Voyles WF, Greene ER. Noninvasive diagnosis of renal artery steno-sis by echo-Doppler velocimetry. Kidney Int 1984:25(5):824-9.
9. Mastorakou I, Lindsell DR, Piepoli M, Adamopoulos S, Ledingham JC. Pulsatility and resistance indices in intrarenal arteries of normal adults. Abdom Imaging 1994;19(4): 369-73.
10. Petersen LJ, Petersen JR, Ladefoged SD, Mehlsen J, Jensen HA. The pulsatility index and the resistive index in renal arteries in patients with hypertension and chronic renal failure. Nephrol Dial Transplant 1995;10(11):2060-4.
11. Matthews DR, Hosker JP, Rudenski AS, Naylor BA, Treacher DF,Turner RC. Homeostasis model assessment: insulin resistance and beta-cell function fromfasting plasma glucose and insulin concentrations in man. Diabetologia 1985;28(7):412-9.
12. Li C, Ford ES, McGuire LC, Mokdad AH, Little RR, Reaven GM. Trends in hyperin-sulinemia among nondiabetic adults in the U.S. Diabetes Care 2006;29(11):2396-402.
13. Adamczak M, Ritz E. Impact of renal dysfunction as a cardiovascular risk fac-tor. Rocz Akad Med Bialymst 2005;50:50-3.
14. Dahlgren E, Janson PO, Johansson S, Lapidus L, Oden A. Polycystic ovary syndrome and risk for myocardial infarction: Evaluated from a risk factor model based on a prospective population study of women. Acta Obstet Gynecol Scand 1992;71(8):599– 604.
15. Whelton PK, Perneger TV, He J, Klag MJ. The role of blood pressure as a risk factor for renal disease: a review of the epidemiologic evidence. J Hum Hypertens 1996;10(10):683-9.
16. Nelson RG, Bennett PH, Beck GJ, Tan M, Knowler WC, Mitch WE, et al. De-velopment and progression of renal disease in Pima Indians with non-insulin-dependent diabetes mellitus. Diabetic Renal Disease Study Group. N Engl J Med 1996;335(22):1636-42.
17. Chen J, Muntner P, Hamm LL, Fonseca V, Batuman V, Whelton PK, et al. Insulin resistance and risk of chronic kidney disease in nondiabetic US adults. J Am Soc Nephrol 2003;14(2):469-77.
18. Chen J, Muntner P, Hamm LL, Jones DW, Batuman V, Fonseca V,et al. The metabolic syndrome and chronic kidney disease in U.S. adults. Ann Intern Med 2004;140(3):167-74.
19. Buturovic-Ponikvar J, Visnar-Perovic A. Ultrasonography in chronic renal fail-ure. Eur J Radiol 2003;46(2):115-22.
20. Emamian SA, Nielsen MB, Pedersen JF, Ytte L. Kidney dimensions at sonog-raphy: correlation with age, sex, and habitus in 665 adult volunteers. AJR Am J Roentgenol 1993;160(1):83-6.
21. Oyuela-Carrasco J, Rodriquez-Castellanos F, Kimura E, Delqado R, Herrera-Feliks JP. Longitud renal por ultrasonografía en población mexicana adulta Renal length by ultrasound in Mexican adults. Nefrologia 2009;29(1):30-4.
22. Bude RO, DiPietro MA, Platt JF, Rubin JM, Miesowicz S, Lunquist C. Age depen-dency of the renal resistive index in healthy children. Radiology 1992;184(2):469-73.
23. Hoffman U, Edwards JM, Carter S, Goldman ML, Harley JD, Zaccardi MJ, et al. Role of duplex scanning fort the detection of atherosclerotic renal artery disease. Kidney Int 1991;39(6):1232-9.
24. Rawashded YF, Djurhuus JC, Mortensen J, Horlyck A, Frokiaer J. The intrare-nal resistive index as a pathophysiological marker of obstructive uropathy. J Urol 2001;165(5):1397-404.
25. Bude RO, Rubin JM. Relationship between the resistive index and vascular compliance and resistance. Radiology 1999;211(2):411-7.
26. Tublin ME, Bude RO, Platt JF. The resistive index in renal Doppler sonography: Where do we stand? AJR Am J Roentgenol 2003;180(4):885-92.
27. Thurston W, Wilson S. The urinary tract. In: Rumack CM, Wilson SR, Char-boneau JW, Johnson J, editors. Diagnostic ultrasound. 3rd ed. St Louis, Mo: Elsevier Mosby; 2005.p.321-93.
How to cite this article
Karadeli E, Uckuyu A, Ciftci FC, Toprak E, Turhan E, Ozcimen E, Niron EA. Polycystic Ovary Syndrome: The Correlation Between Renal Doppler Ultrasound and Labora-tory Parameters. J Clin Anal Med 2016;7(3): 345-50.