Obesity is caused by an imbalance between energy intake and output, which is influenced by numerous environmental, biological, and genetic factors. The consumption of high-calorie foods and having a sedentary lifestyle are reported as the main causes of an increasing rate of obesity; only a minority of obese people have a genetic defect. However, controversial
results have been published about single nucleotide polymorphisms in obesity-related
genes.1-5
Mitochondria are known as the primary organelle regulating metabolic and energy homeostasis and mitochondrial dysfunction is thought to play a key role in the pathogenesis of metabolic disorders in obesity. Mitochondrial uncoupling proteins (UCP) 1, 2 and 3 are the members of the anion carrier protein family located in the inner mitochondrial membrane. They act as a proton transporter, that uncouples oxidative metabolism from ATP synthesis
Uncoupling protein gene UCP1-3826A/G, UCP2 Ins/Del and
UCP3-55C/T polymorphisms in obese Turkish children
Hasibe Verdi
1, Sibel Tulgar Kınık
1, H. Pınar Baysan Çebi
1,
Yaprak Yılmaz Yalçın
1, Ayşe Canan Yazıcı Güvercin
2, Beril Aydın
3,
Neslihan Başcıl Tütüncü
4, F. Belgin Ataç
1Departments of 1Medical Biology, 3Pediatrics and 4Endocrinology and Metabolism, Başkent University Faculty of Medicine, Ankara; 2Department of Biostatistics, İstanbul Aydın University, Faculty of Medicine, İstanbul, Turkey.
ABSTRACT
Background. Mitochondrial uncoupling proteins (UCP) 1, 2 and 3 are members of the anion carrier protein
family located in the inner mitochondrial membrane. There are various controversial reports on UCP genotypes and obesity in adults and children. This study aims to investigate the link between mostly studied UCP polymorphisms (UCP1-3826A/G, UCP2 Insertion/Deletion (Ins/Del) polymorphism of exon 8, and UCP3-55C/T Polymorphisms) and obesity in Turkish children. Furthermore, the relationships of UCP polymorphisms are also analyzed within the scope of metabolic parameters of obese children.
Methods. Molecular screening of the UCP1, UCP2, and UCP3 gene polymorphisms was carried out in 189
children aged 6 to 18 years, 102 of who had exogenous obesity (54 girls) and 87 of whom were healthy controls (48 girls). In the obese group, fasting lipids, glucose and insulin levels were measured. In 60 obese children, an oral glucose tolerance test (OGTT) was performed with 0, 30, 60, 90 and 120 minutes of sampling for plasma glucose and insulin levels.
Results. The frequency of UCP polymorphisms was similar in obese and non-obese children. In obese children,
fasting lipids, glucose and insulin levels were not different among the UCP 1, 2 and 3 genotypes. While no relationship was found between the UCP 1 and 3 genotypes and glucose/insulin levels during OGTT, carriers of the Insertion allele with UCP2 Ins/Del polymorphism had significantly higher 30-minute insulin levels (p=0.018).
Conclusions. Polymorphisms of the UCP1-3826A/G, UCP2 Ins/Del, and UCP3-55C/T are not associated with
obesity and related pathologies in Turkish children. However, the presence of the Ins allele of the UCP2 gene has been found to have an unfavorable influence on early insulin excursion after glucose loading.
Key words: UCP, polymorphism, obese, children, OGTT.
Yaprak Yılmaz Yalçın [email protected]
Received 19th July 2019, revised 13th December 2019, 31st March 2020, accepted 7th June 2020.
and they dissipate energy through heat
production.6 Since the energy in this process is
transferred to heat and not stored as fat in the body, polymorphisms in the UCP genes may contribute to variation in energy balance and
potentially to the development of obesity.7 This
uncoupling effect subsequently leads to tissue-specific functions, such as thermogenesis and energy expenditure (UCP1), the regulation of free-fatty acids metabolism (UCP2 and UCP3), decrease in reactive oxygen species production by mitochondria (UCP1, UCP2, UCP3) and the regulation of insulin secretion by pancreatic beta-cells (UCP2), which are all associated with obesity and/or type 2 diabetes mellitus (T2DM)
pathogenesis.8
Some well-known polymorphisms of the UCPs have been reported to be functional variants on gene expression because of their location within the genome. The polymorphisms located on the upstream region of the gene as UCP1-3826 A/G and UCP3-55C/T may associate with the quantity of the mRNA expression while UCP2 exon 8 Ins/Del polymorphism may associate
with mRNA transcript stability.6-11
Given the location and proposed biological effects of the UCPs, it might be interesting to further evaluate the association among the UCP1-3826A/G (rs1800592), UCP2 Ins/Del and UCP3-55C/T (rs1800849) genotypes with childhood obesity and metabolic parameters. Material and Methods
This study was approved by Baskent University Institutional Review Board (Project No: KA15/344), and supported by Başkent University Research Fund.
Written informed consent was obtained from the parents of the subjects. One hundred and two exogenously obese and 87 healthy age-matched controls were included in this study. In the obese group, fasting glucose, lipids and insulin levels were measured. All patients were clinically free of symptoms except for obesity and they were not taking any medication.
The heights of all subjects were measured by using a Harpenden wall-mounted stadiometer. Weight was measured with a calibrated electronic scale. Body mass index (BMI) was
calculated by using the weight/height2 (kg/m2)
formula. BMI -Z scores were calculated and children with a BMI-Z score greater than or
equal to 2 were also accepted as obese.12,13
Serum low-density lipoprotein cholesterol, high-density lipoprotein cholesterol, and triglyceride levels were studied by using Roche diagnostics methods (GmbH, Germany). A standard oral glucose tolerance test (OGTT) (1.75 g/kg or a maximum of 75 g of glucose) following a 3-day, high-carbohydrate diet (300 g/day) and a 12-hour overnight fast was performed in 60 obese children who accepted to be tested. For glucose and insulin assessments, their blood samples were taken at 0, 30, 60, 90 and 120 minutes, after glucose administration. The plasma glucose levels were measured with the glucose oxidase method and a modified Trinder color reaction was catalyzed by the peroxidase enzyme and their insulin levels were measured with an immunoradiometric assay kit.
Genomic DNA was isolated from leukocyte pellets by phenol/chloroform extraction, and
ethanol precipitation.14
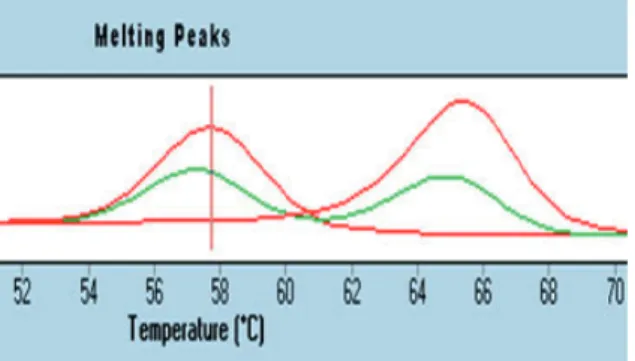
UCP1-3826A/G (rs1800592) and UCP3-55C/T (rs1800849) SNPs were determined by real-time PCR, using a panel of LightSNiP from TIB MolBiol (assays based on SimpleProbe®). The SimpleProbe® included in the LightSNP assay can detect single base mismatches, thus enabling the analysis of polymorphisms. At the end of the amplification, a melting curve analysis was performed according to the protocol (LightCycler 480, Roche). Polymorphic alleles were identified by the specific melting temperature (Tm) of the resulting amplicons. For UCP1-3826A/G (rs1800592) individuals with -3826 A allele show a single melting peak at 57.94°C, while individuals with -3826 G allele also show a single melting peak but at 65.16°C
and individuals with both alleles (A/G) show two melting peaks at 57.94 and 65.16°C in this analysis (Fig. 1).
For UCP3-55C/T (rs1800849); individuals with two copies of the C allele show a single melting peak at 62.01°C, individuals with two copies of the T allele also show a single melting peak but at 67.31°C and individuals with both alleles (C/T) show two melting peaks at 62.01 and 67.31°C in this analysis (Fig. 2).
Ins/Del polymorphism of the UCP2 gene was also detected by electrophoretic separation
of PCR products.15 The presence of a 450-bp
product indicated the Ins allele, whereas the presence of a 412-bp product indicated the Del allele. Each DNA sample revealed 1 of the 3 possible patterns after electrophoresis: a 412-bp band (genotype DelDel), a 450-412-bp band (genotype InsIns), or both bands (genotype InsDel).
Statistical analysis
Compliance with the normal distribution of continuous variables was checked with the Shapiro-Wilk test. The homogeneity of group variances was checked by Levene’s test. If parametric test requirements were met, two independent group means would be compared by Student’s t-test. If requirements were not met, the Mann Whitney U test would be used for the comparisons of groups’ medians.
The allele and genotype frequencies were calculated for all investigated polymorphisms by direct counting. The distribution of genotypes for all polymorphisms was tested for conformity with Hardy-Weinberg equilibrium. To determine the relationships between genotypes and study groups, categorical variables were statistically evaluated by Pearson χ2 test and the Likelihood ratio test was used for small frequencies in some cells of the contingency tables. Relationships between alleles and study groups were analyzed by the Fisher Exact test. Data analyses were performed using the Statistical Package for the Social Sciences, version 19.0 (SPSS 19, Armonk, NY: IBM Corp). p values smaller than 0.05 were considered to be statistically significant. Results
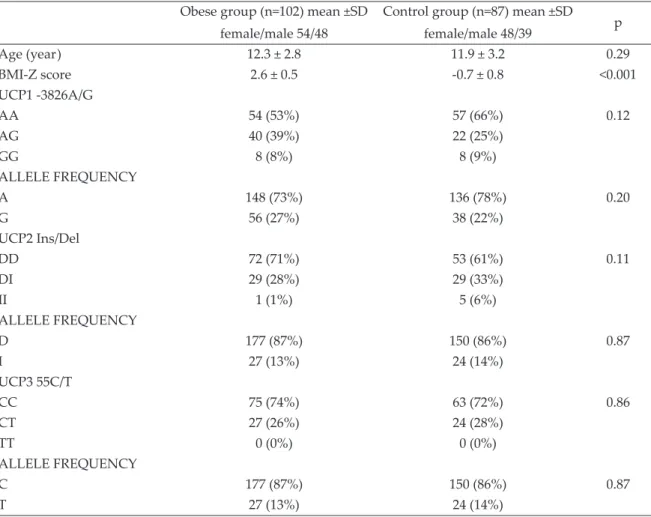
The frequencies of UCP1, UCP2, UCP3 genotypes were not different in the obese and control groups. The allele frequencies were also similar (Table I).
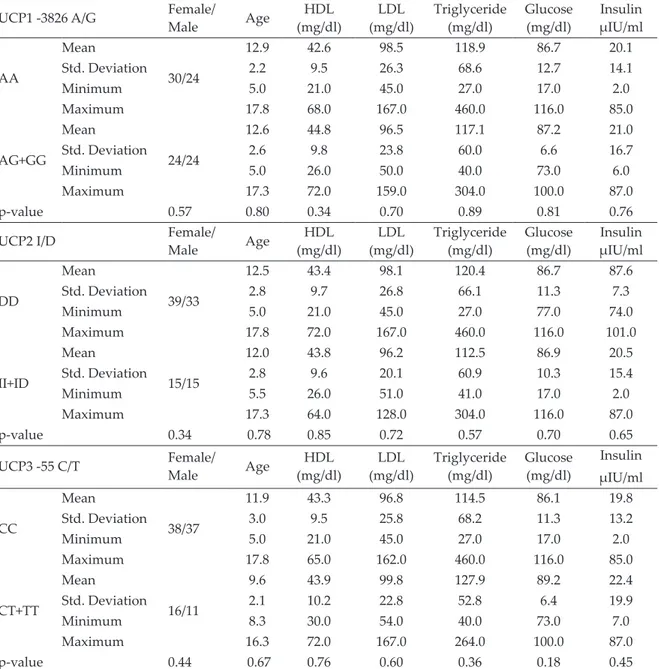
In obese children, gender, fasting lipids, glucose, and insulin levels were not different among the UCP 1, 2 and 3 genotypes (Table II). OGTT was performed in 60 obese children who approved of being tested.
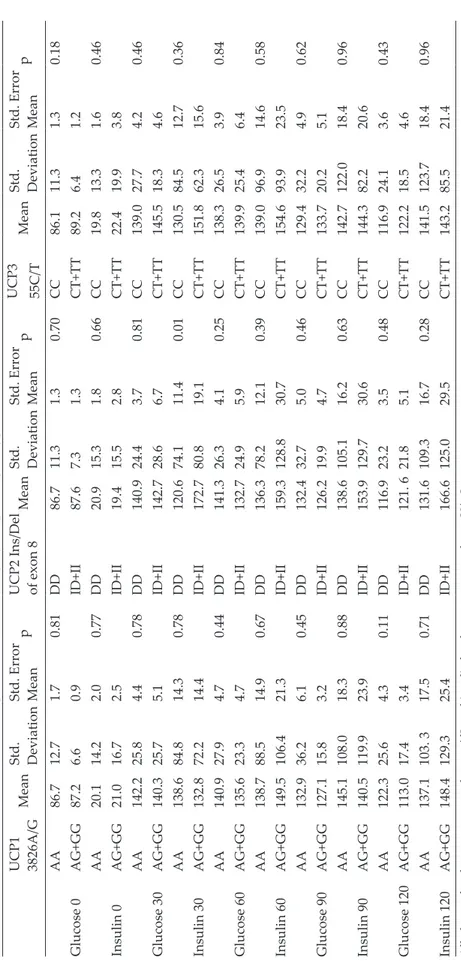
Plasma glucose and insulin levels during OGTT were not different between G allele carriers and noncarriers in UCP1-3826A/G polymorphism and also between T allele carriers and noncarriers in UCP3-55C/T polymorphism genotypes. For UCP2 Ins/Del polymorphism, similarly, plasma
Fig. 1. Melting Curve Analysis UCP1 -3826A/G
(rs1800592).
Fig. 2. Melting Curve Analysis UCP3 -55C/T
glucose and insulin levels during OGTT were not different between Ins allele carriers and
noncarriers except for the 30th-minute insulin
levels. The mean of the serum insulin level at
the 30th-minute was significantly higher in the
Ins allele carrier group (Table III). Discussion
In this study, the genotype and allele frequencies of UCP1-3826A/G, UCP2 Ins/Del, and UCP3-55C/T polymorphisms were found similar in obese and non-obese Turkish children. Our study may indicate that the presence of the Ins allele of the UCP2 gene has an unfavorable influence on early insulin excursion after glucose loading.
UCP1 is expressed in brown adipose tissue and plays an important role in thermogenesis, regulation of energy metabolism, and reduction of reactive oxygen species production by mitochondria, which are important pathways
in obesity and T2DM.16
UCP1-3826A/G polymorphism is one of the well-described polymorphisms for UCP1. In a study, it was reported that there is a positive correlation between UCP1 GG genotype and lower weight, while in two other studies it was mentioned that there is a causative effect in people carrying G allele and having a higher
BMI, especially in women.17-20 On the other
hand, a report which supports an association
between the -3826G allele and T2DM in adults21
and a meta-analysis improves the lack of
Table I. Genotype frequencies of the obese and control groups.
Obese group (n=102) mean ±SD female/male 54/48
Control group (n=87) mean ±SD female/male 48/39 p Age (year) 12.3 ± 2.8 11.9 ± 3.2 0.29 BMI-Z score 2.6 ± 0.5 -0.7 ± 0.8 <0.001 UCP1 -3826A/G AA 54 (53%) 57 (66%) 0.12 AG 40 (39%) 22 (25%) GG 8 (8%) 8 (9%) ALLELE FREQUENCY A 148 (73%) 136 (78%) 0.20 G 56 (27%) 38 (22%) UCP2 Ins/Del DD 72 (71%) 53 (61%) 0.11 DI 29 (28%) 29 (33%) II 1 (1%) 5 (6%) ALLELE FREQUENCY D 177 (87%) 150 (86%) 0.87 I 27 (13%) 24 (14%) UCP3 55C/T CC 75 (74%) 63 (72%) 0.86 CT 27 (26%) 24 (28%) TT 0 (0%) 0 (0%) ALLELE FREQUENCY C 177 (87%) 150 (86%) 0.87 T 27 (13%) 24 (14%)
the association of the relevant genotype and
T2DM.22 The result of our study shows that
UCP1-326A/G genotype was not associated with obesity, metabolic disorders, gender and also glucose-insulin responses during OGTT. UCP2 is widely expressed, especially in white adipose tissue, skeletal muscle, and pancreatic islets. The UCP2 Ins/Del polymorphism is a 45-bp insertion in exon 8 in the 3’-untranslated
region of the UCP2 gene. It may affect UCP2 mRNA stability, post-transcriptional
modification, or translation.23 Although no
significant association has been reported between UCP2 Ins/Del genotype and obese/ non-obese adults and children in many reports,
Yanovski et al.24 have reported that children
with Ins allele had a greater BMI. However, the metabolic parameters related to obesity were
not included.25,26
Table II. Laboratory results of obese children in each polymorhism.
UCP1 -3826 A/G Female/Male Age (mg/dl)HDL (mg/dl)LDL Triglyceride (mg/dl) Glucose (mg/dl) µIU/mlInsulin
AA Mean 30/24 12.9 42.6 98.5 118.9 86.7 20.1 Std. Deviation 2.2 9.5 26.3 68.6 12.7 14.1 Minimum 5.0 21.0 45.0 27.0 17.0 2.0 Maximum 17.8 68.0 167.0 460.0 116.0 85.0 AG+GG Mean 24/24 12.6 44.8 96.5 117.1 87.2 21.0 Std. Deviation 2.6 9.8 23.8 60.0 6.6 16.7 Minimum 5.0 26.0 50.0 40.0 73.0 6.0 Maximum 17.3 72.0 159.0 304.0 100.0 87.0 p-value 0.57 0.80 0.34 0.70 0.89 0.81 0.76
UCP2 I/D Female/Male Age (mg/dl)HDL (mg/dl)LDL Triglyceride (mg/dl) Glucose (mg/dl) µIU/mlInsulin
DD Mean 39/33 12.5 43.4 98.1 120.4 86.7 87.6 Std. Deviation 2.8 9.7 26.8 66.1 11.3 7.3 Minimum 5.0 21.0 45.0 27.0 77.0 74.0 Maximum 17.8 72.0 167.0 460.0 116.0 101.0 II+ID Mean 15/15 12.0 43.8 96.2 112.5 86.9 20.5 Std. Deviation 2.8 9.6 20.1 60.9 10.3 15.4 Minimum 5.5 26.0 51.0 41.0 17.0 2.0 Maximum 17.3 64.0 128.0 304.0 116.0 87.0 p-value 0.34 0.78 0.85 0.72 0.57 0.70 0.65
UCP3 -55 C/T Female/Male Age (mg/dl)HDL (mg/dl)LDL Triglyceride (mg/dl) Glucose (mg/dl) Insulin µIU/ml CC Mean 38/37 11.9 43.3 96.8 114.5 86.1 19.8 Std. Deviation 3.0 9.5 25.8 68.2 11.3 13.2 Minimum 5.0 21.0 45.0 27.0 17.0 2.0 Maximum 17.8 65.0 162.0 460.0 116.0 85.0 CT+TT Mean 16/11 9.6 43.9 99.8 127.9 89.2 22.4 Std. Deviation 2.1 10.2 22.8 52.8 6.4 19.9 Minimum 8.3 30.0 54.0 40.0 73.0 7.0 Maximum 16.3 72.0 167.0 264.0 100.0 87.0 p-value 0.44 0.67 0.76 0.60 0.36 0.18 0.45
Table III.
Glucose and insulin lev
els during OGTT in UCP1. 2. 3 polymorphism genotypes.
UCP1 3826A/G
Mean
Std. Deviation Std. Error Mean
p
UCP2 Ins/Del of exon 8
Mean Std. Deviation Std. Error Mean p UCP3 55C/T Mean Std. Deviation Std. Error Mean p AA 86.7 12.7 1.7 0.81 DD 86.7 11.3 1.3 0.70 CC 86.1 11.3 1.3 0.18 Glucose 0 AG+GG 87.2 6.6 0.9 ID+II 87.6 7.3 1.3 CT+TT 89.2 6.4 1.2 AA 20.1 14.2 2.0 0.77 DD 20.9 15.3 1.8 0.66 CC 19.8 13.3 1.6 0.46 Insulin 0 AG+GG 21.0 16.7 2.5 ID+II 19.4 15.5 2.8 CT+TT 22.4 19.9 3.8 AA 142.2 25.8 4.4 0.78 DD 140.9 24.4 3.7 0.81 CC 139.0 27.7 4.2 0.46 Glucose 30 AG+GG 140.3 25.7 5.1 ID+II 142.7 28.6 6.7 CT+TT 145.5 18.3 4.6 AA 138.6 84.8 14.3 0.78 DD 120.6 74.1 11.4 0.01 CC 130.5 84.5 12.7 0.36 Insulin 30 AG+GG 132.8 72.2 14.4 ID+II 172.7 80.8 19.1 CT+TT 151.8 62.3 15.6 AA 140.9 27.9 4.7 0.44 DD 141.3 26.3 4.1 0.25 CC 138.3 26.5 3.9 0.84 Glucose 60 AG+GG 135.6 23.3 4.7 ID+II 132.7 24.9 5.9 CT+TT 139.9 25.4 6.4 AA 138.7 88.5 14.9 0.67 DD 136.3 78.2 12.1 0.39 CC 139.0 96.9 14.6 0.58 Insulin 60 AG+GG 149.5 106.4 21.3 ID+II 159.3 128.8 30.7 CT+TT 154.6 93.9 23.5 AA 132.9 36.2 6.1 0.45 DD 132.4 32.7 5.0 0.46 CC 129.4 32.2 4.9 0.62 Glucose 90 AG+GG 127.1 15.8 3.2 ID+II 126.2 19.9 4.7 CT+TT 133.7 20.2 5.1 AA 145.1 108.0 18.3 0.88 DD 138.6 105.1 16.2 0.63 CC 142.7 122.0 18.4 0.96 Insulin 90 AG+GG 140.5 119.9 23.9 ID+II 153.9 129.7 30.6 CT+TT 144.3 82.2 20.6 AA 122.3 25.6 4.3 0.11 DD 116.9 23.2 3.5 0.48 CC 116.9 24.1 3.6 0.43 Glucose 120 AG+GG 113.0 17.4 3.4 ID+II 121. 6 21.8 5.1 CT+TT 122.2 18.5 4.6 AA 137.1 103. 3 17.5 0.71 DD 131.6 109.3 16.7 0.28 CC 141.5 123.7 18.4 0.96 Insulin 120 AG+GG 148.4 129.3 25.4 ID+II 166.6 125.0 29.5 CT+TT 143.2 85.5 21.4
All glucose lev
els w
ere expressed as mg/dL and insulin lev
els w
As for the UCP3, the gene is selectively expressed in human skeletal muscles, a major site of thermogenesis and substrate oxidation, which makes this gene an attractive candidate for studies of energy metabolism and body weight regulation. Recent evidence has suggested that UCP3 plays an important role in modulating the
use of lipid and glucose as an energy substrate.27
UCP3-55C/T polymorphism is the most well-documented one. Studies exploring the association of UCP3-55C/T genotype and BMI have provided conflicting results. Although no association was reported between UCP3-55C/T polymorphism and obesity, in some reports concerning adults, -55TT genotype of UCP3 was mentioned to have both higher BMI and
lower BMI.28-31 No significant association was
reported between UCP3-55C/T polymorphism and childhood obesity in this study.
Gul et al.32 studied UCP1-3826A/G, UCP2 Ins/
Del, and UCP3-55C/T variants in 268 obese and 185 non-obese Turkish children and reported that the G allele was more frequent in obese subjects with hypertriglyceridemia. Although it has been reported that the polymorphisms of UCP2 Ins/Del and UCP3-55C/T do not influence the obesity risk, the Ins allele was associated with low HDL levels. In our study, we did not find any relation between UCP polymorphisms and lipid levels in Turkish children.
OGTT provides a dynamic view of glucose and insulin physiology and has been widely used
for decades to diagnose diabetes.33 The 30th
-minute insulin levels in the test show the first-phase insulin secretion which can be an index of beta-cell function. In a recent study concerning
adults,34 it has been reported that, after glucose
ingestion, individuals with insulin-resistance and normal glucose tolerance secreted even
more insulin in the early phase (30th-minute
measurement in OGTT). Therefore, we have investigated the association between UCP genotypes and post-challenge glucose-insulin levels during OGTT. Our results may indicate that the 30-minute post-challenge insulin levels were significantly higher in obese children who
were Ins allele carriers in UCP2 Ins/Del. Csernus
K. et al.35 reported that in obese Hungarian
children the UCP2 Ins/Del polymorphism was associated with a higher degree of obesity, insulin resistance (higher 0 and 120-minute insulin levels during OGTT), dyslipidemia and lower adjusted metabolic rate. The Ins allele of the UCP2 Ins/Del polymorphism was associated with worse indices of obesity, insulin resistance, and dyslipidemia. They did not measure insulin levels at 30, 60 and 90 minutes. Although we did
not find any relation between the 120th-minute
insulin levels with Ins allele carriers of the UCP2 gene, 30-minute post-challenge insulin levels were found to be higher.
In conclusion, based on our data from a single-center, we propose that UCP2 Ins/Del polymorphism has a significant role in glucose-insulin dynamics. Obese children who are Ins allele carriers of the UCP2 gene have a higher risk for exaggerated early-phase insulin response to glucose. Further studies with other genes are required to be carried out to understand the molecular mechanisms of obesity.
REFERENCES
1. Rankinen T, Zuberi A, Chagnon YC, et al. The human obesity gene map: the 2005 update. Obesity (Silver Spring) 2006; 14: 529-644.
2. Verdi H, Tulgar Kınık S, Yılmaz Yalçın Y, Muratoğlu Şahin N, Yazıcı AC, Ataç FB. β-3AR W64R polymorphism and 30-minute post-challenge plasma glucose levels in obese children. J Clin Res Pediatr Endocrinol 2015; 7: 7-12.
3. Abdelmajed SS, Youssef M, Zaki ME, Abu-Mandil Hassan N, Ismail S. Association analysis of FTO gene polymorphisms and obesity risk among Egyptian children and adolescents. Genes Dis 2017; 4: 170-175. 4. Kinik ST, Ozbek N, Yuce M, Yazici AC, Verdi H, Ataç FB. PAI-1 gene 4G/5G polymorphism, cytokine levels and their relations with metabolic parameters in obese children. Thromb Haemost 2008; 99: 352-356.
5. Kanra AR, Tulgar-Kinik S, Verdi H, Ataç FB, Yazici AC, Ozbek N. Transforming growth factor-beta1 (509 C/T, 915 G/C, 869 T/C) polymorphisms are not related to obesity in Turkish children. Turk J Pediatr 2011; 53: 645-650.
6. Busiello RA, Savarese S, Lombardi A. Mitochondrial uncoupling proteins and energy metabolism. Front Physiol 2015; 6: 36.
7. Ukkola O, Tremblay A, Sun G, Chagnon YC, Bouchard C. Genetic variation at the uncoupling protein 1, 2 and 3 loci and the response to long-term overfeeding. Eur J Clin Nutr 2001; 55: 1008-1015. 8. Brondani LA, de Souza BM, Assmann TS, et al.
Association of the UCP polymorphisms with susceptibility to obesity: case-control study and meta-analysis. Mol Biol Rep 2014; 41: 5053-5067. 9. Walder K, Norman RA, Hanson RL, et al. Association
between uncoupling protein polymorphisms (UCP2-UCP3) and energy metabolism/obesity in Pima Indians. Hum Mol Genet 1998; 7: 1431-1435. 10. Csernus K, Pauler G, Erhardt E, Lanyi E, Molnar
D. Uncoupling protein-2 gene polymorphisms are associated with obesity in Hungarian children. Acta Paediatr 2013; 102: e200-e204.
11. Schrauwen P, Xia J, Bogardus C, Pratley RE, Ravussin E. Skeletal muscle uncoupling protein 3 expression is a determinant of energy expenditure in Pima Indians. Diabetes 1999; 48:146-149.
12. Neyzi O, Bundak R, Gökçay G, et al. Reference values for weight, height, head circumference, and body mass index in Turkish children. J Clin Res Pediatr Endocrinol 2015; 7: 280-293.
13. https://www.ceddcozum.com/ (Accessed: 30.03.2019). 14. Green MR, Sambrook J. Isolation of high-molecular-weight DNA using organic solvents. Cold Spring Harb Protoc; 2017: doi:10.1101/pdb.prot093450. 15. Park J, Bose S, Hong SW, et al. Impact of
GNB3-C825T, ADRB3-Trp64Arg, UCP2-3’UTR 45 bp del/ins, and PPARγ-Pro12Ala polymorphisms on Bofutsushosan response in obese subjects: a randomized, double-blind, placebo-controlled trial. J Med Food 2014; 17: 558-570.
16. Azzu V, Brand MD. The on-off switches of the mitochondrial uncoupling proteins. Trends Biochem Sci 2010; 35: 298-307.
17. Nicoletti CF, de Oliveira AP, Brochado MJ, et al. UCP1 -3826 A>G polymorphism affects weight, fat mass, and risk of type 2 diabetes mellitus in grade III obese patients. Nutrition 2016; 32: 83-87.
18. Dhall M, Chaturvedi MM, Rai U, Kapoor S. Sex-dependent effects of the UCP1 - 3826 A/G polymorphism on obesity and blood pressure. Ethn Dis 2012; 22: 181-184.
19. Clement K, Ruiz J, Cassard-Doulcier AM, et al. Additive effect of A–>G (-3826) variant of the uncoupling protein gene and the Trp64Arg mutation of the beta 3-adrenergic receptor gene on weight gain in morbid obesity. Int J Obes Relat Metab Disord 1996; 20: 1062-1066.
20. Matsushita H, Kurabayashi T, Tomita M, Kato N, Tanaka K. Effects of uncoupling protein 1 and beta3-adrenergic receptor gene polymorphisms on body size and serum lipid concentrations in Japanese women. Maturitas 2003; 45: 39-45.
21. Vimaleswaran KS, Radha V, Ghosh S, Majumder PP, Rao MR, Mohan V. A haplotype at the UCP1 gene locus contributes to genetic risk for type 2 diabetes in Asian Indians (CURES-72). Metab Syndr Relat Disord 2010; 8: 63-68.
22. de Souza BM, Brondani LA, Bouças AP, et al. Associations between UCP1 -3826A/G, UCP2 -866G/A, Ala55Val and Ins/ Del, and UCP3 -55C/T polymorphisms and susceptibility to type 2 diabetes mellitus: case-control study and meta-analysis. PLoS One 2013; 8: e54259.
23. Walder K, Norman RA, Hanson RL, et al. Association between uncoupling protein polymorphisms (UCP2-UCP3) and energy metabolism/obesity in Pima Indians. Hum Mol Genet 1998; 7: 1431-1435. 24. Yanovski JA, Diament AL, Sovik KN et al.
Associations between uncoupling protein 2, body composition, and resting energy expenditure in lean and obese African American, white, and Asian children. Am J Clin Nutr 2000; 71: 1405-1420. 25. Papazoglou D, Papathanasiou P, Papanas N, et al.
Uncoupling protein-2 45-base pair insertion/deletion polymorphism: is there an association with severe obesity and weight loss in morbidly obese subjects? Metab Syndr Relat Disord 2012; 10: 307-311. 26. Tu N, Chen H, Winnikes U, et al. Structural
organization and mutational analysis of the human uncoupling protein-2 (hUCP2) gene. Life Sci 1999; 64: PL41-PL50.
27. Diano S, Horvath TL. Mitochondrial uncoupling protein 2 (UCP2) in glucose and lipid metabolism. Trends Mol Med 2012; 18: 52-58.
28. Dalgaard LT, Pedersen O. Uncoupling proteins: functional characteristics and role in the pathogenesis of obesity and Type II diabetes. Diabetologia 2001; 44: 946-965.
29. Alonso A, Martí A, Corbalán MS, Martínez-González MA, Forga L, Martinez JA. Association of UCP3 gene -55C>T polymorphism and obesity in a Spanish population. Ann Nutr Metab 2005; 49: 183-188.
30. Hamada T, Kotani K, Fujiwara S, et al. The common -55 C/T polymorphism in the promoter region of the uncoupling protein 3 gene reduces prevalence of obesity and elevates serum high-density lipoprotein cholesterol levels in the general Japanese population. Metabolism 2008; 57: 410-415.
31. Lapice E, Monticelli A, Cocozza S, et al. The energy intake modulates the association of the -55CT polymorphism of UCP3 with body weight in type 2 diabetic patients. Int J Obes (Lond) 2014; 38: 873-877. 32. Gul A, Ateş O, Ozer S, et al. Role of the polymorphisms
of uncoupling protein genes in childhood obesity and their association with obesity-related disturbances. Genet Test Mol Biomarkers 2017; 21: 531-538.
33. Matsuda M, DeFronzo RA. Insulin sensitivity indices obtained from oral glucose tolerance testing:comparison with the euglycemic insulin clamp. Diabetes Care 1999; 22: 1462-1470.
34. Wang Q, Jokelainen J, Auvinen J, et al. Insulin resistance and systemic metabolic changes in oral glucose tolerance test in 5340 individuals: an interventional study. BMC Med 2019; 17: 217. 35. Csernus K, Pauler G, Erhardt É, Lányi É, Molnár D.
Effects of energy expenditure gene polymorphisms on obesity-related traits in obese children. Obes Res Clin Pract 2015; 9: 133-140.