Tarım Bilimleri Dergisi
Tar. Bil. Der.
Dergi web sayfası:
www.agri.ankara.edu.tr/dergi
Journal of Agricultural Sciences
Journal homepage:
www.agri.ankara.edu.tr/journal
TARIM BİLİMLERİ DERGİSİ
—
JOURNAL OF AGRICUL
TURAL SCIENCES
21 (2015) 132-143
Performance Analysis of a Greenhouse Fan-Pad Cooling System:
Gradients of Horizontal Temperature and Relative Humidity
Mehmet Ali DAYIOĞLU
a, Hasan Hüseyin SİLLELİ
aaAnkara University, Faculty of Agriculture, Department of Agricultural Machinery, 06130, Ankara, TURKEY
ARTICLE INFO
Research Article
Corresponding Author: Mehmet Ali DAYIOĞLU, E-mail: [email protected], Tel: +90 (312) 596 15 96 Received: 27 July 2014, Received in Revised Form: 01 October 2014, Accepted: 10 October 2014
ABSTRACT
An experimental study is conducted to determine the performance parameters of system, as well as gradients of temperature and humidity along greenhouse when opening Fan-Pad cooling system. Measurements in the study were carried out by using seven sensors for different locations, as well as portable instruments. For this purpose, the five digital temperature and humidity sensors and two pyranometers were used during experiments. Among them, two were located outside greenhouse for external measurements. The rest one pyranometer above the crop canopy, four temperature and humidity sensors were mounted within the crop canopy along the greenhouse. Four sensors were placed according to positions defined between pad and fan. According to the experiment results, the non-uniform temperature changes, but approximately uniform humidity changes due to the crop transpiration were observed along greenhouse from pad panels to exhaust fans. When the cooling system closed, hourly mean temperature and relative humidity from Pad to Fan inside greenhouse changed between 30–33 °C and 30–47%, respectively, at outside climate conditions of 32 °C and 25%. After providing stabile cooling by opening Fan-Pad system, hourly mean temperature and relative humidity along greenhouse from pad to fan ranged between 20 – 27 °C, and 50 – 68%, respectively. The air temperature entering to greenhouse with air velocity of 0.8–0.9 ms-1 through pad was approximately 12–13 ºC lower than the outside
air temperature. The air temperature from Pad to Fan increased approximately by 7 ºC. The method of psychrometric calculations was employed to determine the cooling efficiency of Fan-Pad system. According to the calculation result, the average of air temperatures inside greenhouse was 24.5 ºC after achieving stable cooling for outside air temperature of 31.4 ºC. The hourly mean cooling effect and cooling efficiency calculated for Fan-Pad system were determined to be 6.96 ºC and 76.8%, respectively.
Keywords: Cooling efficiency; Fan-Pad cooling system; Greenhouse; Psychrometric calculation; Temperature and relative humidity
Sera Fan-Pad Soğutma Sisteminin Performans Analizi: Yatay Sıcaklık
ve Bağıl Nem Değişimleri
ESER BİLGİSİ
Araştırma Makalesi
Sorumlu Yazar: Mehmet Ali DAYIOĞLU, E-posta: [email protected], Tel: +90 (312) 596 15 96 Geliş Tarihi: 27 Temmuz 2014, Düzeltmelerin Gelişi: 01 Ekim 2014, Kabul:10 Ekim 2014
133
Ta r ı m B i l i m l e r i D e r g i s i – J o u r n a l o f A g r i c u l t u r a l S c i e n c e s21 (2015) 132-143
1. Introduction
Throughout the year, the demand for fresh vegetables
and fruits has increased from day to day. In order
to increase the amount of production of vegetables
and fruits in dry areas, the greenhouse production
period during the summer and autumn seasons can
be expanded. However, the accumulated heat within
the greenhouse due to the presence of high solar
radiation causes to rising of the internal temperature
(Tashoo et al 2014). Extreme temperatures inside
the greenhouse will limit the plant growth, as well
as its quality, eventually resulting in plant wilting
and death. Even in greenhouses with proper and
adequate circulation, the leaf temperature can be 5 –
10 °C higher than the air temperature (von Zabeltitz
2011). Greenhouse crops must not be kept for long
time at temperatures between 30 and 35 °C (Bailey
2006). If level of air temperature in greenhouses
where is used natural ventilation and shading system
is higher than 28 °C, it is recommended using of
an artificial cooling system. Generally, evaporative
cooling for greenhouses are made by using fogging,
Fan-Pad cooling and misting methods (von Zabeltitz
2011). The system in which is suitable for hot and
dry climate conditions among these is the Fan - Pad
cooling system.
A Fan-Pad system consists of cellulose Pad
panels, exhaust fans, water circulation pump and
pipes. Pads and exhaust fans are located on opposing
walls to cool plants growing in between Pad and
Fan. Cellulose Pads have corrugated surfaces which
are suitable for passing water and air. When inlet
air passes through the wetted Pads, water evaporates
using its sensible heat. In thermodynamics, this is
known as an adiabatic process in which remains
the constant of enthalpy without heat loss or gain
(ASHRAE 2005).
Theoretical and experimental studies have
been conducted by many researchers on Fan-Pad
evaporative cooling systems. According to results
of Kittas et al (2001) and Jain & Tiwari (2002), the
internal greenhouse temperatures were lower about 10
°C and 4-5 °C than outside temperature, respectively.
Kittas et al (2003) presented and validated a model
to predict the temperature and humidity gradient
along the length of a large greenhouse equipped with
ÖZET
Fan-Pad soğutma sistemi çalışırken sera boyunca oluşan sıcaklık ve bağıl nem değişimleri ve soğutma sistemi performans parametrelerini saptamak için deneysel bir çalışma yapılmıştır. Çalışmada ölçümler yedi farklı noktaya yerleştirilen sensörler ve taşınabilir ölçüm cihazları kullanılarak gerçekleştirilmiştir. Bu amaçla, beş dijital sıcaklık-nem sensörü ve iki güneş ışınım sensörü kullanılmıştır. Sensörlerden ikisi sera dışına, bir güneş ışınım sensörü bitki örtüsü üstüne, dört sıcaklık-nem sensörü sera boyunca bitki örtüsü içine yerleştirilmiştir. Dört sensörün yerleşimi Pad ve Fan arasında tanımlanmış konumlara göre yapılmıştır. Elde edilen deney sonuçlarına göre, Pad tarafından fan tarafına sera boyunca homojen olmayan sıcaklık değişimleri, ancak transpirasyon nedeniyle yaklaşık homojen kalan bağıl nem değişimleri gözlemlenmiştir. Soğutma sistemi kapalı olduğu zaman, havanın 32 °C ve % 25 olduğu koşullarda, sera içinde Pad tarafından fan tarafına saatlik ortalama sıcaklık ve bağıl nem değerleri sırasıyla 30–33 °C ve % 30–% 47 arasında değişmiştir. Fan-Pad sistemi çalıştırılıp kararlı soğutma sağlandıktan sonra, sera boyunca saatlik ortalama sıcaklık ve bağıl nem değerleri sırasıyla 20 – 27 °C ve % 50 –% 68, arasında değişmiştir. Islak Pad yüzeyini geçerek yaklaşık 0.8–0.9 m s-1 hava hızla seraya giren hava sıcaklığı dış hava sıcaklığından 12–13 ºC daha düşük olmuştur. Pad tarafından
fan tarafına sera boyunca hava sıcaklığı yaklaşık 7 ºC yükselmiştir. Buharlaşmalı Fan-Pad sisteminin soğutma etkinliğini hesaplamak için psikrometrik hesaplama yöntemi kullanılmıştır. Hesaplama sonucuna göre, dış hava sıcaklığının 31.4 ºC olduğu koşullarda kararlı soğutma sağlandıktan sonra sera içindeki ortalama sıcaklığın 24.5 ºC olduğu belirlenmiştir. Fan-Pad sistemi için hesaplanan saatlik ortalama soğutma etkisi ve soğutma etkinliği değerleri sırasıyla 6.96 ºC ve % 76.8 olarak saptanmıştır.
Anahtar Kelimeler: Soğutma etkinliği; Fan-Pad soğutma sistemi; Sera; Psikrometrik hesaplama; Sıcaklık ve bağıl nem © Ankara Üniversitesi Ziraat Fakültesi
Sera Fan-Pad Soğutma Sisteminin Performans Analizi: Yatay Sıcaklık ve Bağıl Nem Değişimleri, Dayıoğlu & Silleli
134
Ta r ı m B i l i m l e r i D e r g i s i – J o u r n a l o f A g r i c u l t u r a l S c i e n c e s21 (2015) 132-143
Fan-Pad cooling system. Willist (2003) proposed a
numerical model to predict air and crop temperatures
when cooling system is used, not used. Fuchs et al
(2006) developed a numerical model based on energy
balance equation for evaporative cooling. Sabeh
et al (2006) studied on amount of water needed for
the cooling system to be used in a semi-arid region.
Sethi & Sharma (2007) reviewed the available
cooling technologies such as ventilation, shading,
evaporative cooling (Fan-Pad, misting, fogging,
and roof cooling) and composite systems
(earth-to-air heat exchanger system and aquifer coupled heat
exchanger system). Kumar et al (2009) reviewed
on cooling technologies, design parameters, and
their effects on the microclimate. Malli et al (2011)
tested experimentally the thermal performances for
three different cellulose Pad thicknesses, such as 75,
100 and 150 mm. Lopez et al (2012) analyzed the
characteristics of airflow and temperature distribution
both Fan-Pad system and a low pressure fogging
using sonic anemometry in an empty greenhouses.
In this paper, an experimental study was
conducted to determine gradients of temperature
and humidity formed along a greenhouse cooled
when Fan-Pad system is used in Ankara conditions.
The performance parameters of cooling system were
calculated by using the method of psychrometric
calculation according to external and internal data
related with greenhouse environment.
2. Material and Methods
2.1. Greenhouse experiments
The experiments were conducted in a tomato
greenhouse from April to August of 2009 at typical
summer days with dry, sunny and cloudless. The
crop was grown in a Venlo style research greenhouse
located at University of Ankara, Turkey (39° 57’ 39”
N, 32° 51’ 49” E, and 855 m altitude).
The floor area of the greenhouse is 64 m
2(8 m
x 8 m). The orientation of greenhouse is east-west
direction with an angle of 26.6º from North. The
greenhouse with galvanized steel frame is covered
with polycarbonate sheets at thickness of 4 mm with
double-walled and UV protection. The gutter and
ridge heights of greenhouse having the roof slope
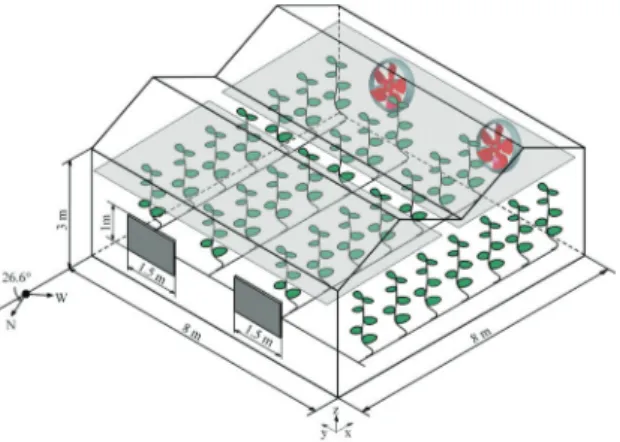
of 26.5° are 3 m and 4 m, respectively. General
dimensions and position of the greenhouse are shown
in Figure 1. The greenhouse has six roof vents
south-facing and two vents north-south-facing, and is equipped
with Fan-Pad cooling system, as well as drip irrigation
system. During the experiments, the tomato crop was
grown in a soil medium. The greenhouse climate
system consists of natural ventilation, shading,
Fan-Pads cooling, high-pressure fogging, drip irrigation,
infrared heaters, and computer controller. During
experiments, natural ventilation, shading, irrigation
and Fan-Pad systems were actively used to ensure
proper climate for growing crop.
Figure 1- Schematic of experiment greenhouse used
for cooling experiments
Şekil 1- Soğutma deneylerinde kullanılan seranın
şematik gösterimi
Tomato (Lycopersicon esculentum L.) seedlings
were transplanted into the greenhouse on April 01,
2009. The crop was configured in seven rows with
14 plants in each row, total 98 plants, as illustrated
in Figure 2. Row spacing and plant spacing were 0.9
m and 0.4 m, respectively.
Water need of plants is provided with drip
irrigation system which has dripper discharge rate
of 2 L h
-1. A cable-drum drive system is used to
extend and retract from truss to truss for shading
of crop in greenhouse. The shading nets with solar
transmittance of 50% in two-pieces at height of 2.5
m above ground are available in the greenhouse.
135
Ta r ı m B i l i m l e r i D e r g i s i – J o u r n a l o f A g r i c u l t u r a l S c i e n c e s21 (2015) 132-143
However, the small sun flecks are occurrence on
crop in the greenhouse by reason of the space of 1 m
between these nets (Figure 2).
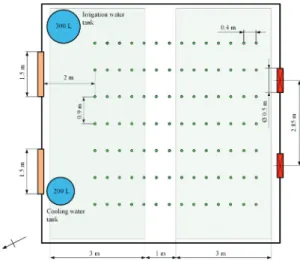
Figure 2- Configuration of crop, drip irrigation
system Fan-Pad cooling system, and shading nets in
experiment greenhouse
Şekil 2- Deney serasında bitki, damla sulama, Fan-Pad
soğutma sistemi ve gölgeleme perdesinin yerleşimi
2.2. Fan-Pad cooling system
Evaporative cooling Pads that are at thickness of
100 mm are placed in two frames, width of 1.5 m
and height of 1 m. They mount on the bonded gas
concrete wall that is at height of 0.75 m above ground
at north side. The distance between the pads and the
first canopy line in rows was approximately 2 m.
Two exhaust fans are mounted to opposite side of the
greenhouse as shown in Figure 2. The rotation axis of
fans, which have the diameter of 0.5 m, is at a height
of 1.6 m above ground. The spacing between rotation
axes of fans on side wall is 2.85 m. Air flow capacity
of each fan with 0.37 kW electrical motor power is 7
m
3h
-1at zero static pressure. Airflow directions from
Pad to Fan are parallel to the crop rows.
A submersible water pump in water tank of 200
L has flow rate of 6 m
3h
-1at head of 3 m. The water
lost by evaporation from water tank is compensated
from the tap water via floating valve. The water flow
amount passing through the Pads is controlled by
return valve.
2.3. Measurements
Measurements related with greenhouse environment
were carried out by using seven sensors at different
positions, as well as portable instruments. For this
purpose, the five digital temperature and humidity
sensors (SHT75, accuracy: ± 0.3 °C for temperature
and ±1.8% for humidity, Sensirion, Zurich,
Switzerland) and two pyranometers (CM6, accuracy:
± 5 Wm
-2, Kipp and Zonen, The Netherlands) were
used. Among them, two were located outside
greenhouse for external measurements. The rest
one pyranometer above the crop canopy, four
temperature and humidity sensors were mounted
within the crop canopy along the greenhouse.
Furthermore, a portable thermo-hygrometer
(AZ8721, accuracy: ± 0.5 °C for temperature and
±2% for humidity, AZ Instrument, Shangai, China)
and a portable hot wire anemometer (Lutron AM4204,
accuracy: ± 0.8 °C for temperature and ±1% for air
velocity, Taipei, Taiwan) were used for instrumentation
at different locations for greenhouse experiments.
SHT75 is a digital sensor with high accuracy,
which is fully calibrated at the factory. SHT75
sensors were used together with programmable
PIC16F628 microcontroller-based data acquisition
modules (Microchip, AZ, USA). Each module was
connected to a desktop computer over single serial
bus line based on RS-232 settings (2400 baud rate,
8 data bits, no parity, and 1 stop bit) for serial data
transmission. Temperature and humidity data were
measured for every one minute, and were recorded in
text files. Readings coming from two pyranometers
were logged for every 30 minutes. Data logged
were monitored by using a GUI program written in
Borland Delphi 7. Wind speed data were taken from
records of meteorological station in campus.
The sensor positions are illustrated in Figure
3 with numbers given from (1) to (7). (1): outside
temperature and humidity sensor, (2-3-4-5): inside
temperature and humidity sensors, (6): inside
pyranometer, and (7): outside pyranometer. The
sensors with numbers of (1-6-7) were mounted on
a metal stand at 2.2 m of height from the ground
outside greenhouse. The sensors with numbers of
(2-3-4-5) were placed at intervals of 2.2 m at heights of
Sera Fan-Pad Soğutma Sisteminin Performans Analizi: Yatay Sıcaklık ve Bağıl Nem Değişimleri, Dayıoğlu & Silleli
136
Ta r ı m B i l i m l e r i D e r g i s i – J o u r n a l o f A g r i c u l t u r a l S c i e n c e s21 (2015) 132-143
1.25 m above ground within the crop canopy along
the greenhouse. These four sensors were named as
“very close to pad”, “next to pad”, “middle”, and
“next to fan”, respectively.
Figure 3- Positions of sensors placed inside and
outside greenhouse, 1 … 5, temperature and
humidity sensors; 6-7, pyranometers
Şekil 3- Sera içine ve dışına yerleştirilen sensörlerin
konumları, 1… 5, sıcaklık ve bağıl nem sensörleri; 6-7,
güneş ışınım sensörleri
2.4. Performance parameters
The difference between the outside temperature
and inside temperature can be used as an important
parameter to describe the cooling performance
of Fan-Pad system. For this purpose, as an easy
criterion, the cooling effect of Fan-Pad system is
calculated from
5
0.8°C for temperature and 1% for air velocity, Taipei, Taiwan) were used for instrumentation at different locations for greenhouse experiments.
SHT75 is a digital sensor with high accuracy, which is fully calibrated at the factory. SHT75 sensors were used together with programmable PIC16F628 microcontroller-based data acquisition modules (Microchip, AZ, USA). Each module was connected to a desktop computer over single serial bus line based on RS-232 settings (2400 baud rate, 8 data bits, no parity, and 1 stop bit) for serial data transmission. Temperature and humidity data were measured for every one minute, and were recorded in text files. Readings coming from two pyranometers were logged for every 30 minutes. Data logged were monitored by using a GUI program written in Borland Delphi 7. Wind speed data were taken from records of meteorological station in campus.
The sensor positions are illustrated in Figure 3 with numbers given from (1) to (7). (1): outside temperature and humidity sensor, (2-3-4-5): inside temperature and humidity sensors, (6): inside pyranometer, and (7): outside pyranometer. The sensors with numbers of (1-6-7) were mounted on a metal stand at 2.2 m of height from the ground outside greenhouse. The sensors with numbers of (2-3-4-5) were placed at intervals of 2.2 m at heights of 1.25 m above ground within the crop canopy along the greenhouse. These four sensors were named as “very close to pad”, “next to pad”, “middle”, and “next to fan”, respectively.
Figure 3- Positions of sensors placed inside and outside greenhouse, 1 … 5, temperature and humidity sensors; 6-7, pyranometers
Şekil 3-Sera içine ve dışına yerleştirilen sensörlerin konumları, 1… 5, sıcaklık ve bağıl nem sensörleri; 6-7, güneş ışınım sensörleri
2.4. Performance parameters
The difference between the outside temperature and inside temperature can be used as an important parameter to describe the cooling performance of Fan-Pad system. For this purpose, as an easy criterion, the cooling effect of Fan-Pad system is calculated from
ti
to
t
Δ ce
=
-
(1)Where; to, outside air temperature (°C); ti, inside air temperature (°C).
The cooling efficiency (η) is determined as the ratio between the drop in air temperature after passing through the Pad and the maximum drop under conditions of air saturation.
100
×
1
-1
2
-1
=
(
)
twb
)
(
tdb
)
(
tdb
)
(
tdb
η
(2)Where; η, cooling efficiency (%); tdb(1), the outside dry-bulb temperature of entering air to Pad (°C); tdb(2),
the dry-bulb temperature of leaving air form Pad (°C); twb(1), the outside wet-bulb temperature of entering air to
Pad. However, two psychrometric properties of entering air to the system must be known:
(1)
Where; t
o, outside air temperature (°C); t
i, inside air
temperature (°C).
The cooling efficiency (η) is determined as
the ratio between the drop in air temperature after
passing through the Pad and the maximum drop
under conditions of air saturation.
5
0.8°C for temperature and 1% for air velocity, Taipei, Taiwan) were used for instrumentation at different locations for greenhouse experiments.
SHT75 is a digital sensor with high accuracy, which is fully calibrated at the factory. SHT75 sensors were used together with programmable PIC16F628 microcontroller-based data acquisition modules (Microchip, AZ, USA). Each module was connected to a desktop computer over single serial bus line based on RS-232 settings (2400 baud rate, 8 data bits, no parity, and 1 stop bit) for serial data transmission. Temperature and humidity data were measured for every one minute, and were recorded in text files. Readings coming from two pyranometers were logged for every 30 minutes. Data logged were monitored by using a GUI program written in Borland Delphi 7. Wind speed data were taken from records of meteorological station in campus.
The sensor positions are illustrated in Figure 3 with numbers given from (1) to (7). (1): outside temperature and humidity sensor, (2-3-4-5): inside temperature and humidity sensors, (6): inside pyranometer, and (7): outside pyranometer. The sensors with numbers of (1-6-7) were mounted on a metal stand at 2.2 m of height from the ground outside greenhouse. The sensors with numbers of (2-3-4-5) were placed at intervals of 2.2 m at heights of 1.25 m above ground within the crop canopy along the greenhouse. These four sensors were named as “very close to pad”, “next to pad”, “middle”, and “next to fan”, respectively.
Figure 3- Positions of sensors placed inside and outside greenhouse, 1 … 5, temperature and humidity sensors; 6-7, pyranometers
Şekil 3-Sera içine ve dışına yerleştirilen sensörlerin konumları, 1… 5, sıcaklık ve bağıl nem sensörleri; 6-7, güneş ışınım sensörleri
2.4. Performance parameters
The difference between the outside temperature and inside temperature can be used as an important parameter to describe the cooling performance of Fan-Pad system. For this purpose, as an easy criterion, the cooling effect of Fan-Pad system is calculated from
ti
to
t
Δ ce
=
-
(1)Where; to, outside air temperature (°C); ti, inside air temperature (°C).
The cooling efficiency (η) is determined as the ratio between the drop in air temperature after passing through the Pad and the maximum drop under conditions of air saturation.
100
×
1
-1
2
-1
=
(
)
twb
)
(
tdb
)
(
tdb
)
(
tdb
η
(2)Where; η, cooling efficiency (%); tdb(1), the outside dry-bulb temperature of entering air to Pad (°C); tdb(2),
the dry-bulb temperature of leaving air form Pad (°C); twb(1), the outside wet-bulb temperature of entering air to
Pad. However, two psychrometric properties of entering air to the system must be known:
(2)
Where; η, cooling efficiency (%); t
db(1), the outside
dry-bulb temperature of entering air to Pad (°C); t
db(2),
the dry-bulb temperature of leaving air form Pad (°C);
t
wb(1), the outside wet-bulb temperature of entering
air to Pad. However, two psychrometric properties of
entering air to the system must be known:
1. Dry bulb temperature and the wet-bulb
temperature, or
2. Dry bulb temperature and relative humidity
If both dry bulb temperature (t
db) and the
wet-bulb temperature (t
wb) is measured directly, the
cooling efficiency can be calculated by substituting
into equation (2). If dry-bulb temperature (t
db)
of air and relative humidity (rh) are known, its
wet-bulb temperature (t
wb) can be calculated by
using psychrometric equations. The method of
psychrometric calculations due to sensors used
at measurements was employed to determine the
cooling efficiency of evaporative Fan-Pad system.
2.5. Method of psychrometric calculations
The following psychrometric equations given by
ASHRAE (2005) were used in all calculations.
Relative humidity is defined as the ratio of the
water vapor pressure to the saturation water vapor
pressure at all temperature and pressures:
6
1. Dry bulb temperature and the wet-bulb temperature, or 2. Dry bulb temperature and relative humidity
If both dry bulb temperature (tdb) and the wet-bulb temperature (twb) is measured directly, the cooling
efficiency can be calculated by substituting into equation (2). If dry-bulb temperature (tdb) of air and relative
humidity (rh) are known, its wet-bulb temperature (twb) can be calculated by using psychrometric equations. The
method of psychrometric calculations due to sensors used at measurements was employed to determine the cooling efficiency of evaporative Fan-Pad system.
2.5. Method of psychrometric calculations
The following psychrometric equations given by ASHRAE (2005) were used in all calculations. Relative humidity is defined as the ratio of the water vapor pressure to the saturation water vapor pressure at all temperature and pressures:
Pws
Pw
rh =
(3)The humidity ratio (W, also known as moisture content or mixing ratio) of a given moist air sample is defined with following equation as functions of partial pressure of water vapor and total pressure (Pa):
Pw
P
Pw
.
W
=
0
62198
-
(4)The total barometric pressure of moist air can be calculated according to altitude (Z):
)
Z
(
.
P
=
101
325
1
-
2.25577
×
10
-5 5.2559 (5)The humidity ratio at saturation (Ws) can be calculated by substituting Pws instead ofPw in equation (4).
The saturation vapor pressure over liquid water for temperature range of 0-200oC is given by following
equation:
)
T
ln(
C
T
C
T
C
T
C
C
T
C
)
P
ln(
ws 3 6 5 2 4 3 2 1+
+
+
+
+
=
(6) Where; C1=-5800.2206, C2=1.3914993, C3=-4.8640239x10⁻², C4=4.1764768x10⁻⁵, C5=-1.4452093x10⁻⁸, C6=6.5459673.In (6) equation, saturation pressure Pws is calculated in Pa, using T the absolute temperature (K=°C+273.15).
2.6. Adiabatic saturation process
Evaporative cooling is an adiabatic process at constant enthalpy that is no heat loss and heat gain. It utilizes the exchange of energy between air and water. The energy needed to evaporate water is taken from the air, thus reducing air temperature. The energy in the air can be divided into two parts: sensible heat and latent heat. Sensible heat is a quantitative measure of the air temperature. Latent heat is the energy needed to evaporate the water in the air.
The enthalpy balance as follows to calculate the humidity ratio of moist air for the adiabatic condition must be defined (ASHRAE 2005):
(3)
The humidity ratio (W, also known as moisture
content or mixing ratio) of a given moist air sample
is defined with following equation as functions of
partial pressure of water vapor and total pressure (Pa):
6
1. Dry bulb temperature and the wet-bulb temperature, or 2. Dry bulb temperature and relative humidity
If both dry bulb temperature (tdb) and the wet-bulb temperature (twb) is measured directly, the cooling
efficiency can be calculated by substituting into equation (2). If dry-bulb temperature (tdb) of air and relative
humidity (rh) are known, its wet-bulb temperature (twb) can be calculated by using psychrometric equations. The
method of psychrometric calculations due to sensors used at measurements was employed to determine the cooling efficiency of evaporative Fan-Pad system.
2.5. Method of psychrometric calculations
The following psychrometric equations given by ASHRAE (2005) were used in all calculations. Relative humidity is defined as the ratio of the water vapor pressure to the saturation water vapor pressure at all temperature and pressures:
Pws
Pw
rh =
(3)The humidity ratio (W, also known as moisture content or mixing ratio) of a given moist air sample is defined with following equation as functions of partial pressure of water vapor and total pressure (Pa):
Pw
P
Pw
.
W
=
0
62198
-
(4)The total barometric pressure of moist air can be calculated according to altitude (Z):
)
Z
(
.
P
=
101
325
1
-
2.25577
×
10
-5 5.2559 (5)The humidity ratio at saturation (Ws) can be calculated by substituting Pws instead ofPw in equation (4).
The saturation vapor pressure over liquid water for temperature range of 0-200oC is given by following
equation:
)
T
ln(
C
T
C
T
C
T
C
C
T
C
)
P
ln(
ws 3 6 5 2 4 3 2 1+
+
+
+
+
=
(6) Where; C1=-5800.2206, C2=1.3914993, C3=-4.8640239x10⁻², C4=4.1764768x10⁻⁵, C5=-1.4452093x10⁻⁸, C6=6.5459673.In (6) equation, saturation pressure Pws is calculated in Pa, using T the absolute temperature (K=°C+273.15).
2.6. Adiabatic saturation process
Evaporative cooling is an adiabatic process at constant enthalpy that is no heat loss and heat gain. It utilizes the exchange of energy between air and water. The energy needed to evaporate water is taken from the air, thus reducing air temperature. The energy in the air can be divided into two parts: sensible heat and latent heat. Sensible heat is a quantitative measure of the air temperature. Latent heat is the energy needed to evaporate the water in the air.
The enthalpy balance as follows to calculate the humidity ratio of moist air for the adiabatic condition must be defined (ASHRAE 2005):
(4)
The total barometric pressure of moist air can be
calculated according to altitude (Z):
6
1. Dry bulb temperature and the wet-bulb temperature, or 2. Dry bulb temperature and relative humidity
If both dry bulb temperature (tdb) and the wet-bulb temperature (twb) is measured directly, the cooling
efficiency can be calculated by substituting into equation (2). If dry-bulb temperature (tdb) of air and relative
humidity (rh) are known, its wet-bulb temperature (twb) can be calculated by using psychrometric equations. The
method of psychrometric calculations due to sensors used at measurements was employed to determine the cooling efficiency of evaporative Fan-Pad system.
2.5. Method of psychrometric calculations
The following psychrometric equations given by ASHRAE (2005) were used in all calculations. Relative humidity is defined as the ratio of the water vapor pressure to the saturation water vapor pressure at all temperature and pressures:
Pws
Pw
rh =
(3)The humidity ratio (W, also known as moisture content or mixing ratio) of a given moist air sample is defined with following equation as functions of partial pressure of water vapor and total pressure (Pa):
Pw
P
Pw
.
W
=
0
62198
-
(4)The total barometric pressure of moist air can be calculated according to altitude (Z):
)
Z
(
.
P
=
101
325
1
-
2.25577
×
10
-5 5.2559 (5)The humidity ratio at saturation (Ws) can be calculated by substituting Pws instead ofPw in equation (4).
The saturation vapor pressure over liquid water for temperature range of 0-200oC is given by following
equation:
)
T
ln(
C
T
C
T
C
T
C
C
T
C
)
P
ln(
ws 3 6 5 2 4 3 2 1+
+
+
+
+
=
(6) Where; C1=-5800.2206, C2=1.3914993, C3=-4.8640239x10⁻², C4=4.1764768x10⁻⁵, C5=-1.4452093x10⁻⁸, C6=6.5459673.In (6) equation, saturation pressure Pws is calculated in Pa, using T the absolute temperature (K=°C+273.15).
2.6. Adiabatic saturation process
Evaporative cooling is an adiabatic process at constant enthalpy that is no heat loss and heat gain. It utilizes the exchange of energy between air and water. The energy needed to evaporate water is taken from the air, thus reducing air temperature. The energy in the air can be divided into two parts: sensible heat and latent heat. Sensible heat is a quantitative measure of the air temperature. Latent heat is the energy needed to evaporate the water in the air.
The enthalpy balance as follows to calculate the humidity ratio of moist air for the adiabatic condition must be defined (ASHRAE 2005):
(5)
The humidity ratio at saturation (W
s) can
be calculated by substituting P
wsinstead of
P
win
equation (4).
The saturation vapor pressure over liquid water
for temperature range of 0-200
oC is given by
following equation:
6 1. Dry bulb temperature and the wet-bulb temperature, or
2. Dry bulb temperature and relative humidity
If both dry bulb temperature (tdb) and the wet-bulb temperature (twb) is measured directly, the cooling
efficiency can be calculated by substituting into equation (2). If dry-bulb temperature (tdb) of air and relative
humidity (rh) are known, its wet-bulb temperature (twb) can be calculated by using psychrometric equations. The
method of psychrometric calculations due to sensors used at measurements was employed to determine the cooling efficiency of evaporative Fan-Pad system.
2.5. Method of psychrometric calculations
The following psychrometric equations given by ASHRAE (2005) were used in all calculations. Relative humidity is defined as the ratio of the water vapor pressure to the saturation water vapor pressure at all temperature and pressures:
PwsPw
rh = (3)
The humidity ratio (W, also known as moisture content or mixing ratio) of a given moist air sample is defined with following equation as functions of partial pressure of water vapor and total pressure (Pa):
Pw
PPw
.
W=062198 - (4)
The total barometric pressure of moist air can be calculated according to altitude (Z):
) Z (
.
P=1013251-2.25577×10⁻⁵ 5.2559 (5)
The humidity ratio at saturation (Ws) can be calculated by substituting Pws instead ofPw in equation (4).
The saturation vapor pressure over liquid water for temperature range of 0-200oC is given by following
equation: ) T ln( C T C T C T C C T C ) P ln( ws 3 6 5 2 4 3 2 1+ + + + + = (6) Where; C1=-5800.2206, C2=1.3914993, C3=-4.8640239x10⁻², C4=4.1764768x10⁻⁵, C5=-1.4452093x10⁻⁸, C6=6.5459673.
In (6) equation, saturation pressure Pws is calculated in Pa, using T the absolute temperature (K=°C+273.15). 2.6. Adiabatic saturation process
Evaporative cooling is an adiabatic process at constant enthalpy that is no heat loss and heat gain. It utilizes the exchange of energy between air and water. The energy needed to evaporate water is taken from the air, thus reducing air temperature. The energy in the air can be divided into two parts: sensible heat and latent heat. Sensible heat is a quantitative measure of the air temperature. Latent heat is the energy needed to evaporate the water in the air.
The enthalpy balance as follows to calculate the humidity ratio of moist air for the adiabatic condition must be defined (ASHRAE 2005):
(6)
Where;
C
1=-5800.2206,
C
2=1.3914993,
137
Ta r ı m B i l i m l e r i D e r g i s i – J o u r n a l o f A g r i c u l t u r a l S c i e n c e s21 (2015) 132-143
C
3=-4.8640239x10
-2,
C
4=4.1764768x10
-5,
C
5=-1.4452093x10
-8,
C
6=6.5459673.
In (6) equation, saturation pressure P
wsis
calculated in Pa, using T the absolute temperature
(K=°C+273.15).
2.6. Adiabatic saturation process
Evaporative cooling is an adiabatic process at constant
enthalpy that is no heat loss and heat gain. It utilizes
the exchange of energy between air and water. The
energy needed to evaporate water is taken from the
air, thus reducing air temperature. The energy in the
air can be divided into two parts: sensible heat and
latent heat. Sensible heat is a quantitative measure of
the air temperature. Latent heat is the energy needed
to evaporate the water in the air.
The enthalpy balance as follows to calculate
the humidity ratio of moist air for the adiabatic
condition must be defined (ASHRAE 2005):
7
h
h
)
W
W
(
h
wb s wb w wb s-
=
+
(7)Where; h, moist air specific enthalpy in kJ per kg dry air;
W
swb, humidity ratio at saturation point at wet bulbtemperature; W, humidity ratio of moist air;
h
wwb, specific enthalpy in kJ per kg water of water added at wet bulbtemperature;
h
swb, specific enthalpy of moist air at wet bulb temperature in saturation. In equation (3), substituting h,h
wwb, andh
swb is solved for humidity ratio:t
.
t
.
db
)
t
t
(
.
W
)
t
.
(
W
wb wb db wb s wb186
4
-86
1
+
2501
-006
1
-326
2
-2501
=
(8) 2.7. Computation procedureIn order to calculate the cooling efficiency of system according to equation (2), the wet-bulb temperatures need to be known. The wet-bulb temperatures were calculated with a convergence of W4 – W8 0.0005 from (3) to
(8) equations using an iterative procedure written in Matlab 2007b (Mathworks, Natick, MA, USA).
3. Results and Discussion
The experiments were conducted under greenhouse conditions in Ankara at 26 – 30 August of 2009 when the crop was at full maturity. The external and internal climate data including solar radiation, temperature, humidity, and air speed were measured. During operating Fan-Pad cooling system, which was operated for approximately 2-4 hours daily, the internal shading nets were used to provide the more efficient cooling.
3.1. External conditions
Figure 4 indicates data that characterize the external climate during the experiment periods. As seen in Figure 4, the external air temperature, the relative humidity, the solar radiation, the wind speed ranged between 30 - 33°C, 20 - 25%, 600 - 860 W m-2 and 2.1 - 3.8 m s-1 during high solar radiation hours (12:00 – 15:00), respectively.
Figure 4- Daily variations of solar radiation, temperature, humidity, wind speed data measured outside greenhouse (26 August 2009)
Şekil 4- Sera dışında ölçülen güneş ışınımı, sıcaklık, bağıl nem ve rüzgâr hızı verilerinin günlük değişimleri (26 Ağustos 2009)
(7)
Where; h, moist air specific enthalpy in kJ per kg
dry air;
7
h
h
)
W
W
(
h
wb s wb w wb s-
=
+
(7)Where; h, moist air specific enthalpy in kJ per kg dry air;
W
swb, humidity ratio at saturation point at wet bulbtemperature; W, humidity ratio of moist air;
h
wwb, specific enthalpy in kJ per kg water of water added at wet bulb temperature;h
swb, specific enthalpy of moist air at wet bulb temperature in saturation.In equation (3), substituting h,
h
wwb, andh
swb is solved for humidity ratio:t
.
t
.
db
)
t
t
(
.
W
)
t
.
(
W
wb wb db wb s wb186
4
-86
1
+
2501
-006
1
-326
2
-2501
=
(8) 2.7. Computation procedureIn order to calculate the cooling efficiency of system according to equation (2), the wet-bulb temperatures need to be known. The wet-bulb temperatures were calculated with a convergence of W4 – W8 0.0005 from (3) to
(8) equations using an iterative procedure written in Matlab 2007b (Mathworks, Natick, MA, USA).
3. Results and Discussion
The experiments were conducted under greenhouse conditions in Ankara at 26 – 30 August of 2009 when the crop was at full maturity. The external and internal climate data including solar radiation, temperature, humidity, and air speed were measured. During operating Fan-Pad cooling system, which was operated for approximately 2-4 hours daily, the internal shading nets were used to provide the more efficient cooling.
3.1. External conditions
Figure 4 indicates data that characterize the external climate during the experiment periods. As seen in Figure 4, the external air temperature, the relative humidity, the solar radiation, the wind speed ranged between 30 - 33°C, 20 - 25%, 600 - 860 W m-2 and 2.1 - 3.8 m s-1 during high solar radiation hours (12:00 – 15:00), respectively.
Figure 4- Daily variations of solar radiation, temperature, humidity, wind speed data measured outside greenhouse (26 August 2009)
Şekil 4- Sera dışında ölçülen güneş ışınımı, sıcaklık, bağıl nem ve rüzgâr hızı verilerinin günlük değişimleri (26 Ağustos 2009)
,
humidity ratio at saturation point at
wet bulb temperature; W, humidity ratio of moist
air;
7
h
h
)
W
W
(
h
wb s wb w wb s-
=
+
(7)Where; h, moist air specific enthalpy in kJ per kg dry air;
W
swb, humidity ratio at saturation point at wet bulbtemperature; W, humidity ratio of moist air; wb w
h
, specific enthalpy in kJ per kg water of water added at wet bulb temperature;h
swb, specific enthalpy of moist air at wet bulb temperature in saturation.In equation (3), substituting h,
h
wwb, andh
swb is solved for humidity ratio:t
.
t
.
db
)
t
t
(
.
W
)
t
.
(
W
wb wb db wb s wb186
4
-86
1
+
2501
-006
1
-326
2
-2501
=
(8) 2.7. Computation procedureIn order to calculate the cooling efficiency of system according to equation (2), the wet-bulb temperatures need to be known. The wet-bulb temperatures were calculated with a convergence of W4 – W8 0.0005 from (3) to
(8) equations using an iterative procedure written in Matlab 2007b (Mathworks, Natick, MA, USA).
3. Results and Discussion
The experiments were conducted under greenhouse conditions in Ankara at 26 – 30 August of 2009 when the crop was at full maturity. The external and internal climate data including solar radiation, temperature, humidity, and air speed were measured. During operating Fan-Pad cooling system, which was operated for approximately 2-4 hours daily, the internal shading nets were used to provide the more efficient cooling.
3.1. External conditions
Figure 4 indicates data that characterize the external climate during the experiment periods. As seen in Figure 4, the external air temperature, the relative humidity, the solar radiation, the wind speed ranged between 30 - 33°C, 20 - 25%, 600 - 860 W m-2 and 2.1 - 3.8 m s-1 during high solar radiation hours (12:00 – 15:00), respectively.
Figure 4- Daily variations of solar radiation, temperature, humidity, wind speed data measured outside greenhouse (26 August 2009)
Şekil 4- Sera dışında ölçülen güneş ışınımı, sıcaklık, bağıl nem ve rüzgâr hızı verilerinin günlük değişimleri (26 Ağustos 2009)
, specific enthalpy in kJ per kg water of
water added at wet bulb temperature;
7
h
h
)
W
W
(
h
wb s wb w wb s-
=
+
(7)Where; h, moist air specific enthalpy in kJ per kg dry air;
W
swb, humidity ratio at saturation point at wet bulbtemperature; W, humidity ratio of moist air;
h
wwb, specific enthalpy in kJ per kg water of water added at wet bulb temperature; wbs
h
, specific enthalpy of moist air at wet bulb temperature in saturation. In equation (3), substituting h, wbw
h
, and wb sh
is solved for humidity ratio:t
.
t
.
db
)
t
t
(
.
W
)
t
.
(
W
wb wb db wb s wb186
4
-86
1
+
2501
-006
1
-326
2
-2501
=
(8) 2.7. Computation procedureIn order to calculate the cooling efficiency of system according to equation (2), the wet-bulb temperatures need to be known. The wet-bulb temperatures were calculated with a convergence of W4 – W8 0.0005 from (3) to
(8) equations using an iterative procedure written in Matlab 2007b (Mathworks, Natick, MA, USA).
3. Results and Discussion
The experiments were conducted under greenhouse conditions in Ankara at 26 – 30 August of 2009 when the crop was at full maturity. The external and internal climate data including solar radiation, temperature, humidity, and air speed were measured. During operating Fan-Pad cooling system, which was operated for approximately 2-4 hours daily, the internal shading nets were used to provide the more efficient cooling.
3.1. External conditions
Figure 4 indicates data that characterize the external climate during the experiment periods. As seen in Figure 4, the external air temperature, the relative humidity, the solar radiation, the wind speed ranged between 30 - 33°C, 20 - 25%, 600 - 860 W m-2 and 2.1 - 3.8 m s-1 during high solar radiation hours (12:00 – 15:00), respectively.
Figure 4- Daily variations of solar radiation, temperature, humidity, wind speed data measured outside greenhouse (26 August 2009)
Şekil 4- Sera dışında ölçülen güneş ışınımı, sıcaklık, bağıl nem ve rüzgâr hızı verilerinin günlük değişimleri (26 Ağustos 2009)
, specific
enthalpy of moist air at wet bulb temperature in
saturation.
In equation (3), substituting h,
7
h
h
)
W
W
(
h
+
wbs-
wbw=
wbs (7)Where; h, moist air specific enthalpy in kJ per kg dry air;
W
swb, humidity ratio at saturation point at wet bulbtemperature; W, humidity ratio of moist air;
h
wwb, specific enthalpy in kJ per kg water of water added at wet bulb temperature;h
swb, specific enthalpy of moist air at wet bulb temperature in saturation.In equation (3), substituting h,
h
wwb, andh
swb is solved for humidity ratio:t
.
t
.
db
)
t
t
(
.
W
)
t
.
(
W
wb wb db wb s wb186
4
-86
1
+
2501
-006
1
-326
2
-2501
=
(8) 2.7. Computation procedureIn order to calculate the cooling efficiency of system according to equation (2), the wet-bulb temperatures need to be known. The wet-bulb temperatures were calculated with a convergence of W4 – W8 0.0005 from (3) to
(8) equations using an iterative procedure written in Matlab 2007b (Mathworks, Natick, MA, USA).
3. Results and Discussion
The experiments were conducted under greenhouse conditions in Ankara at 26 – 30 August of 2009 when the crop was at full maturity. The external and internal climate data including solar radiation, temperature, humidity, and air speed were measured. During operating Fan-Pad cooling system, which was operated for approximately 2-4 hours daily, the internal shading nets were used to provide the more efficient cooling.
3.1. External conditions
Figure 4 indicates data that characterize the external climate during the experiment periods. As seen in Figure 4, the external air temperature, the relative humidity, the solar radiation, the wind speed ranged between 30 - 33°C, 20 - 25%, 600 - 860 W m-2 and 2.1 - 3.8 m s-1 during high solar radiation hours (12:00 – 15:00), respectively.
Figure 4- Daily variations of solar radiation, temperature, humidity, wind speed data measured outside greenhouse (26 August 2009)
Şekil 4- Sera dışında ölçülen güneş ışınımı, sıcaklık, bağıl nem ve rüzgâr hızı verilerinin günlük değişimleri (26 Ağustos 2009)
, and
7
h
h
)
W
W
(
h
+
wbs-
wbw=
wbs (7)Where; h, moist air specific enthalpy in kJ per kg dry air;
W
swb, humidity ratio at saturation point at wet bulbtemperature; W, humidity ratio of moist air;
h
wwb, specific enthalpy in kJ per kg water of water added at wet bulb temperature;h
swb, specific enthalpy of moist air at wet bulb temperature in saturation.In equation (3), substituting h,
h
wwb, andh
swb is solved for humidity ratio:t
.
t
.
db
)
t
t
(
.
W
)
t
.
(
W
wb wb db wb s wb186
4
-86
1
+
2501
-006
1
-326
2
-2501
=
(8) 2.7. Computation procedureIn order to calculate the cooling efficiency of system according to equation (2), the wet-bulb temperatures need to be known. The wet-bulb temperatures were calculated with a convergence of W4 – W8 0.0005 from (3) to
(8) equations using an iterative procedure written in Matlab 2007b (Mathworks, Natick, MA, USA).
3. Results and Discussion
The experiments were conducted under greenhouse conditions in Ankara at 26 – 30 August of 2009 when the crop was at full maturity. The external and internal climate data including solar radiation, temperature, humidity, and air speed were measured. During operating Fan-Pad cooling system, which was operated for approximately 2-4 hours daily, the internal shading nets were used to provide the more efficient cooling.
3.1. External conditions
Figure 4 indicates data that characterize the external climate during the experiment periods. As seen in Figure 4, the external air temperature, the relative humidity, the solar radiation, the wind speed ranged between 30 - 33°C, 20 - 25%, 600 - 860 W m-2 and 2.1 - 3.8 m s-1 during high solar radiation hours (12:00 – 15:00), respectively.
Figure 4- Daily variations of solar radiation, temperature, humidity, wind speed data measured outside greenhouse (26 August 2009)
Şekil 4- Sera dışında ölçülen güneş ışınımı, sıcaklık, bağıl nem ve rüzgâr hızı verilerinin günlük değişimleri (26 Ağustos 2009)
is solved
for humidity ratio:
7
h
h
)
W
W
(
h
wb s wb w wb s-
=
+
(7)Where; h, moist air specific enthalpy in kJ per kg dry air; wb s
W
, humidity ratio at saturation point at wet bulbtemperature; W, humidity ratio of moist air;
h
wwb, specific enthalpy in kJ per kg water of water added at wet bulbtemperature;
h
swb, specific enthalpy of moist air at wet bulb temperature in saturation. In equation (3), substituting h,h
wwb, andh
swb is solved for humidity ratio:t
.
t
.
db
)
t
t
(
.
W
)
t
.
(
W
wb wb db wb s wb186
4
-86
1
+
2501
-006
1
-326
2
-2501
=
(8) 2.7. Computation procedureIn order to calculate the cooling efficiency of system according to equation (2), the wet-bulb temperatures need to be known. The wet-bulb temperatures were calculated with a convergence of W4 – W8 0.0005 from (3) to
(8) equations using an iterative procedure written in Matlab 2007b (Mathworks, Natick, MA, USA).
3. Results and Discussion
The experiments were conducted under greenhouse conditions in Ankara at 26 – 30 August of 2009 when the crop was at full maturity. The external and internal climate data including solar radiation, temperature, humidity, and air speed were measured. During operating Fan-Pad cooling system, which was operated for approximately 2-4 hours daily, the internal shading nets were used to provide the more efficient cooling.
3.1. External conditions
Figure 4 indicates data that characterize the external climate during the experiment periods. As seen in Figure 4, the external air temperature, the relative humidity, the solar radiation, the wind speed ranged between 30 - 33°C, 20 - 25%, 600 - 860 W m-2 and 2.1 - 3.8 m s-1 during high solar radiation hours (12:00 – 15:00), respectively.
Figure 4- Daily variations of solar radiation, temperature, humidity, wind speed data measured outside greenhouse (26 August 2009)
Şekil 4- Sera dışında ölçülen güneş ışınımı, sıcaklık, bağıl nem ve rüzgâr hızı verilerinin günlük değişimleri (26 Ağustos 2009)
(8)
2.7. Computation procedure
In order to calculate the cooling efficiency of system
according to equation (2), the wet-bulb temperatures
need to be known. The wet-bulb temperatures were
calculated with a convergence of W
4– W
8@ ±
0.0005 from (3) to (8) equations using an iterative
procedure written in Matlab 2007b (Mathworks,
Natick, MA, USA).
3. Results and Discussion
The experiments were conducted under greenhouse
conditions in Ankara at 26 – 30 August of 2009
when the crop was at full maturity. The external
and internal climate data including solar radiation,
temperature, humidity, and air speed were measured.
During operating Fan-Pad cooling system, which
was operated for approximately 2-4 hours daily, the
internal shading nets were used to provide the more
efficient cooling.
3.1. External conditions
Figure 4 indicates data that characterize the external
climate during the experiment periods. As seen in
Figure 4, the external air temperature, the relative
humidity, the solar radiation, the wind speed ranged
between 30 - 33 °C, 20 - 25%, 600 - 860 W m
-2and
2.1 - 3.8 m s
-1during high solar radiation hours
(12:00 – 15:00), respectively.
3.2. Internal conditions
Internal solar radiation was approximately
proportional to the external solar radiation.
However, the internal solar radiation decreased, for
example by 43.5% at noon, because of greenhouse
frame, top radiant heater, cover and shading nets
(Figure 5). During test trials, the solar radiation
measured above plants ranged between 200 and 370
W m
-2. Figures 6 and 7 show the daily variations
of temperature and humidity data measured at 2,
3, 4, 5 sensors positions along greenhouse. The
temperature and humidity profiles were determined
along horizontal axis between Fan and Pad at a daily
time scale. Numbers in figures show the sensor
positions: (1) external, (2) very close to Pad, (3)
2.2 m away from Pad, (4) middle (4.4 m away from
Pad), and (5) next to Fan (6.6 m away from Pad).
Figures present how to change levels of temperature
and humidity along greenhouse.
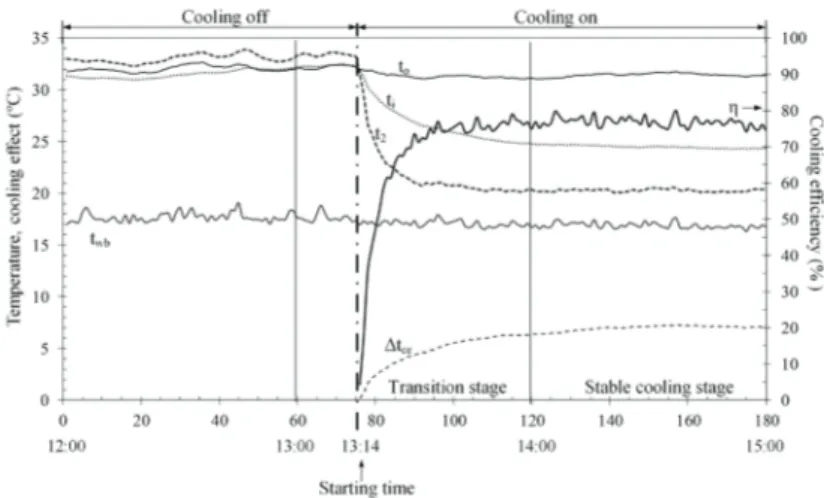
Cooling system was run up from 13:14 to 17:00,
which were hours to be effective of cooling (Figures
6 and 7). It must be emphasized that the performance
of Fan-Pad cooling system was analyzed for the time
interval of 180 minutes. Hence, the two time stages
were selected, one of which was 12:00 – 13:00 time
Sera Fan-Pad Soğutma Sisteminin Performans Analizi: Yatay Sıcaklık ve Bağıl Nem Değişimleri, Dayıoğlu & Silleli
138
Ta r ı m B i l i m l e r i D e r g i s i – J o u r n a l o f A g r i c u l t u r a l S c i e n c e s21 (2015) 132-143
stages which turned off the cooling system. The
other of which was 14:00 – 15:00 time stage which
turned on the system. At these time stages, the levels
of hourly mean solar radiation prevailing above
plants were approximately 350 Wm
-2(cooling off),
and 270 Wm
-2(cooling on), respectively.
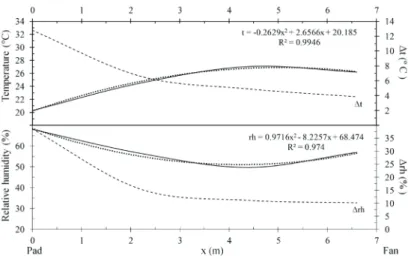
The variations of temperature and humidity along
greenhouse were evaluated for two time stages.
When turning off system between 12:00 and 13:00,
the levels of hourly mean temperature calculated for
2, 3, 4 and 5 sensors positions were approximately
33 °C, 31 °C, 32 °C, and 30 °C, respectively, along
the horizontal axis from Pad to Fan, After turning
on Fan-Pad system, when being stable cooling
conditions between 14:00 and 15:00, levels of hourly
mean temperature for 2, 3, 4 and 5 sensors positions
dropped to approximately 20 °C, 24 °C, 27 °C, and
26°C, and air at these points were colder as much as
12.75 °C, 6.6 °C, 4.9 °C and 3.8 °C, respectively.
When turning off Fan-Pad system, the levels of
hourly mean humidity calculated for 2, 3, 4 and 5
sensors positions were approximately 30%, 41%,
Figure 4- Daily variations of solar radiation, temperature, humidity, wind speed data measured outside
greenhouse (26 August 2009)
Şekil 4- Sera dışında ölçülen güneş ışınımı, sıcaklık, bağıl nem ve rüzgâr hızı verilerinin günlük değişimleri (26
Ağustos 2009)
Figure 5- Daily variations of internal and external solar radiation (26 August 2009)
139
Ta r ı m B i l i m l e r i D e r g i s i – J o u r n a l o f A g r i c u l t u r a l S c i e n c e s21 (2015) 132-143
39%, and 47%, respectively. It must be emphasized
that the relative humidity levels inside greenhouse
were more because of crop transpiration, even
turning off the system. At 14:00 – 15:00, levels
of hourly mean humidity calculated for 2, 3, 4
and 5 sensors positions rose up to approximately
68%, 56%, 50%, and 57%, respectively. The air
at measurement positions along greenhouse was
more humid as much as 38%, 15%, 11% and 10%,
respectively. These results are integrated in Table 1
for both temperature and humidity gradients.
Our results are consistent with findings of past
studies by Kittas et al (2001, 2003); Bartzanas & Kittas
(2005); Al-Helal et al (2006); Teitel et al (2010); Lopez
et al (2012) related to the temperature and humidity
distributions. For example, in a study performed by
Figure 6- Daily variations of temperatures
measured at different locations outside and inside a
greenhouse cooled with Fan-Pad system (26 August
2009); Sensor positions: 1, outside; 2, pad; 3, next to
pad; 4, middle; 5, next to fan
Şekil 6- Fan- Pad sistemi ile soğutulan bir seranın içinde
ve dışında farklı konumlarda ölçülen sıcaklıkların
günlük değişimi (26 Ağustos 2009); Sensör konumları:
1, dış; 2, pad; 3, pade yakın; 4, orta; 5, fana yakın
Figure 7- Daily variations of relative humidity
measured at different locations outside and inside
greenhouse of a greenhouse cooled with Fan-Pad
system (26 August 2009); Sensor positions: 1, outside;
2, pad; 3, next to pad; 4, middle; 5, next to fan
Şekil 7- Fan- Pad sistemi ile soğutulan bir seranın
içinde ve dışında farklı konumlarda ölçülen bağıl nemin
günlük değişimi (26 Ağustos 2009); Sensör konumları:
1, dış; 2, pad; 3, pade yakın; 4, orta; 5, fana yakın
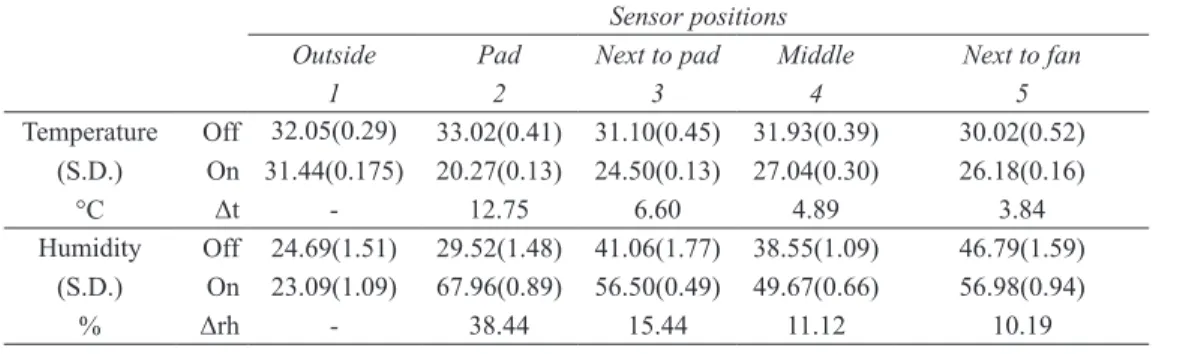
Table 1- Gradients of temperature and humidity according to sensor positions during periods turning off
(12:00 – 13:00) and on (14:00 – 15:00) of cooling system
Çizelge 1- Soğutma sisteminin kapalı (12:00 – 13:00) ve açık (14:00 – 15:00) olduğu periyotlarda sensör
konumlarına göre sıcaklık ve bağıl nem değişimleri
Sensor positions
Outside Pad Next to pad Middle Next to fan
1 2 3 4 5 Temperature (S.D.) °C Off 32.05(0.29) 33.02(0.41) 31.10(0.45) 31.93(0.39) 30.02(0.52) On 31.44(0.175) 20.27(0.13) 24.50(0.13) 27.04(0.30) 26.18(0.16) Δt - 12.75 6.60 4.89 3.84 Humidity (S.D.) % Off 24.69(1.51) 29.52(1.48) 41.06(1.77) 38.55(1.09) 46.79(1.59) On 23.09(1.09) 67.96(0.89) 56.50(0.49) 49.67(0.66) 56.98(0.94) Δrh - 38.44 15.44 11.12 10.19