Low serum 25(OH)D levels are assocıated to hıgher BMI and metabolic syndrome
parameters in adult subjects in Turkey
Guler Tosunbayraktar1, Murat Bas2, Altug Kut3, Aylin Hasbay Buyukkaragoz2
1. Baskent University, Health Sciences Faculty, Department of Nutrition and Dietetics, Ankara, Turkey 2. Acıbadem University, Health Sciences Faculty, Department of Nutrition and Dietetics, Istanbul, Turkey 3. Baskent University, Department of Family Medicine, Faculty of Medicine, Ankara, Turkey
Abstract
Background: The aim of this study was to investigate the association of 25(OH)D levels with biochemical, anthropometric, and metabolic data obtained from normal and obese people.
Methods: This study was carried out on 90 individuals between the ages of 18 to 63 that had various body mass indexes. Blood samples and anthropometric measurements were taken.
Results: Waist circumferences, fat mass, LDL cholesterol levels, HDL cholesterol levels, 25(OH)D levels, and triglyceride levels were significantly different according to the body mass index groups of the participants (p<0.05). When compared to the normal body mass index group, both other groups (overweight and obese) had higher waist circumferences, triglyceride levels, LDL cholesterol levels, fasting insulin levels, HOMA-IR ratios, parathyroid hormone levels, and fat mass, and had lower 25(OH)D levels (p<0.05). The overweight group participants had higher 25(OH)D levels than the obese group, and had lower waist circumferences, fat mass, fasting insulin level, HOMA-IR ratios, and HbA1C and PTH levels than those in the obese group (p<0.05).
Conclusion: In conclusion, the mean level of 25(OH)D is very low in overweight and obese individuals and low serum 25(OH)D levels appear to be associated with obesity, visceral obesity, hypertriglyceridemia, insulin resistance, and metabolic syndrome in obese patients.
Keywords: Obesity, vitamin D, metabolic syndrome DOI: http://dx.doi.org/10.4314/ahs.v15i4.15
Cite as: Tosunbayraktar G, Bas M, Kut A, Buyukkaragoz AH. Low serum 25(OH)D levels are assocıated to hıgher BMI and metabolic syndrome parameters in adults subjects in Turkey. Afri Health Sci. 2015;15(4):1161-9. http://dx.doi.org/10.4314/ahs.v15i4.15
Introduction
25(OH)D deficiency is an important public health problem in both developed and developing countries, with a reported worldwide prevalence of 30–80% in children and adults1-3. The role of 25(OH)D in bone mineralisation is well-documented. However, numer-ous recent studies have reported a link between 25(OH) D deficiency and several chronic disorders, such as type
Corresponding author: Murat Bas,
Acıbadem University, Health Sciences Faculty,
Department of Nutrition and Dietetics, İçerenköy Mahallesi Kayışdağı Caddesi No:32, Istanbul, Turkey.
Tel: +90 216 5004230
E-mail: [email protected]
1 diabetes mellitus, systemic lupus erythematosus, mul-tiple sclerosis, cardiovascular disease, and several malig-nancies4-6.
Positive associations between 25(OH)D deficiency and the prevalence of obesity have been shown. Recent studies in the adult population suggested that adequate serum 25(OH)D levels could be connected with in-creased adipocyte activity and oxidation of fat, as well as the potential for improving insulin sensitivity, which can lead to weight loss7,8. The synthesis and processing of 25(OH)D confirmed that obese patients have lower basal 25(OH)D and higher serum parathyroid hormone concentrations than do nonobese people9-11. Several studies have shown that obese individuals tend to have lower serum concentrations of vitamin D3 and 25(OH) D3 than those with normal weights9-12. For example, in one study, whole-body irradiation produced an increase in serum vitamin D3 levels in obese individuals [body
mass index (BMI) 30 kg/m2] that was 57% lower than that in age-matched, normal weight controls (BMI 25)13. Since there is an inverse relationship between 25(OH) D levels, the degree of obesity14, and central adiposity15, it has been difficult to distinguish the independent ef-fects of obesity and 25(OH)D on metabolic syndrome. Furthermore, it is not known whether the association between 25(OH)D deficiency and the metabolic syn-drome is still present at very high degrees of obesity, in which the possible effect of 25(OH)D status on the metabolic syndrome could be ameliorated or even com-pletely overcome by the predominant effect of obesi-ty16.
Several mechanisms have been proposed to explain the low 25(OH)D levels in obese people and include the sequestration of 25(OH)D by fat tissues17, as well as body size18. On the other hand, abnormal fasting serum or plasma lipid levels are the most prominent symp-toms resulting from obesity19, and the effect of 25(OH) D supplementation on lipid profiles remains controver-sial20.
Studies showed that in Turkey, 25(OH)D deficiency is an important problem. There have been few studies about obesity and 25(OH)D levels in the Turkish pop-ulation21,22. The aim of this study was to investigate the association of 25(OH)D levels and certain biochemical, antropometric, and metabolic data in normal and obese people.
Methods
Study population
This study was performed with the participation of 90 individuals between the ages of 18 and 63 with vari-ous BMIs that were admitted to the Endocrinology de-partment of the Başkent University Ankara hospital’s Ümitköy polyclinic from June to November 2013. They were healthy and thus did not have any health prob-lems at the time of admission. People who were using any kind of medicines, vitamins, or minerals were not included in this study. Pregnant or lactating women, as well as people with a pre-diagnosed diseases or those diagnosed with a disease during the study period, were not excluded.
Clinical and anthropometric characteristics
Height, weight, waist and hip circumferences were
Height was measured using a stadiometer accurate to ±0.5 cm, and weight was obtained with participants wearing light clothing and no shoes using a calibrat-ed scale, accurate to ±0.1 kg (Filizola S.A., São Paulo, SP, Brazil). The BMI was calculated using the stand-ard equation (kilograms per meters squared). The waist circumference was measured with participants in the standing position, midway between the lower margin of the last rib and the iliac crest, at mid exhalation. The hip circumference was measured at the widest point of the hip/buttocks area with the measuring tape parallel to the floor. The waist-to-hip ratio was determined by dividing waist circumference by hip circumference. An-thropometric measurements were taken twice, and the mean values were used in all analyses. Systolic blood pressure (SBP) and diastolic blood pressure (DBP) were measured twice in the sitting position, with 15 min be-tween the measurements, using standard sphygmoma-nometers of appropriate width, after a rest period for 30 min.
Biochemical analysis
The percentage of body fat was estimated by electrical bioimpedance using a Jawon IOI 353 body fat analyser (Biodynamics Corp., Seattle, WA, USA). We stratified adiposity as global adiposity (excessive adipose tissue, independent of site) and abdominal adiposity. BMI and percentage of body fat were used as global adiposity parameters. The waist circumference and waist-to-hip ratio were used to evaluate abdominal adiposity. Blood samples were collected after a 12 h fasting period. Bio-chemical evaluation included glucose, total cholesterol, high-density lipoprotein cholesterol, low-density lipo-protein cholesterol, triacylglycerols, calcium, phosfor, HbA1C, parathyroid hormone (PTH), and 25(OH)D. Fasting plasma glucose, total cholesterol, HDL-choles-terol, LDL-cholesHDL-choles-terol, TG, HbA1C, and calcium levels were measured using original kits and an Abbott-Aer-oset autoanalyser (Architect C-8000, Chicago, Illinois, USA). Parathyroid hormone and fasting plasma insulin levels were measured using original kits using an Perfect Plus 400 autoanalyser (Mindray, UK). Insulin resistance was estimated from fasting serum measurements using the homeostasis model assessment-insulin resistance (HOMA-IR) [insulin (μU/mL) X glucose (mg/dL) ÷ 425]. Metabolic syndrome was diagnosed according to NCEPATP III23. Thus, a participant had MS if he or she had three or more of the following: (i) abdominal
cm in women; (ii) plasma triglycerides: ≥150 mg/dL; (iii) plasma HDL cholesterol: <40 mg/dL in men and <50 mg/dL in women; (iv) SBP: ≥130 mmHg, DBP: ≥85 mmHg, or the use of antihypertensive medicine; (v) plasma glucose: ≥110 mg/dL or the use of antidia-betic medicine/insulin.
Statistical analysis
Data are reported as mean ±SD for continuous vari-ables and as numbers or a percentage for categorical variables. Clinical and biochemical characteristics were compared using the Student’s t test or the chi-square test when the variables were continuous or categorical, respectively. The Pearson correlation test was used to evaluate associations between serum 25(OH)D and components of anthropometric and metabolic
syn-drome. Statistical analyses were performed using SPSS software, version 16.0 (SPSS Inc., Chicago, IL, USA).
Results
Waist circumferences, fat mass, and LDL cholesterol, HDL cholesterol, 25(OH)D, and triglyceride levels were significantly different according to the BMI groups of the participants (p<0.05; Table 1). When compared to the normal BMI group, both other groups (overweight and obese) had lower waist circumference, triglycer-ide levels, LDL cholesterol levels, fasting insulin levels, HOMA-IR ratios, parathyroid hormone levels, and fat mass, and had higher 25(OH)D levels (p<0.05). The overweight group had higher 25(OH)D levels than obese group, and had lower waist circumferences, fat masses, fasting insulin levels, HOMA-IR ratios, and HbA1C and PTH levels than the obese group (p<0.05). Table 1. Changes in biochemical and anthropometric indices between BMI classifications
Variables Normal (n=30) Overweight (n=30) (n=30) Obese p Mean SD Mean SD Mean SD
Age (year) 31.8 6.9 36.5 10.0 36.1 8.7 a, b, c p<0.05 BMI (kg/m2) 22.1 2.1 26.4 1.3 33.1 3.2 a, b, c p<0.05 WC (cm) 78.6 7.5 88.9 6.7 103.6 10.7 a, b, c p<0.05 DBP 72.3 7.3 72.0 9.0 82.5 7.4 b, c p<0.05 SBP 109.3 8.3 108.3 11.8 124.8 12.1 b, c p<0.05 Fat mass (kg) 15.1 3.8 21.4 5.8 34.9 6.6 a, b, c p<0.05 Fat mass (%) 22.8 5.8 28.8 5.6 33.8 5.4 a, b, c p<0.05 Fasting glucose (mg/dL) 90.2 8.1 93.6 8.0 96.4 9.9 b p<0.05 TC (mg/dL) 172.7 29.4 183.5 37.6 196.4 40.3 b p<0.05 LDL-C (mg/dL) 106.3 24.0 125.8 33.0 133.5 35.6 a, b p<0.05 HDL-C (mg/dL) 52.9 12.3 44.6 13.3 44.2 8.8 a, b p<0.05 TG (mg/dL) 90.2 44.0 142.5 61.9 127.0 65.9 a, b p<0.05 Fasting insulin (μU/ mL) 7.0 2.9 8.1 3.0 12.8 3.9 b, c p<0.05 HOMA-IR ratio 1.6 0.7 1.9 0.7 3.1 1.1 b, c p<0.05 HbA1C (%) 5.2 0.5 5.3 0.5 5.7 0.7 b, c p<0.05 25(OH)D (μg/L) 27.5 8.3 21.3 5.8 16.2 4.4 a, c p<0.05 Blood Ca (mg/dL) 9.5 0.4 9.3 0.3 9.3 0.3 b p<0.05 PTH (pg/mL) 40.1 16.8 42.5 15.0 52.8 23.0 b, c p<0.05
BMI, body mass index;WC, waist circumference; BP, blood pressure; HDL-C, high density lipoprotein-cholesterol; LDL-C, low density lipoprotein-lipoprotein-cholesterol; TG, triglyceride; Ca, calcium; and PTH, parathyroid hormone.
a significant diffrences between normal weight and overweight (p<0.05). b significant diffrences between normal weight and obese (p<0.05). c significant diffrences between overweight and obese (p<0.05).
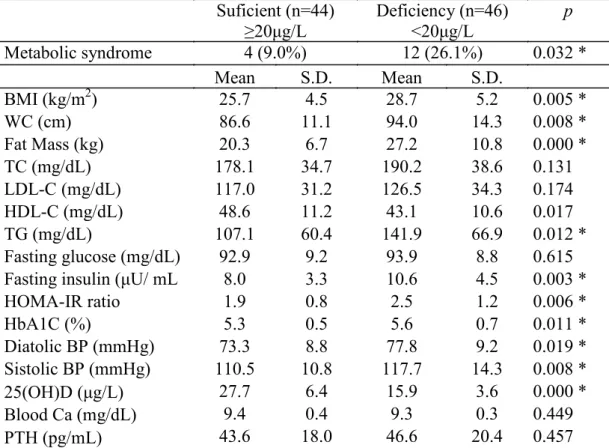
Table 2 lists the clinical and biochemical characteristics of the participants separated according to 25(OH) D levels: <20 ng/mL (deficiency) and ≥20 ng/mL (suffi-ciency). The mean TG and HDL-C level was significant-ly different in the sufficiency group than in the deficien-cy group (p<0.05). The deficiendeficien-cy group had slightly higher mean blood PTH, TC, LDL-C, TG, and fasting
glucose levels when compared to those in the sufficien-cy group, although this trend was not statistically signif-icant (p>0.05). The mean BMI, WC, fat mass, fasting insulin levels, HOMA-IR ratios, and HbA1C, DPB, and SBP levels were significantly lower in the sufficiency group than in the deficiency group (p<0.05).
Table 2. Characteristics of participants based on serum 25(OH)D concentrations Suficient (n=44) ≥20μg/L Deficiency (n=46) <20μg/L p Metabolic syndrome 4 (9.0%) 12 (26.1%) 0.032 * Mean S.D. Mean S.D. BMI (kg/m2) 25.7 4.5 28.7 5.2 0.005 * WC (cm) 86.6 11.1 94.0 14.3 0.008 * Fat Mass (kg) 20.3 6.7 27.2 10.8 0.000 * TC (mg/dL) 178.1 34.7 190.2 38.6 0.131 LDL-C (mg/dL) 117.0 31.2 126.5 34.3 0.174 HDL-C (mg/dL) 48.6 11.2 43.1 10.6 0.017 TG (mg/dL) 107.1 60.4 141.9 66.9 0.012 * Fasting glucose (mg/dL) 92.9 9.2 93.9 8.8 0.615 Fasting insulin (μU/ mL 8.0 3.3 10.6 4.5 0.003 *
HOMA-IR ratio 1.9 0.8 2.5 1.2 0.006 * HbA1C (%) 5.3 0.5 5.6 0.7 0.011 * Diatolic BP (mmHg) 73.3 8.8 77.8 9.2 0.019 * Sistolic BP (mmHg) 110.5 10.8 117.7 14.3 0.008 * 25(OH)D (μg/L) 27.7 6.4 15.9 3.6 0.000 * Blood Ca (mg/dL) 9.4 0.4 9.3 0.3 0.449 PTH (pg/mL) 43.6 18.0 46.6 20.4 0.457
BMI, body mass index; WC, waist circumference; BP, blood pressure; HDL-C, high density lipoprotein-cholesterol; LDL-C, low density lipoprotein-cholesterol; TG, triglyceride; Ca, calcium; and PTH, parathyroid hormone.
* significantly different between the two groups (p<0.05).
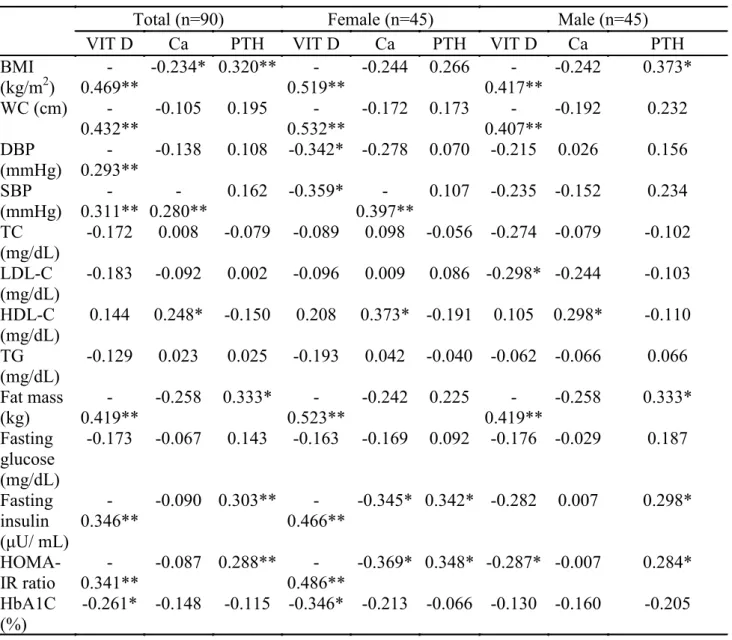
The Pearson's correlation coefficients (r) for selected baseline variables are shown in Table 3. At baseline, 25(OH)D levels correlated inversely with BMIs (r =
−0.469; p = 0.000), waist circumferences (r = −0.432; P = 0.000), fat masses (r = −0.419; p = 0.004), fasting insulin levels (r = −0.432; p = 0.000), and HOMA-IR (r = −0.341; p = 0.001).
Table 3. Relationship between serum 25(OH)D levles and anthropometric and metabolic risk factors
Total (n=90) Female (n=45) Male (n=45)
VIT D Ca PTH VIT D Ca PTH VIT D Ca PTH
BMI (kg/m2) 0.469** - -0.234* 0.320** 0.519** - -0.244 0.266 0.417** - -0.242 0.373* WC (cm) -0.432** -0.105 0.195 0.532** - -0.172 0.173 0.407** - -0.192 0.232 DBP (mmHg) 0.293** - -0.138 0.108 -0.342* -0.278 0.070 -0.215 0.026 0.156 SBP (mmHg) 0.311** - 0.280** - 0.162 -0.359* 0.397** - 0.107 -0.235 -0.152 0.234 TC (mg/dL) -0.172 0.008 -0.079 -0.089 0.098 -0.056 -0.274 -0.079 -0.102 LDL-C (mg/dL) -0.183 -0.092 0.002 -0.096 0.009 0.086 -0.298* -0.244 -0.103 HDL-C (mg/dL) 0.144 0.248* -0.150 0.208 0.373* -0.191 0.105 0.298* -0.110 TG (mg/dL) -0.129 0.023 0.025 -0.193 0.042 -0.040 -0.062 -0.066 0.066 Fat mass (kg) 0.419** - -0.258 0.333* 0.523** - -0.242 0.225 0.419** - -0.258 0.333* Fasting glucose (mg/dL) -0.173 -0.067 0.143 -0.163 -0.169 0.092 -0.176 -0.029 0.187 Fasting insulin (μU/ mL) -0.346** -0.090 0.303** 0.466** - -0.345* 0.342* -0.282 0.007 0.298* HOMA-IR ratio 0.341** - -0.087 0.288** 0.486** - -0.369* 0.348* -0.287* -0.007 0.284* HbA1C (%) -0.261* -0.148 -0.115 -0.346* -0.213 -0.066 -0.130 -0.160 -0.205
BMI, body mass index; WC, waist circumference; BP, blood pressure; HDL-C, high density lipoprotein-cholesterol; LDL-C, low density lipoprotein-cholesterol; TG, triglyceride; Ca, calcium; and PTH, parathyroid hormone.
* p<0.05 ** p<0.01
Discussion
25(OH)D deficiency is increasingly being recognised worldwide2,24. There have been prevalence studies on 25(OH)D deficiency and/or insufficiency in the Turk-ish population25, and most have been performed on women, people in nursing homes, and the elderly26-28. Also, obesity leads to many health problems world-wide. It is a major public health problem and the most common nutritional disorder29. It is related to a host of health problems. In particular, abdominal obesity is
associated with some serious problems, such as type 2 diabetes, cardiovascular and cerebrovascular diseases, hypertension, digestive disorders, and cancer30. The highest mean prevalence of obesity is 32.05% and was reported in the TEKHARF (men, 21.1%; women, 43.0%). The highest obesity frequency in women was also reported in this study (43.0%). The mean obesi-ty in the TURDEP was 22.3% (men, 12.9%; women, 29.9%)31. Obesity is usually correlated with a higher prevalence of hypovitaminosis or a lower circulating
25(OH)D level32,33. However, in the present study, the prevalence of 25(OH)D deficiency was higher in the overweight and obese groups than in the normal weight group. Over the past few decades, research has shown positive and negative associations between weight loss and maintenance with increased 25(OH)D and calcium intake (particularly with dairy products) in adults34-36. Additionally, studies have demonstrated links between a high BMI and decreased sun exposure, as well as de-creased 25(OH)D levels37.
Previous studies have shown this association between 25(OH)D deficiency and metabolic syndrome in wom-en14 and in the general population15, and our present findings confirm these results also in overweight and obese people. Pittas et al. reported that the risk for developing type 2 diabetes was lower for those whose 25(OH)D levels were higher38. On the other hand, in a study carried out in postmenopausal women, it has been reported that low 25(OH)D levels were not asso-ciated with a risk of developing diabetes39. In our study, the serum 25(OH)D deficieny was associated with high fasting insulin levels and hyperparathyroidism. In cross-sectional and epidemiological studies, the rela-tionship of 25(OH)D deficiency with DM type I, meta-bolic syndrome, obesity, cardiovascular diseases, hyper-tension, and mortality, possibly due to the role of this vitamin in insulin resistance, secretion, and inflammato-ry processes, were reported40-43. It has also been shown that deficiencies in serum 25(OH)D levels decreases insulin secretion by reducing calcium absorption and, therefore, causing secondary hyperparathyroidism and increased peripheral insulin resistance44.
The most promising study to date suggesting that 25(OH)D alters diabetes risk is a post hoc analysis from an osteoporosis intervention study in which 314 nondiabetic white adults were randomised to groups recieving either 700 IU of the vitamins D3 and 500 mg calcium citrate or placebos daily for 3 years. Treat-ment with 25(OH)D and calcium citrate demonstrated attenuated increases in fasting glucose in participants with baseline impaired fasting glucose (IFG), but not in those with normal fasting glucose. Participants with IFG who received 25(OH)D and calcium also had re-duced progression of insulin resistance, as assessed by HOMA-IR45. Conversely, a Women’s Health Initiative (WHI) study reported that daily supplementation with
400 IU of vitamin D3 and 1000 mg of calcium did not reduce risk of developing diabetes over 7 years, when compared to placebo46. In the present study, we found a significant difference between 25(OH)D deficient in-dividuals and those with normal 25(OH)D level regard-ing HOMA-IR and HbA1c levels. This is in agreement with Chiu et al., who observed a positive relationship between 25(OH)D status and insulin sensitivity index in adults. In addition, they showed that 25(OH)D levels were negatively correlated with both first and second phase insulin responses during a hyperglycemic clamp and glucose levels during the oral glucose tolerance test. Therefore, they suggested that subjects with hypovi-taminosis D not only displayed impaired β-cell func-tion, causing impaired glucose homeostasis, but were also at increased risk of developing insulin resistance and metabolic syndrome when compared with vitamin D sufficient subjects47. Also, previous studies showed that serum 25(OH) D levels were inversely correlated with HbA1c, independent of body fat, implying higher ambient glucose concentrations in children with lower 25(OH)D concentrations48,49.
Previous studies showed an inverse relationship be-tween 25(OH)D levels and BMI14, as well as central ad-iposity15, making it difficult to distinguish the separate contributions of obesity and of 25(OH)D to the devel-opment of metabolic syndrome. Similarly, our findings indicated that a low 25(OH)D level is associated with a high BMI and central obesity. In contrast, Botella-Car-ratero et al.16 reported that patients with and without 25(OH)D deficiency had similar BMIs and waist cir-cumferences, so the differences in metabolic syndrome prevalence and lipid levels may indeed reflect a true as-sociation between 25(OH)D status and the metabolic syndrome, irrespective of adiposity.
Low serum 25(OH)D was associated with compo-nents of the metabolic syndrome, including abdom-inal obesity, hypertension, hypertriglyceridemia, and higher HbA1C and lower high-density cholesterol50. In the present study, we found that low serum vitamin D levels related to high abdominal obesity, high body fat, hypertriglyceridemia, and lower high-density choles-terol. Two cross-sectional studies (NHANES III and NHANES 2003–2004) showed a significant inverse as-sociation between serum 25(OH)D concentrations and metabolic syndrome15,51.
In the current study, PTH levels correlated positively with BMI, fat mass, HOMA-IR ratio and fasting insulin levels. The association of PTH with impaired glucose tolerance is part of a newly proposed mechanism un-derlying the development of the metabolic syndrome51. Other studies have also suggested that individuals with hyperparathyroidism have an increased risk of devel-oping type 2 diabetes52. Serum parathyroid concen-trations have an important role in the mechanism of insulin resistance. Lee et al. shown that vitamin D lev-els are negatively correlated with metabolic syndrome frequency independent of serum parathyroid levels53. Hyperparathyriodism secondary to decrease in serum 25(OH)D levels was thought to be the main mechanism causing insulin resistance54. In a study conducted with 1017 morbid obese, Caucasian, male and female sub-jects, parathormone levels were found to be the only predictor of metabolic syndrome rather than vitamin D levels55.
Limitations
This study had some limitations. The main one being the cross-sectional nature of this study, with no causali-ty effect to report. The sunlight exposure and effect of 25(OH)D supplementation on weight gain also need to be considered.
Conclusion
The mean level of 25(OH)D is very low in overweight and obese indiviuals, and low serum 25(OH)D levels appear to be associated with obesity, visceral obesity, hypertriglyceridemia, insulin resistance, and metabolic syndrome in obese individuals. A broad-based effort to prevent 25(OH)D deficiency in Turkey should be un-dertaken.
References
1. Calvo MS, Whiting SJ, Barton CN. Vitamin D in-take: a global perspective of current status. J Nutr. 2005;135:310-316 PubMed .
2. Holick MF. Vitamin D deficiency. N Engl J Med. 2007;357:266- 281 PubMed . doi: 10.1056/NEJM-ra070553
3. Oren Y, Shapira Y, Agmon-Levin N, Kivity S, Za-frir Y, Altman A, Lerner A, Shoenfeld Y. Vitamin D insufficiency in a sunny environment: a demographic and seasonal analysis. Isr Med Assoc J. 2010;12:751-756 PubMed .
4. Amital H, Szekanecz Z, Szucs G, Danko K, Nagy E, Csepany T, Kiss E, Rovensky J, Tuchynova A,
Ko-Barak V, Orbach H, Zandman- Goddard G, Shoen-feld Y. Serum concentrations of 25-OH vitamin D in patients with systemic lupus erythematosus (SLE) are inversely related to disease activity: is it time to routine-ly supplement patients with SLE with vitamin D? Ann Rheum Dis. 2010;69:1155-1157 PubMed . doi: 10.1136/ ard.2009.120329.
5. Ascherio A, Munger KL, Simon KC. Vitamin D and multiple sclerosis. Lancet Neurol. 2010;9:599-612. doi: 10.1016/S1474-4422(10)70086-7.
6. Trump DL, Deeb KK, Johnson CS. Vitamin D: con-siderations in the continued development as an agent for cancer prevention and therapy. Cancer J. 2010;16:1-9 PubMed . doi: 10.1097/PPO.0b013e3181c51ee6. 7. Rosenblum JL, Castro VM, Moore CE, Kaplan LM. Calcium and vitamin D supplementation is asso-ciated with decreased abdominal visceral adipose tis-sue in overweight and obese adults. Am. J. Clin. Nutr. 2012;95(1):101–108. doi: 10.3945/ajcn.111.019489. 8. Mai X-M, Chen Y, Camargo CA Jr, Langhammer A. Cross-Sectional and Prospective Cohort Study of Serum 25-Hydroxyvitamin D Level and Obesity in Adults: The HUNT Study. American Journal of Epidemiol-ogy. 2012. doi: 10.1093/aje/kwr456.
9. Compston JE, Vedi S, Ledger JE, Webb A, Gazet JC, Pilkington TRE. Vitamin D status and bone histomorphometry in gross obesity. Am J Clin Nutr. 1981;34:2359– PubMed ;63.
10. Hey H, Stockholm KH, Lund BJ, Sorensen OH. Vitamin D deficiency in obese patients and changes in circulating vitamin D metabolites following jejunoileal bypass. Int J Obes. 1982;6:473–9.
11. Hyldstrup L, Andersen T, McNair P, Breum L, Transbol I. Bone metabolism in obesity: changes relat-ed to severe overweight and dietary weight rrelat-eduction. Acta Endocrinol. 1993;129:393– PubMed ;8.
12. Bell NH, Epstein S, Greene A, Shary J, Oexmann MJ, Shaw S. Evidence for alteration of the vitamin D-endocrine system in obese subjects. J Clin Invest. 1985; 76: 370– PubMed ;373.
13. Liel Y, Ulmer E, Shary J, Hollis BW, Bell NH. Low circulating vitamin D in obesity. Calcif Tissue Int. 1988; 43: 199– PubMed ;201.
14. Liu S, Song Y, Ford ES, Manson JE, Buring JE, Rid-ker PM. Dietary calcium, vitamin D, and the prevalence of metabolic syndrome in middle-aged and older US women. Diabetes Care. 2005;28: 2926– PubMed ;32. 15. Ford ES, Ajani UA, McGuire LC, Liu S. Concentra-tions of serum vitamin D and the metabolic syndrome among US adults. Diabetes Care. 2005;28:1228– PubMed
16. Botella-Carretero JI, Alvarez-Blasco F, Villafruela JJ, Balsa JA, Vázquez C, Escobar-Morreale HF: Vitamin D deficiency isassociated with the metabolic syndrome in morbid obesity. Clin Nutr. 2007; 26: 573-580.
17. Wortsman J, Matsuoka LY, Chen TC, et al. De-creased bioavailability of vitamin D in obesity. Am J Clin Nutr. 2000; 72, 690-3 PubMed .
18. Drincic AT, Armas LA, Van Diest EE, et al. Vol-umetric dilution, rather than sequestration best ex-plains the low vitamin d status of obesity. Obesity (Silver Spring). 2012; 20, 1444-8. doi: 10.1038/oby.2011. 19. Franssen R, Monajemi H, Stroes ES, et al. Obesity and dyslipidemia. Med Clin North Am. 2011; 95, 893-902 PubMed . doi: 10.1016/j.mcna.2011.06.003. 20. Wang H, Xia N, Yang Y, et al. Influence of vita-min D supplementation on plasma lipid profiles: a me-ta-analysis of randomized controlled trials. Lipids Health Dis. 2012; 11, 42. doi: 10.1186/1476-511X-11-42. 21. Çizmecioğlu FM, Etiler N, Görmüş U, Hamzaoğ-lu O, Hatun Ş. Hypovitaminosis D in obese and over-weight schoolchildren. J Clin Res Pediatr Endocrinol. 2008;1:89–96.
22. Ergür AT, Berberoğlu M, Atasay B, Şıklar Z, Bilir P, Arsan S, et al. Vitamin D deficiency in Turkish mothers and their neonates and in women of reproductive age. J Clin Res Pediatr Endocrinol. 2009;1:266–9. doi: 10.4274/ jcrpe.v1i6.266. Epub 2009 Nov 3.
23. Third Report of the National Cholesterol Edu-cation Program (NCEP) Expert Panel on Detection, Evaluation, and Treatment of High Blood Cholesterol in Adults (Adult Treatment Panel III) final report. Cir-culation. 2002;106:3143-421 PubMed .
24. Lips P: Vitamin D deficiency and secondary hy-perparathyroidism in the elderly: consequences for bone loss and fractures and therapeutic implications. Endocr Rev. 2001, 22:477-501 PubMed . doi: 0163-769X/01/$03.00/0
25. Nesibe Andıran, Nurullah Celik, Halise Akca, Guz-ide Doğan. Vitamin D Deficiency in Children and Ad-olescents. J Clin Res Pediatr Endocrinol. 2012;4(1):25-29. doi: 10.4274/jcrpe.574.
26. Atli T, Gullu S, Uysal AR, Erdogan G: The preva-lence of vitamin D deficiency and effects of ultraviolet light on vitamin D levels in elderly Turkish population. Arch Gerontol Geriatr. 2005, 40:53-60.
27. Alagöl F, Shihadeh Y, Boztepe H, Tanakol R, Yar-man S, Azizlerli H, Sandalci O: Sunlight exposure and vitamin D deficiency in Turkish women. J Endocrinol In-vest. 2000, 23:173-177 PubMed .
28. Guzel R, Kozanoglu E, Guler-Uysal F, Soyupak S, Sarpel T: Vitamin D status and bone mineral density of veiled and unveiled Turkish women. J Womens Health Gend Based Med. 2001, 10:765-770.
29. Yanowski, S.Z., & Yanowski, J.A. Obesity. N Engl J Med. 2002; 346:591-602 PubMed .
30. Jia WP, Xiang KS, Chen L, et al. Epidemiological study on obesity and its comorbidities in urban Chinese older than 20 years of age in Shanghai, China. Obes Rev. 2002;3:157-65 PubMed .
31. Bagriacik, N., Onat, H., Ilhan, B., Tarakci, T., Oşar, Z., Ozyazar, O., Hatemi, H.H., & Yildiz, G. Obesity profile in Turkey. Int J Diabetes & Metabolism. 2009;17: 5-8 PubMed .
32. Ernst B, Thurnheer M, Schmid SM, et al. Seasonal variation in the deficiency of 25-hydroxyvitamin D(3) inmildly to extremely obese subjects. Obes Surg. 2009; 19, 180-3 PubMed . doi: 10.1007/s11695-008-9636-2. 33. Rodriguez-Rodriguez E, Navia B, Lopez-Sobaler AM, et al. Vitamin D in overweight/obese women and its relationship with dietetic and anthropometric vari-ables. Obesity (Silver Spring). 2009; 17, 778-82. doi: 10.1038/oby.2008.649.
34. Harkness LS, Bonny AE. Calcium and vitamin D status in the adolescent: key roles for bone, body weight, glucose tolerance, and estrogen biosynthesis. J Pediatr Adolesc Gynecol. 2005; 18: 305-311.
35. Berkey CS, Rockett HRH, Willet WC, Colditz GA. Milk, dairy fat, dietary calcium, and weight gain: a lon-gitudinal study of adolescents. Arch Pediatr Adolesc Med. 2005; 159: 543-550.
36. Troiano RP, Flegal KM. Overweight children and adolescents: description epidemiology, and demograph-ics. Pediatrdemograph-ics. 1998; 101(3): 497 PubMed -504.
37. Kull M, Kallikorm R, Lember M. Body mass index determines sunbathing habits: implications on vitamin D levels. Intern Med J. 2009; 39: 256-258 PubMed . doi: 10.1111/j.1445-5994.
38. Pittas AG, Sun Q, Manson JE, Dawson-Hughes B, Hu FB. Plasma 25-hydroxyvitamin D concentration and risk of incident type 2 diabetes in women. Diabe-tes Care. 2010;33(9):2021 PubMed -2023. doi: 10.2337/ dc10-0790.
39. Robinson JG, Manson JE, Larson J, Liu S, Song Y, Howard BV, et al. Lack of association between 25(OH) D levels and incident type 2 diabetes in older wom-en. Diabetes Care. 2011;34(3):628 PubMed -634. doi: 10.2337/dc10-1632.
be-tween concentrations of vitamin D and concentrations of insulin, glucose, and HbA1c among adolescents in the United States. Diabetes Care. 2011;34(3):646-648. doi: 10.2337/dc10-1754.
41. Holick MF. Vitamin D: evolutionary, physiological and health perspectives. Curr Drug Targets. 2011;12(1):4 PubMed -18.
42. Zittermann A, Gummert JF, Borgermann J. Vi-tamin D and mortality. Curr Opin Clin Nutr Me-tab Care. 2009;12(6):634-639. doi: 10.1097/ MCO.0b013e3283310767.
43. Gupta AK, Brashear MM, Johnson WD. Prediabe-tes and Prehypertension in healthy adults are associated with low vitamin D levels. Diabetes Care. 2011;34(3):658 PubMed -660. doi: 10.2337/dc10-1829.
44. Procopio M, Borretta G. Derangement of glucose metabolism in hyperparathyroidism. J Endocrinol Invest. 2003;26(11):1136-1142.
45. Pittas AG, Harris SS, Stark PC, Dawson-Hughes B. The effects of calcium and vitamin D supplementation on blood glucose and markers of inflammation in non-diabetic adults. Diabetes Care. 2007; 30:980– PubMed ;986.
46. Boer IH, Tinker LF, Connelly S, et al. Calcium plus vitamin D supplementation and the risk of incident di-abetes in the Women’s Health Initiative. Diabetes Care. 2008; 31:701– PubMed ;707. doi: 10.2337/dc07-1829. 47. Chiu KC, Chu A, Go VLW, Saad MF. Hypovitamin-osis D is associated with insulin resistance and β-cell dysfunction. Am J Clin Nutr. 2004;39:820–825.
48. Scragg R, Holdaway I, Singh V, Metcalf P, Baker J, Dryson E. Serum 25-hydroxyvitamin D3 levels
de-creased in impaired glucose toleranceand diabetes mel-litus. Diabetes Res Clin Pract. 1995;39:181–188.
49. Hypponen E, Power C. Vitamin D status and glu-cose homeostasis in the 1958 British birth cohort: the role of obesity. Diabetes Care. 2006;39:2244–2246. 50. Hypponen E, Boucher BJ, Berry DJ, Power C. 25-Hydroxyvitamin D, IGF-1, and metabolic syndrome at 45 years of age: a cross-sectional study in the 1958 British Birth Cohort. Diabetes. 2008; 57:298– PubMed ;305.
51. Reis JP, von Muhlen D, Miller ER 3rd. Relation of 25-hydroxyvitamin D and parathyroid hormone levels with metabolic syndrome among US adults. Eur J En-docrinol. 2008; 159:41– PubMed ;48. doi: 10.1530/EJE-08-0072.
52. Taylor WH, Khaleeli AA. Coincident diabetesmelli-tus and primary hyperparathyroidism. Diabetes Metab Res Rev. 2001;17(3):175 PubMed –80.
53. Lee DM, Rutter MK, O'Neill TW, Boonen S, Vanderschueren D, et al. Vitamin D, parathyroid hor-mone and the metabolic syndrome in middle-aged and older European men. Eur J Endocrinol. 2009;161: 947-954. doi: 10.1530/EJE-09-0496.
54. Kamycheva E, Sundsfjord J, Jorde R. Serum para-thyroid hormone level is associated with body mass in-dex. The 5th Tromso study. Eur J Endocrinol. 2004;151: 167-172 PubMed .
55. Hjelmesaeth J, Hofsø D, Aasheim ET, Jenssen T, Moan J, et al. Parathyroid hormone, but not vitamin D, is associated with the metabolic syndrome in morbidly obese women and men: a cross-sectional study. Cardio-vasc Diabetol. 2009;8: 7. doi: 10.1186/1475-2840-8-7.