Web Proxy Log Data Mining System for Clustering Users and Search
Keywords
Turgay Tugay Bilgin1*, Mustafa Koray Aytekin2
1Bursa Technical University, DBMMF, Computer Engineering, Bursa, Turkey ([email protected])
2Kidzania İstanbul, Kadıköy, Istanbul, Turkey ([email protected]) *Corresponding Author Received: 21 July 2017 Accepted: 7 November 2017 DOI: 10.18466/cbayarfbe.330088 Abstract
In this study, Internet users were clustered by the search keywords which they type into search bars of search engines. Our proposed software is called UQCS (User Queries Clustering System) and it is developed to demonstrate the efficiency of our hypothesis. UQCS co-operates with the Strehl’s relationship based clustering toolkit and performs segmentation on users based on the keywords they use for searching the web. Internet Proxy server logs were parsed and query strings were extracted from the search engine URL’s and the resulting IP-Term matrix was converted into a similarity matrix using Euclidean, Jaccard, Cosine Distance and Pearson Correlation Distance metrics. K- Means and graph-based OPOSSUM algorithm were used to perform clustering on the similarity matrices. Results were illustrated by using CLUSION visualization toolkit.
Keywords— Data mining, Document clustering, Graph clustering, Web Mining. 1. Introduction
User behavior analysis in web mining is rapidly developing sub-branch of data mining. Surfing habits are analyzed to profile user behavior. Data mining algorithms such as clus-tering, classification and association analysis may be used for analyzing web surfing traces.
In this paper, we have used our proposed UQCS (User Que-ries Clustering System) and Strehl’s MATLAB based “re-lationship based clustering toolkit” [10] for segmentation of internet users. We have retrieved keywords from the Transparent Proxy Server logs of a Turkish School. In order to keep privacy of the data set provider, we will not identify the data set donor. Huge server logs were parsed and query strings were extracted from the search engine URL’s. We have also performed some preprocessing operations such as HTML decoding, UTF conversion and tokenization. IP-Term matrix has been generated and converted into similar-ity matrix using Euclidean, Extended Jaccard, Cosine and Pearson Correlation Distance metrics. We have employed Strehl’s OPOSSUM algorithm [7] which takes similarity matrices as input, and produces cluster labels. Well-known K-Means algorithm is also used for comparison purposes. Since the resulting matrix is high dimensional, we could not
visualize the results by using traditional visualization tech-niques. We have used Strehl’s CLUSION (Cluster Visuali-zation) [7] graphics for visualization.
2. Web Mining
Generally speaking, web mining can be defined as discov-ery and analysis of practical and useful information within stacks of data on the WWW. This data to be used in web mining can be collected from servers, clients, proxy servers or corporate databases. Types of the data vary by the sources it is collected from and its content (text, audio, video etc.) This variability causes differentiation on the web mining applications that will be used to work on the data to a certain extent. Some features of web data may be summarized as below [1]:
1) unlabeled (no identifier); 2) distributed;
3) heterogeneous (mixed media); 4) semi structured;
5) time varying; 6) high dimensional.
The term "web mining" was first used in 1996 by Etzioni [2]. According to Etzioni, Web Mining is the use of data
mining techniques for automatic extraction and discovery of information from documents and services on the WWW. Kosala and Blockeel [4] and Qingyu Zhang and Richard S. Segall [3] proposes to divide Web mining into the following sub-working processes:
a. Source Discovery: Refers to finding unusual docu-ments and services on the web.
b. Data Selection and Preprocessing: Refers to automatic extraction and preprocessing of certain data from newly discovered Web sources.
c. Generalization: Refers to identification of general or common patterns in individual websites or a group of websites.
d. Analysis: Refers to verification and interpretation of the identified patterns.
e. Visualization: Refers to illustration of the analysis re-sults of a more visual and more understandable man-ner.
2.1 Types of Web Mining
Kosala ve Blockeel [3] propose three web mining catego-ries according to data type, which are mining for infor-mation (web content mining), mining on the link structure (web structure mining) and mining for user surfing patterns (web usage mining). Figure 1 shows the categorization of Web Mining and its sub branch structure.
Figure 1. Web Mining Categorization [5].
Mining for information or content mining focuses on de-velopment of techniques to help a user find the documents he/she is searching for by using a certain criterion. Web content mining relies on discovery of useful information about web content including texts, images, audio files, vid-eos etc.
Web structure mining works on the model underlying the
web structure in the form of links. This model aims to ex-plore and examine topological structure rather than defini-tional features. In web structure mining, researchers per-form efficiency and usefulness analyses such as page and site relationship detections by making use of the links be-tween data sources.
Web usage mining covers the techniques of mining of the data created by actions of the users on the web. Actions are obtained from various sources such as proxy server logs, browser logs, user profiles, registry data, user sessions and cookies, user queries, bookmarks and mouse clicks. Server log files constitute the most important portion of web usage mining sources. Server logs are the general name of the logs such as access logs, proxy logs, error logs etc. These files store access information such as user IP ad-dresses, visited URLs, access times and dates, visit results (success, failure, error) and access methods (GET, POST). Website administrators can use this data to increase their service quality by identifying surfing actions and access patterns of each user, thereby offering personalized services to users [5].
3. Relationship based clustering approach
Our proposed user search queries clustering application uses Strehl’s relationship based clustering approach [6]. According to Strehl, clustering is grouping of objects based on relationships among themselves or their similarities. Therefore, similarity space may be used for data clustering as an alternative of the original feature space [6]. Important point here is that, if an appropriate similarity criterion for a problem can be found, calculated distance between data points will be enough for representing the proximity of the objects regardless of the number of attributes (dimensions). Moving the data from the higher dimensional feature space to the similarity space solves the time and complexity prob-lems of multi-dimensionality. Strehl calls this method as "relationship based clustering" [6].
Figure 2. Relationship Based Clustering [6].
Raw data shown as in Figure 2 are converted to feature space as X and subsequently converted into similarity space S by mean of a proper distance metric. Clustering algorithm Φ takes S as input and yields the λ cluster labels as output. In our case, is a group of web pages consisting of n
pages. X is a Term-Document matrix which stores the fre-quencies of the roots of the words of these web pages. The similarities of these pages are calculated by cosine similar-ity in order to transform X into S. Finally, the cluster labels vector is calculated using an appropriate algorithm (Φ) like METIS [8].
Instead of the hierarchical clustering methods, Strehl pro-poses a graph based clustering method called OPOSSUM to cluster web documents and web logs [6]. OPOSSUM generates balanced clusters and it can use non-metric simi-larity measures and it provides a novel tool for visualization in order to find the ideal number of clusters (k) [6]. Clustering problem of OPOSSUM is the problem of parti-tioning a graph into k independent and equal clusters by using a balancing criterion. The objects to be clustered are the vertices of a graph and edge weights are the similarity values of these objects. The clustering problem has been mapped into partitioning of a Vertex weighted graph. The objects to be clustered are viewed as a set of vertices (V =
{ x1, x2,..., xn} ). Two vertices as xa ve xb are connected to each other with an undirected edge of positive weights given by the similarity s(xa, xb). This defines the G = (V,E) graph. An “edge separator” ∆E is an edge cluster that parti-tions the graph G into k independent sub groups when re-moved. Clustering here is the act of finding the edge sepa-rator with the smallest edge weight that will partition the graph into k independent parts. The formula below shows this criterion also known as "minimum cut objective":
(1) While trying to achieve the minimum cut objective, balanc-ing constraint has to be fulfilled.
(2) The left hand side of the inequality is called the imbalance and has a lower bound of 1. The balancing threshold t en-forces perfectly balanced clusters for t=1. In practice t is often chosen to be slightly greater than 1. Thus, in graph partitioning one has to essentially solve a constrained opti-mization problem. Such quest of optimal partitioning is a NP-hard problem and Strehl's proposal for this problem is the METIS algorithm. METIS tackles the multi-constraint, multi-objective graph partitioning problem in three stages [8]. In the first stage known as coarsening or reduction, it produces graphs with fewer details by superimposing adja-cent corners as in Figure 3. Graph size gets reduced repeat-edly.
Strehl proposes a visualization tool called CLUSION (CLUSter VisualizatION tool) for determination of quality of relationship based clustering. CLUSION converts high-dimensional data onto a perceptually more suitable format so that relationships between the data can be seen by human eyes, as well as assisting the clustering process and making verification of the quality of the results easier [7].
Figure 3. Reducing a graph [8].
CLUSION checks the result of the clustering process, rear-ranges data points according to the cluster label and visual-izes the modified similarity matrix (S’). This is called
"coarse seriation". Seriation of the similarity matrix (S’) is
very important to visualization. Since the similarity matrix is two-dimensional, it is ready to be transformed into gray-level image by accepting the white (black) pixels as the minimal (0) - maximal (1) similarity. Gray-level of the pixel in row “a” and column “b” depicts the magnitude of the similarity between samples xa and xb. For this reason, intra-cluster similarity in cluster l is represented by the av-erage density in the corresponding square area on the main diagonal of the matrix. Rectangular areas that are not close to the diagonal show the relationship between two clusters. Brightness of the rectangular areas gives information about the clustering quality. Such visualization of the similarity space makes it possible to have a quick impression of the clusters in the data. Even when there are many data points, existence of k clusters in a data set can be observed [7].
4. User Queries Clustering System
We have developed a user queries clustering system (UQCS) in order to demonstrate our approach. Clustering user queries, i.e. keywords used to search for the web is a type of web mining. We only use “keywords typed on the search engines” for clustering the web users. We do not col-lect any other type of usage data. Therefore, our system does not rely on the tracing the user’s computer or browser. User similarity is calculated by the similarity between the words contained in the user queries.
4.1 Data Set
A proxy server provides an intermediate cache between cli-ent-side browsers and web servers. Proxy servers track and
record each of the http requests. Log files contain each in-dividual HTTP requests made by connected clients. Each row of an access log file keeps the details of the request made for a single document. The details include the name of the machine sending the request, time of a request and the name of the requested document. It also contains infor-mation about the status of the request, response type of the server to this request such as whether the server fulfilled the request or the reason for failure (if fails) and the number of bytes transferred.
In this study, transparent proxy log files of a Turkish School has been used. The dataset has been obfuscated by using random user identifiers and IP numbers in order to keep pri-vacy of the individuals. The file is 3.2 GB plain text which consists of logs of 6-months interval.
4.2 Development Environment and Tools
The Java programming language has been used to develop core application and preprocessing modules. The clustering subsystem is implemented by the METIS graph partition-ing library which is coded in MATLAB programmpartition-ing lan-guage. Natural language processing is one of the most chal-lenging areas of computer science. Intensive use of suffixes in agglutinative languages such as Turkish is an additional source of difficulty for natural language processing studies based on these languages. Zemberek is an open source, platform-independent and general purpose natural lan-guage processing library intended for all Turkic lanlan-guages that intensively add suffixes to words, Turkish in particular [9]. It offers such abilities as spell checking, formal analy-sis, root finding, word structuring, word suggestion, ASCII-fying, DE-ASCII-fying and syllabication. Zemberek is used as a natural language processing (NLP) library for generating IP-Term matrix.
4.3 UQCS Architecture
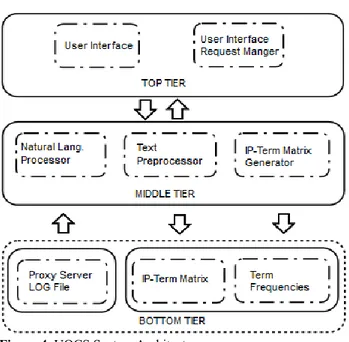
The UQCS system comprises of a three tier layered archi-tecture (Figure 4). The top tier is composed of user interface (MinerUI) and user interface request manager (UIHandler). The intermediate layer of UQCS provides preprocessing, stemming and document term matrix (DTM) generator modules. Main goal of the preprocessing stage is to detect whether there are user queries in each row of the log, and to extract individual search keywords from the URL and to store them in a convenient format in order to feed the clus-tering algorithm.
The bottom tier of the system consists of File Input module for parsing the server logs and File Output module that will write DTM and Term Frequency List into disk. The detailed description of individual modules described in the next sec-tions.
Figure 4. UQCS System Architecture.
4.3.1 Top Tier
User Interface Module helps the user to start the process and identify files for preprocessing. It allows the users to provide parameters for creation of the frequency list and keyword extraction from the URL’s. User Interface Re-quest Manager module is responsible for receiving the re-quests from the user interface and passes the arguments to related modules and manages data exchange between mod-ules.
4.3.2 Middle Tier
This tier contains modules that contribute to preprocessing and computation. Data and parameter exchange between modules take place mostly on this tier. The modules in this layer and the operations they perform are as follows:
a. Text Preprocessor
This module filters and parses the log data file. We have only used Google searches; therefore we have filtered the log file to get only relevant data. Search engines such as Bing, Yandex and Yahoo have been neglected due to the low market share. The UQCS can be simply modified for using other search engines by minor changes such as changing the search engine URL. The log file was parsed
row by row and rows containing
“http://www.google.com.tr/search?” are extracted. IP ad-dress in the row is saved as a feature for IP-Term matrix generation. 1237535391.305 748 10.1.180.106 TCP_MISS/200 122318 GET http://www.google.com.tr/search?hl=tr&q=hal%C4%B1+t emizli%C4%9Fi&meta= 10.1.180.106 DEFAULT_PAR-ENT/ 127.0.0.1 text/html
Figure 5. Sample Row from the Log File
A sample log file line containing a search engine URL is shown in Figure 5. We faced some problems with text en-coding. Search term in the URL was stored in encoded URL format. For example, the string like “halı temizliği” was stored like “hal%C4%B1 +temizli%C4%9Fi” as shown in Figure 5. Our natural language processor library Zemberek does not understand this type of encoding. Therefore, we have employed a URL encoding to UTF-8 converter as an additional preprocessor. The output of converter is shown in Figure 6.
http://www.google.com.tr/search?hl=tr&q=halı temizliği&meta=
Figure 6. Sample output of URL encoding to UTF-8
con-verter.
After the conversion, the next step is to extract the search terms from the URL. The search keywords in the text are located after “q=” or “as_q=” patterns in the URL. These patterns designate the beginning of search string and the "&" mark designates the end of the string. The string be-tween these two patterns was considered as user search string. The IP address and the search strings are stored in a plain text file and sent to natural language processor.
b. Natural language processor (NLP)
NLP module performs cleaning, stop words removal and tokenization. The module stores search string tokens and the IP address of the user for generating IP-Term matrix. On the cleanup step, meaningless symbols, numbers and punctuations marks that typed inadvertently into the query terms were removed (e.g. “k<artepe”, “devex-press+crack+forum”).
Frequently used words with less than three letters such as "ve, de, ki..." in Turkish and “a, an, org, of, and” in English which are called stop words were filtered out. After re-moval, tokenization of the Turkish words has been per-formed by Zemberek library. This necessity arises from ag-glutinative structure of Turkish language. The words with the same root such as “güneşli” (sunny), “güneş” (sun) and “güneşlik” (sunshade) should not be treated as different words while creating the term matrix. The majority of the search terms in the logs are in Turkish. On the other hand, most of the English search terms are already in root form. Therefore, no tokenizations were applied to non-Turkish words.
c. IP-Term Matrix Generator
An IP-term matrix is a mathematical matrix that describes the frequency of search terms that occur in a collection of IP addresses. In an IP-term matrix, rows correspond to IP
addresses that are the clients of proxy server and columns correspond to the tokenized search terms. While creating the matrix, IPs were assigned to the rows so that each row will correspond to one IP address. IP-term matrix module takes the tokenized words and IP addresses file generated in the previous step as an input and counts each individual terms of a particular IP address and fills the relevant matrix cells. After generation, the matrix was scanned by rows and columns to eliminate the terms and the IP addresses which has low frequencies, i.e. terms that were searched too few times and IP addresses that made too few searches. Indeed, this generator is used to export the IP-term matrix to the Strehl’s MATLAB based clustering software which calcu-lates the similarity matrix and perform clustering.
4.4. Clustering and Visualization
IP-term matrix was exported to a file for transferring the data into the Strehl’s Clustering software which runs on MATLAB platform [10]. First, IP-Term Matrix was con-verted into the similarity matrix using similarity metrics such as simcosi (Cosine Distance), simcorr (Pearson Cor-relation), simeucl (Euclid Distance) and simxjac (Extended Jaccard) methods provided by Strehl’s library. The result-ing similarity matrix was then clustered usresult-ing the clusterresult-ing algorithm tools in the same library, which are hierarchical k-means, agglomerative clustering, and graph based clus-tering algorithms. There are two variants of graph based clustering implementation such as “edge-weighted graph partitioning” cgraph and “edge-weighted value-balanced”
clcgraph. Clustering parameter, k value was chosen as 3, 4,
5 and 6 respectively. Generally speaking, explicit clusters were not discovered by any of the clustering methods while working on similarity matrices generated by Euclidean metric. Figure 7 shows the CLUSION graphics of k-means, where k=3 and Figure 8 shows the CLUSION graphs of edge-weighted value-balanced clustering using k=5. As seen on the CLUSION graphics, no apparent clusters exist along the main diagonal.
Euclidean metric (k=3)
Figure 8. Clustering result of proxy users using edge-weighted
value-balanced clustering with Euclidean metric (k=5)
We have repeated the experiments replacing the Euclidean metric by Extended Jaccard (simxjac) metric. The CLU-SION graphics of 3 different clustering algorithms has been given in Figure 9, Figure 10 and Figure 11.
As seen in Figure 9 and 11, we have discovered explicit clusters using graph based algorithm and agglomerative clustering algorithm. But the results are not yet satisfactory. In general, the results obtained using Extended Jaccard metric were poor compared to our expectations.
Figure 9. Clustering result of proxy users using K-Means with
Extended Jaccard similarity (k=3)
As can be seen in Figure 10, we have discovered only one big cluster (singleton) using agglomerative clustering algo-rithm. We could not achieve balanced clustering goal. We repeated the same experiment with various k values. How-ever, the result was almost identical, we only found a sin-gleton.
The best clustering results have been obtained by using
K-Means and edge-weighted value-balanced graph clustering algorithms with Pearson correlation and Cosine distance metric. Figure 12 (a) and (b) shows the CLUSION graphs of K-Means algorithm with Pearson correlation (a) and Co-sine distance (b). The clusters can be easily seen along the main diagonal on the figures.
Figure 10. Clustering result of proxy users using Agglomerative
Clustering with Extended Jaccard similarity (k=3)
Figure 11. Clustering result of proxy users using Graph-based
Clustering with Extended Jaccard similarity (k=3)
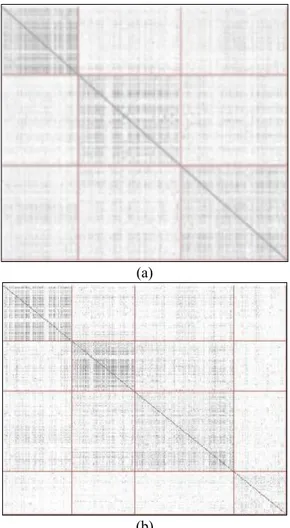
There are sparse rectangles in the regions far from the main diagonal in Figure 12 (a). On the contrary, relatively dense rectangles reside in the main diagonal. The greater contrast between the main diagonal and the rest of the matrix means “well separated clusters” have been discovered. Here, it is possible to talk about existence of three clusters.
In Figure 12 (b), The CLUSION matrix shows the result of K-means with cosine distance and k=4. Two dense clusters, one relatively less dense but bigger cluster and one small and sparse cluster can be observed along the main diagonal. The results mean that, actually there are three clusters exist
in the dataset, fourth cluster is not dense enough and it was probably occured due to the k parameter forced to create 4 clusters.
(a)
(b)
Figure 12. Clustering result of proxy users using K-Means with
(a) k=3 Pearson correlation, (b) k=4 Cosine distance
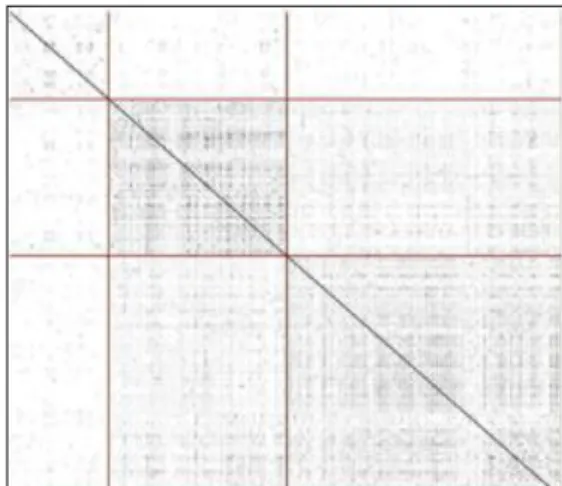
As can be seen from the dense areas along the main diago-nal in Figure 13 (a), two dense clusters and one relatively bigger less dense cluster have been discovered. The big and sparse cluster indicates that the cluster is not pure and it has outliers.
Figure 13 (b) uses cosine distance and verifies our hypoth-esis about the existence of three real clusters. Figure 13 (b) shows 3 dense clusters that have been enumerated by 1,2,3 and 1 sparse cluster positioned after 2 and before 3. The sparse cluster not enumerated. Unnumbered sparse cluster mostly consists of outliers; therefore it is not a real cluster actually, and we did not take into account it for further anal-yses.
(a)
(b)
Figure 13. Clustering result of proxy users using graph based
clustering with (a) k = 3 Pearson Correlation, (b) k = 4 Cosine distance
5. Results
We have performed a number of experiments with various clustering algorithms and similarity metrics combinations. Agglomerative clustering did not produce good quality clusters as shown in the figure 10. Cluster quality has been evaluated by observing the CLUSION graphics. Compared to agglomerative techniques, K-Means produced explicit clusters using the same similarity criteria. Best quality clus-ters were discovered by using “edge-weighted value-bal-anced graph partitioning” algorithm in combination with cosine distance metric. Figure 13 (b) gives information about the size, purity and quality of the discovered clusters. We have chosen the results of Figure 13 (b) for further anal-ysis in this section. The tables 1,2 and 3 gives some portion of the discovered clusters. Due to page constraints, we could not list all cluster members. The clusters consist of IP address of the client and associated search terms in to-kenized form. IP addresses have been obfuscated due to the privacy preserving data mining principles. The IP addresses are obfuscated and given in random order.
Table 1. Some members of Cluster 1 and associated search
terms
IP Address Significant Search Terms
10.1.30.61 facebook, systems, face 10.1.145.84 halı, sigorta, identity,birkiye 10.1.70.60 pegasus
10.1.30.209 face, keygen 10.1.70.39 pegasus, canlıdizi 10.1.30.62 facebook, face 10.1.30.95 mehmet, hava
10.1.80.38 ankara,mehmet, kimlik, birkiye 10.1.190.26 vitra, with, radio, face, kitap 10.1.80.49 bebek, canlıdizi, dizi, kuram 10.1.145.113 canlıdizi, tubitak, with, ankara
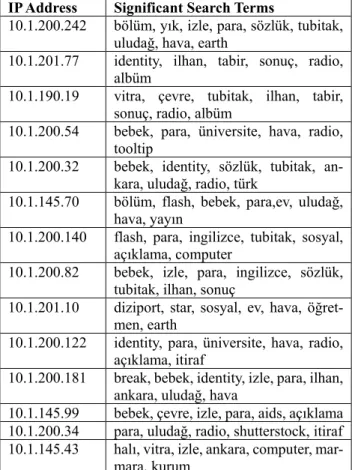
Table 2. Some members of Cluster 2 and associated search
terms
IP Address Significant Search Terms
10.1.200.242 bölüm, yık, izle, para, sözlük, tubitak, uludağ, hava, earth
10.1.201.77 identity, ilhan, tabir, sonuç, radio, albüm
10.1.190.19 vitra, çevre, tubitak, ilhan, tabir, sonuç, radio, albüm
10.1.200.54 bebek, para, üniversite, hava, radio, tooltip
10.1.200.32 bebek, identity, sözlük, tubitak, an-kara, uludağ, radio, türk
10.1.145.70 bölüm, flash, bebek, para,ev, uludağ, hava, yayın
10.1.200.140 flash, para, ingilizce, tubitak, sosyal, açıklama, computer
10.1.200.82 bebek, izle, para, ingilizce, sözlük, tubitak, ilhan, sonuç
10.1.201.10 diziport, star, sosyal, ev, hava, öğret-men, earth
10.1.200.122 identity, para, üniversite, hava, radio, açıklama, itiraf
10.1.200.181 break, bebek, identity, izle, para, ilhan, ankara, uludağ, hava
10.1.145.99 bebek, çevre, izle, para, aids, açıklama 10.1.200.34 para, uludağ, radio, shutterstock, itiraf 10.1.145.43 halı, vitra, izle, ankara, computer,
mar-mara, kurum
Table 3. Some members of Cluster 3 and associated search
terms
IP Address Significant Search Terms
10.1.200.116 halı, flash, bebek, bilkent, program, between
10.1.40.56 halı, bebek, çevre, sorun, ankara, aids, indir
10.1.40.16 flash, maltepe, bebek, vitra, çevre,
tubitak, ankara, aids
10.1.200.136 bebek, star, sigorta, ankara, milli, indir 10.1.30.87 bebek, çocuk, anadolu, piyango,
seramik 10.1.70.53 flash, canlıdizi 10.1.145.93 gazete, halı, vitra, aids
10.1.190.80 vitra, çevre, sorun, nezih, sys-tems,yeditepe, piyango
10.1.190.32 flash, bebek, çocuk, şiddet, translate 10.1.30.39 flash, bebek, çevre, ankara, şirket 10.1.30.104 gazete, halı, bebek, vitra, ankara,
sosyal, piyango
10.1.145.167 bebek, star, sonuç, aids, indir, between 10.1.145.42 bebek, çevre, tubitak, merkezi,
yed-itepe, between
A great deal of the search keywords discovered within each clusters are common words and these words occur in both three clusters. Frequently used words do not help us dis-cover the unique features of the clusters. To solve the prob-lem, we have filtered them out. Google search engine helped us for determining common words. We used the number of occurrence of a keyword in the internet by que-rying it on the google search engine. Keywords returned more than 100,000,000 websites indexed by Google were marked as common words and removed from all of the clusters. We have developed a small script in ruby language which searches all terms in the Google and gets the number of occurrences and stores them in a file. The resulting words and the clusters are shown in Table 4. The IP ad-dresses are not given in this table since we do not need in-dividual users’ search patterns. Instead, we need to discover general characteristics of clusters.
Table 4. Terms used to define the clusters
Cluster 1 Cluster 2 Cluster 3
akyıldız iktisadi kamilkoç
inönü erçetin bilkent
açıköğretim melek kuram
kuram dönem şiddet
pansiyon farid alyans
ayar yık iett
redd sözlük nezih
hava anket lisans
aşık fragman tiyatro
anadolu güney dönem
medya beşiktaş parça
söz çanakkale kitap zeka kolej şirket kraloyun başkan
ankara abstracts youtube oku
Two of the terms, “anadolu” (anatolia) and “açiköğretim” (distance education) that attracts attention when Cluster 1 is investigated. Use of these keywords reminds that Cluster 1 users either do not have a university degree yet or enrolled in a distance education program in addition to their existing college degrees. “Redd” (a Turkish rock band) and “aşık” (lover) indicate Cluster 1 users are mostly below middle ages.
Terms “kitap” (book), “erçetin” (a Turkish vocalist), “frag-man” (trailer) terms indicate interest in cultural activities, and terms {“iktisadi” (economic), “sözlük” (dictionary), “dönem” (semester), “anket” (survey)} indicate that Clus-ter 2 users inClus-terested in cultural events, fine arts and eco-nomic events. They are also interested in educational ter-minology. Based on these pieces of evidences, most of this group consists of educational staff.
Terms {“bilkent” (a district in Ankara), “ankara” (Capital city of Turkey), “kamilkoç” (a well-known travel agency)} in Cluster 3 show that those users have relatives live in An-kara are included in this cluster. Indeed “kamilkoç” and “iett” (public transportation company of Istanbul) indicate that, Cluster 3 users prefer public transportation services; as a result, these users could have low income. Terms {“nezih” (bookstore), “lisans” (graduate degree), “ab-stracts”, “dönem” (semester), “kuram” (theory)} gives the evidence of that people in this group may consist of stu-dents. Although Cluster 2 and Cluster 3 generally show similar characteristics, they differ in the way of entertain-ment and life style. {“kraloyun” (a Turkish online game site), “youtube”} keywords frequently searched by the Cluster 3 users. However, Cluster 2 users rarely use Internet for gaming and watching videos.
6. Conclusion
We have proposed a search engine keywords mining frame-work in this study. We have developed a software and call it as UQCS (User Queries Clustering System). UQCS co-operates with the Strehl’s MATLAB based relationship based clustering toolkit and performs segmentation of
in-ternet users based on the keywords they input to search en-gines.
The log files analyzed in this work are static text files, not a data stream. In production environments, log files are data streams and they grow rapidly. Our framework does not work on streaming data. An efficient way would be exam-ining the log file in an incremental fashion. Researchers in-tended to work in this area are advised to work on stream processing and incremental examination of the log files. In future studies, we will work on developing an integrated framework that will automatically transfer data between UQCS and Strehl’s MATLAB toolkit. Also, we will work for alternative similarity metrics and clustering algorithms for performance improvements.
References
1. Pal, S. K., Talwar, V., Mitra, P. Web mining in soft computing frame-work: relevance, state of the art and future directions. IEEE Transac-tions on Neural Networks, 2002, 13(5), 1163-1177.
2. Etzioni, O. The World-Wide Web: quagmire or gold mine?, Commu-nications of the ACM, 1996, 39(11), 65-68.
3. Kosala, R., Blockeel, H., Web mining research: A survey. ACM Sigkdd Explorations Newsletter, 2000, 2(1), 1-15.
4. Zhang, Q., Segall, R. S.,Web mining: a survey of current research, techniques, and software. International Journal of Information Tech-nology & Decision Making, 2008, 7(04), 683-720.
5. Zhang, C. L., Liu, Z. F., Yin, J. R., The Application Research on Web Log Mining in E-Marketing. In e-Business and Information System Security (EBISS), Harbin, China, 2010, pp. 1-4.
6. Strehl, A. Relationship-based clustering and cluster ensembles for high-dimensional data mining, Doctoral dissertation, University of Texas, 2002.
7. Strehl, A., Ghosh, J., Relationship-based clustering and visualization for high-dimensional data mining. INFORMS Journal on Compu-ting, 2003, 15(2), 208-230.
8. Karypis, G., Kumar, V., A fast and high quality multilevel scheme for partitioning irregular graphs. SIAM Journal on scientific Compu-ting, 1998, 20(1), 359-392.
9. Zemberek 2 open source NLP library for Turkic languages, http://code.google.com/p/zemberek/, 2016, (accessed: 08.10.2016).
10. Cluster Analysis and Cluster Ensemble Software, http://strehl.com/soft.html,2016, (accessed: 10.10. 2016)
![Figure 1. Web Mining Categorization [5].](https://thumb-eu.123doks.com/thumbv2/9libnet/4016352.55378/2.918.92.431.624.883/figure-web-mining-categorization.webp)
![Figure 3. Reducing a graph [8].](https://thumb-eu.123doks.com/thumbv2/9libnet/4016352.55378/3.918.490.818.275.453/figure-reducing-a-graph.webp)