1 Biochemistry Department, Central Laboratory, Memorial Şişli Hospital, Istanbul, Turkey 2 Hematology Department, Medipol University, Istanbul, Turkey
3 Cardiovascular Surgery Department, Şişli Hospital, Istanbul, Turkey
Correspondence: Nilgün Tekkeşin, Biochemistry Department, Central Laboratory, Memorial Şişli Hospital, Istanbul/Turkey Email: [email protected]
Received: 14.09.2014, Accepted: 09.10.2014 ABSTRACT
Objectives: Accurate, reliable laboratory reference rang-es are rang-essential for effective clinical evaluation and moni-toring. We present robust reference ranges established for hematology parameters using the Sysmex XT2000i analyzer.
Methods: Blood samples were taken from 17409 healthy adults (19 to 49 years, 51.4% men and 48.6% women) and routine hematology analysis performed. Patients were assessed as healthy on the basis of a medical his-tory and routine medical examinations. Serum hematinic assays (vitamin B12, folate, iron and ferritin) were also analyzed in order to exclude the potential anemia exis-tence.
Results: There was a statistically significant difference (p<0.001) between men and women, with the former showing higher CBC values, except WBC, neutrophil and platelet counts compared to females. Several differences were observed when compared to previously established values from Turkey, most notably in leucocytes and plate-lets. Our findings for CBC parameters, except leucocyte count and MCV are in general agreement with previously published data from more limited trials undertaken in oth-er countries.
Conclusions: In spite of the uncontrolled factors influ-encing hematological values, this study permitted to es-tablish the new hematological reference values in Turkey, especially living near sea level. In the absence of previ-ously detailed investigated hematological reference val-ues in Turkey, we offered to use these results for clinical management of Turkish patients and interpretations of laboratory data for research purpose. J Clin Exp Invest 2014; 5 (4): 548-552
Key words: Complete blood count, hematology, refer-ence range
ÖZET
Amaç: Doğru, güvenilir laboratuvar referans aralıkları etkili klinik değerlendirme ve izleme için gereklidir. Biz hematoloji parametreleri için belirlenmiş mevcut referans aralıklarını Sysmex XT2000i analizörü kullanarak sunu-yoruz.
Yöntemler: kan örnekleri 17409 sağlıklı erişkinden (yaş aralığı, 19 ile 49 yıl arasında, %51,4 erkek ve %48,6 ka-dın) alındı ve rutin hematoloji analizi yapıldı. Hastalar, tıb-bi geçmişleri ve rutin muayenelerine dayanarak sağlıklı olarak değerlendirildi. Serum hematinik testleri (vitamin B12, folat, demir ve ferritin) de çalışılarak potansiyel ane-mi varlığı hariç tutuldu. Bulgular: Kadın ve erkek arasın-da belirgin istatistiksel farklılık (p<0,001) olup erkeklerde kadınlara göre tam kan sayımı parametreleri, beyaz küre hücreleri, nötrofil ve trombositler hariç daha yüksekti. Daha önce Türkiye’den bildirilen değerler ile karşılaştırıl-dığında başta lökositler ve trombositler olmak üzere bir-çok farklılıklar tespit edildi. Tam kan sayımı parametreleri bulgularımız, diğer sınırlı sayıda katılımcının yer aldığı ül-kelerden elde edilen yayınlanmış verilere göre kıyaslandı-ğında ise lökosit sayısı ve MCV hariç genel bir uyumluluk içindeydi.
Sonuçlar: Hematolojik değerleri etkileyen kontrol edi-lemeyen faktörlerin aksine, bu çalışmada, Türkiye’ de özellikle deniz seviyesinde yaşayanlar için yeni hemato-lojik referans değerlerinin oluşturulmasına izin vermiştir. Türkiye’de daha önce ayrıntılı incelenen hematolojik re-ferans değerleri yokluğundan dolayı, bu sonuçların Türk hastaların klinik açıdan yönetimleri ve araştırma amaçlı laboratuvar verilerinin yorumlanması adına kullanılmasını öneriyoruz.
Anahtar kelimeler: Tam kan sayımı, hematoloji, referans aralığı
ORIGINAL ARTICLE / ÖZGÜN ARAŞTIRMA
The largest reference range study for hematological parameters from Turkey: A case
control study
Türkiye’ den hematolojik parametrelerin en büyük referans aralığı çalışması: Bir vaka-kontrol
araştırması
INTRODUCTION
The hematological reference values were deter-mined many years ago for the Caucasian popula-tions [1-3]. Because of the absence of a reference range for hemoglobin concentration and other blood cell values, reference values obtained from a pre-dominant population living in North America and Europe [4]. However, there are some discrepancies between studies which may be due to different fac-tors such as age, sex, geographic origin, altitude, and ethnic origin [5].
Istanbul is a Western Turkish city, with an al-titude below 1000 meters. The importance of this study was increased as the trial consisted of a wide range of citizens who came from all other regions of the country to live in this city. The study therefore included subjects, with different geographic origins some of whom may carry genetic hemoglobinopa-thies. Several studies have established reference values for total blood count for Turkish cities [6-8]. However, there has been no study so far that has assessed hematology reference intervals in a con-trolled, systematic manner among asymptomatic adults who would otherwise be eligible as healthy subjects in clinical trials in this region.
Based on these reasons, in order to achieve a better interpretation of hematological results, we es-tablished hematological reference values by study-ing healthy adults gathered from hospital check-up center in Istanbul. The reported values may also serve as a source of reference and comparison for laboratories working in similar environments.
METHODS
Our study protocol complied with the recommenda-tions of the National Committee for Clinical Labora-tory Standards (NCCLS) [9-11] and the International Federation of Clinical Chemistry and Laboratory Medicine (IFCC) [12]. The institutional committee for medical ethics approved the study protocol, and all patients gave informed consent. Patients were assessed as healthy on the basis of a medical his-tory and routine medical examinations. Serum he-matinic assays (vitamin B12, folate, iron and ferritin) were also analyzed.
Between January 2010 and December 2012, check-up patients (n=17409) of both sexes (51.4% men and 48.6% women) and between 19 and 49 years of age were selected at the check-up service centre.
All samples were collected between 9.00 a.m. and 11.30 a.m. after a 15 minutes recumbent rest and analysed within 2 hours. Moreover, a peripheral blood film was done in order to detect abnormalities of red blood cell. All samples were tested for human deficiency virus (HIV), hepatitis B virus (HBV), and hepatitis c virus (HCV) viral infections and syphilis. The criteria for inclusion in our study were the fol-lowing: negativity of all serological tests for viral in-fections, and absence of hypochromia on peripheral blood smear. None of them had a history of blood donation.
A Sysmex XT-2000i (Sysmex Corp., Kobe, Ja-pan) automated hematology analyzer was used and calibrated and maintained according to the manu-facturer’s instructions. Intra and interassay coeffi-cient of variation (CV) ranged from totally 0.3% to 1.5% and 0.6% to 1.4% for all parameters, respec-tively.
Statistical analysis
Reference intervals for different subclasses (males and females) were separated according to NC-CLS guidelines [9]. Complete blood count (CBC) parameters were examined for normal distribution from histograms, Q–Q normality and Box plots, t-values (Skewness/SE Skewness), kurtosis and sig-nificance levels calculated from the Kolmogorov– Smirnov and Shapiro–Wilk tests of normality. The differences were statistically significant when p < 0.05. Reference ranges for near normally distribut-ed parameters were calculatdistribut-ed using mean ± 2SDs (standard deviation). As nonparametric statistical methods are less accurate than their parametric counterparts, non-normally distributed parameters data were transformed logarithmically using the log natural transformation and the antilog of the 2.5th and 97.5th percentiles. All statistical analyses were carried out using GraphPad Prism ver. 3.0 (San Diago, USA).
RESULTS
A total of 20369 potential healthy adults were screened, of whom 17409 (85,4%) were included in the final analysis with a mean age of 39 years for men and 34 years for women (range 19–49). The means, SD values, and 95th percentile refer-ence values according to gender for red blood cell (RBC) parameters were shown in Table 1, white blood cell (WBC) parameters were given in Table 2, and platelet counts in Table 3. There was a statisti-cally significant difference (p<0.0001) between men
and women, with the former showing higher CBC
values, except WBC, neutrophil and platelet counts compared to females. Our results as well as those of other Turkish cities were displayed in Table 4. Table 1. Mean plus/minus standard deviation and 95th percentile reference values by gender for red blood cell
param-eters Red Cell Parameters (x10RBC6/µL) (g/dL)Hb Hct(%) MCV(fL) MCH(pg) MCHC(g/dL) M a l e (n=8960)* Mean±SD(%95) (4.50-6.00)5.25±0.37 (13.42-17.11)15.27±0,92 (33.97-44.54)44.92±2.49 (80.56-94.73)86.65±4.54 (27.70-32.51)29.11±1.70 (32.00-35.97)33.99±0.99 F e m a l e (n=8449)* Mean±SD(%95) (3.78-5.25)4.52±0.36 (11.03-14.72)12.88±0.92 (32.67-44.04)39.01±2.51 (79.83-93.29)85.56±5.36 (26.39-32.76)28.58±2.09 (30.94-35.07)33.01±1.03 *p values <0,001; statistically significant difference between males and females RBC: red blood cell, Hb: hemoglobin, Hct: hematocrit, MCV: mean cell volume
MCH: mean corpuscular hemoglobin, MCHC: mean corpuscular hemoglobin concentration
Table 2. Mean plus/minus standard deviation and 95th percentile reference values by gender for WBC parameters WBC
Parameters WBC(x103/µL) (x10WBC3/µL) Neutrophils(%) Lymphocytes(%) Monocytes(%) Eosinophils(%) Basophils(%)
Male
(n=8960)* Mean±SD(%95) (3.71-9.85)6.78±1.53 (39.58-70.05)54.82±7.61 (19.88-47.70)33.79±6.95 (4.39-1.65)8.02±1.81 2.89±1.89(0.0-6.60) 0.45±0.26(0-0.99) Female
(n=8449)* Mean±SD(%95) (3.61-10.45)6.88±1.78 (40.81-76.47)58.64±8.91 (15.32-47.07)31.20±7.93 (3.88-11.0)7.45±1.78 2.25±1.76(0-5.79) 0.43±0.26(0-0.96) *p values <0,001; statistically significant difference between males and females WBC: White blood cell
Platelets (x103/µL)
Male (n=8960)* Mean±SD(%95) (144.60 – 332.40)238.50±46.95 Female (=8449)* Mean±SD(%95) (145.24 – 366.56)255.90±55.33 *p values <0,001;statistically significant difference be-tween males and females
Table 3. Mean±SD and 95th percentile reference values by gender for platelets
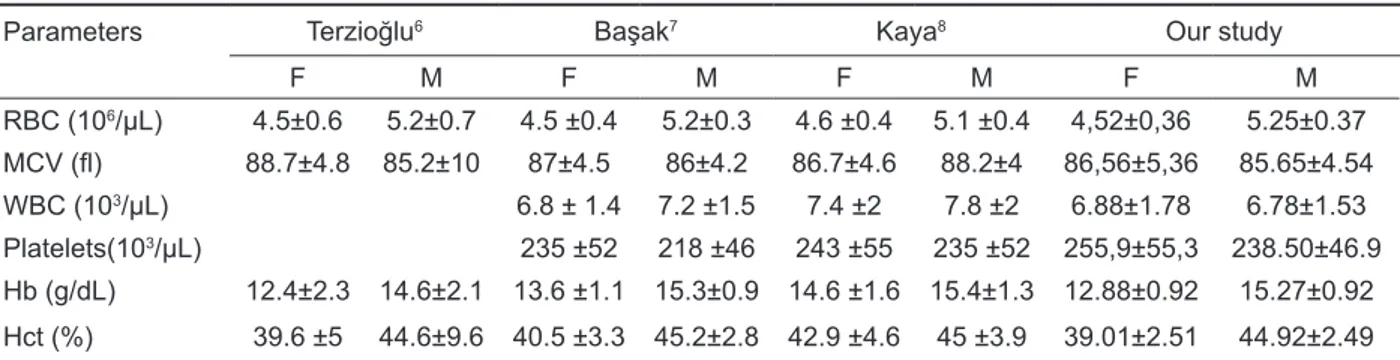
Table 4. Mean±SD values by gender for some hematological parameters comparing other studies with our study in Turkey
Parameters Terzioğlu6 Başak7 Kaya8 Our study
F M F M F M F M RBC (106/µL) 4.5±0.6 5.2±0.7 4.5 ±0.4 5.2±0.3 4.6 ±0.4 5.1 ±0.4 4,52±0,36 5.25±0.37 MCV (fl) 88.7±4.8 85.2±10 87±4.5 86±4.2 86.7±4.6 88.2±4 86,56±5,36 85.65±4.54 WBC (103/µL) 6.8 ± 1.4 7.2 ±1.5 7.4 ±2 7.8 ±2 6.88±1.78 6.78±1.53 Platelets(103/µL) 235 ±52 218 ±46 243 ±55 235 ±52 255,9±55,3 238.50±46.9 Hb (g/dL) 12.4±2.3 14.6±2.1 13.6 ±1.1 15.3±0.9 14.6 ±1.6 15.4±1.3 12.88±0.92 15.27±0.92 Hct (%) 39.6 ±5 44.6±9.6 40.5 ±3.3 45.2±2.8 42.9 ±4.6 45 ±3.9 39.01±2.51 44.92±2.49 RBC: red blood cell, MCV: mean cell volume, WBC: White blood cell, Hb: hemoglobin, Hct: hematocrit, F: female, M: male
DISCUSSION
Clinical laboratory reference ranges are an impor-tant tool for identifying abnormal laboratory results and for ultimately guiding patient management de-cisions. Therefore, inappropriate reference values may increase the risk of either unnecessary addi-tional investigations or failure to detect underlying disease.
In settings where reference values cannot be determined for the local population, the alternative is to use data that were collected elsewhere, usu-ally in a developed country [13]. However, there is a general lack of published data regarding labora-tory parameters for populations living in Turkey, with only a few articles that defines the reference ranges for the total blood count parameters for this country [6-8]. Data for the this study were collected in Is-tanbul, Turkey, which is on the West and differs in many respects (climate, altitude, main sources of in-come, etc.) from the Turkish highlands. In addition, the data were sampled from a diverse population. This study provides the first hematological refer-ence ranges for Istanbul, Turkey, and to date is the largest cohort from which reference range data has been collected in Turkey.
Relevant reference ranges are required for clinical practice and research in Turkey because of the high incidence of beta-thalassemia carriers [14]. In our study, we tried to eliminate most of these ab-normalities by performing standard measurements and detecting hypochromia on the peripheral blood smear. Although, this might led to the outcome of higher reference intervals for RBC and WBC ac-cording to earlier studies [15], the main limitation was the lack of hemoglobin electrophoresis to rule out beta-thalassemia carriers.
Our results are not consistent with those of the previous studies performed in several Turkish cities, excluding Istanbul [6-8]. An attempt must be made to explain why the new reference limits are gener-ally lower than the limits described in the literature in Turkey. We believe there is no reason to question the validity of these results from the analytical point of view. It seems likely that the reference population differs from other local populations of the same eth-nic mix and geographic/environmental influences. Compared to other regions, such as Erzurum, a high altitude (1869 m) site in Turkey, our reference ranges were lower, with the exception of platelet values which were much lower in the Erzurum pop-ulation [8]. This is particularly coupled with the tim-ing of venous sampltim-ing in the early morntim-ing when
diurnal rhythms indicate that leukocytes are at their lowest levels.
The reference interval for hemoglobin concen-tration is higher than the usually accepted values [16,17], but are similar to the reference intervals presented in a new study [18]. The strict control of pre-analytical factors might explain our higher red cell reference intervals compared with some of those studies. The likeliest explanation might be the stringency of the inclusion criteria that avoided the conditions known to influence counts [19]. The find-ing of higher values for hemoglobin, hematocrit and erythrocytes in males compared to females may be partly due to the influence of androgen on erythro-poiesis. Our reference intervals for the mean cel-lular volume (MCV) are different than both recent and older reports [13,16]. MCV reference ranges for men and women were nearly below the defined cut-off values for anemia. It can be hypothesized that the low minimal range MCV, which contrasts with the normal RBC, may be linked to the presence of undefined anemia [20]. This study illustrated the dif-ficulty in obtaining reference values from healthy individuals for reference values for RBC series, de-spite detailed medical examination.
While mostly used leukocyte count values in laboratories were chosen based on earlier studies but appeared lower compared to these [16,17]. Ref-erence values established in this study are similar to those of recent studies [21] with a reduction in the lower limit of both the total leukocyte count and neu-trophils. Analyzers which were used to establish ref-erence intervals in previous studies are now being replaced by instruments employing novel technolo-gies. This might be another reason to recalculate new reference ranges, today.
In correlation with other studies [22,23], women showed higher platelet counts than men. The calcu-lated platelet reference intervals in our study were in agreement with both earlier and recently published reports [16,17]. Therefore, biological variation, pre- and intra-analytical factors and geographical factors that may affect the platelet count could be not ig-nored.
Variations in hematology parameters observed in different populations emphasize the need to es-tablish locally derived reference values [24]. Our findings for CBC parameters, except leukocyte count and MCV are in general agreement with pre-viously published data involving more limited trials undertaken in other countries [25]. Despite the stat-ed limitation of the study and uncontrollstat-ed factors
influencing hematological values, we assert that the ranges generated in this study would be suitable for use in a more generalized setting. It is possible that these ranges could be extrapolated to other regions of Turkey, with similar altitudes and environments.
Based on the results from the XT-2000i, in the future we need to clarify all WBC results which are lower than 3,6×10³/uL. Additionally, further evalu-ations of the hemoglobin values for both genders are recommended. Also, the upper limit of the refer-ence range for platelet counts should be reconsid-ered and recalculated, if necessary. As a result, cost can be reduced with the new reference limits, since some follow-up medical examinations may now be avoided.
REFERENCES
1. Bain BJ. Normal range in blood cells. A Practical Guide, Blackwell Scientific Publications, 3rd edn. Oxford, UK,
2002:857-894.
2. Lewis SM, Bain BJ, and Bates I. Reference ranges and normal values. Practical Haematology, 3rd edn
Churchill Levingstone, New York, NY, USA, 2006:11-24.
3. Giorno R, Clifford JH, Beverly S, Rossing RG. Hema-tology reference values. Analysis by different statisti-cal technics and variations with age and sex. Am J Clin Pathol 1980;74:765–770.
4. Saxena S, Wong ET. Heterogeneity of common hema-tologic parameters among racial, ethnic, and gender subgroups. Arch Pathol Lab Med 1990;114:715-719. 5. Bain B, Seed M, Godsland I. Normal values for
periph-eral blood white cell counts in women of four different ethnic origins. J Clin Pathol 1984;37:188–193. 6. Terzioglu M, Savcı D, Ozek A, et al. Türklerde normal
hematolojik değerler. Ist Univ Tıp Fak J 1953;16:193-207.
7. Basak M, Gul S, Kucukardali Y, et al. Türkiye’de he-mogram değerleri ile ilgili randomize referans değer çalışması. Turkey. Turk J Haematol Oncol 1998;8:69-72.
8. Kaya H, Kiki I, Akarsu E, et al. Hematological values of healthy adult population living at moderate alti-tude (1869 m, Erzurum, Turkey). Turk J Haematol 2000;17:123-128.
9. National Committee for Clinical Laboratory Standards. How to Define and Determine Reference Intervals in the Clinical Laboratory; approved guideline – 2nd edn. bC28-A2, 2000;20:13.
10. National Committee for Clinical Laboratory Stan-dards. Procedures for collection of diagnostic blood
specimens by venopuncture; approved guideline H3-A3. Wayne, PA, NCCLS, 1991.
11. National Committee for Clinical Laboratory Standards. Procedures for the handling and processing of blood specimens; approved guideline H18-A. Wayne, PA: NCCLS, 1990.
12. Solberg H. Approved recommendation on the theory of reference values. Part 5. Statistical treatment of col-lected reference values. Determination of reference limits. J Clin Chem Clin Biochem 1987;25:645–656. 13. Gilmour JW, Stevens WS, Gray C, Souza M.
Labo-ratory expansion to large-scale international HIV preventive vaccine trials. Current Opinion in HIV and AIDS 2008;2:201–206.
14. Kocak R, Alparslan ZN, Agridag G, Baslamisli F, Ak-sungur PD, Koltas S. The frequency of anaemia, iron deficiency, hemoglobin S and beta thalassemia in the south of Turkey. Eur J Epid 1995;11:181-184.
15. Pfaeffli J. Reference limits for the automated haema-tology analyser Sysmex XE-2100. Sysmex Journal International 2002;1:20-28.
16. Perkins S. Normal blood and bone marrow values in humans. In: Lee G, Foerster J, Lukens J, et al. editors. Wintrobe’s clinical hematology, 10th edn. Baltimore: Williams & Wilkins, 1998:2738.
17. Kratz A, Lewandrowski K. MGH Case records: nor-mal reference laboratory values. N Engl J Med 1998;339:1063–1072.
18. Wakeman L, Al-Ismail S, et al. Robust, routine hae-matology reference ranges for healthy Adults. Int Jnl Lab Hem 2007:1-5.
19. Kaya Z. Interpretation of automated blood cell counts. Dicle Med J 2013;40:521-528.
20. Kueviakoe IM, Segbena A, Jouault H, Vovor A, Imbert M. Hematological reference values for healthy adults in Togo. ISRN Hematology 2011:1-5.
21. Nordin G, Martensson A, Swolin B, et al. A multicen-tre study of reference intervals for haemoglobin, basic blood cell counts and erythrocyte indices in the adult population of the Nordic countries. Scand J Clin Lab Invest 2004;64:385–398.
22. Bain BJ, England JM. Normal haematological val-ues: sex difference in the neutrophil count. BMJ7 1975;11:473-475.
23. Bain BJ. Platelet count and platelet size in men and women. Scand J Haematol 1985;35:77-79.
24. Milman N, Byg K, Mulvad G, Pederson HS, Bjer-regaard P. Haemoglobin concentrations appear lower in indigenous Greenlanders than in Danes: assess-ment of haemoglobin in 234 Greenlanders and 2804 Danes. Eur J Haemat 2001;67:23-29.
25. Houwen B. The blood cell count. In: Advanced meth-ods in haematology. (eds. R.M. Rowan, O.W. van As-sendelft & F.E. Preston), Arnold, London, 2002:37.