Procedia - Social and Behavioral Sciences 229 ( 2016 ) 427 – 443
ScienceDirect
1877-0428 © 2016 The Authors. Published by Elsevier Ltd. This is an open access article under the CC BY-NC-ND license (http://creativecommons.org/licenses/by-nc-nd/4.0/).
Peer-review under responsibility of the International Conference on Leadership, Technology, Innovation and Business Management doi: 10.1016/j.sbspro.2016.07.153
Corresponding author.
Email address: [email protected]; [email protected]
5
thInternational Conference on Leadership, Technology, Innovation and Business
Management
E-Service Quality and E-Recovery Service Quality: Effects
on Value Perceptions and Loyalty Intentions
Cemal Zehir
a, Elif Narcıkara
baYıldız Technical University, Istanbul, 34220, Turkey b Istanbul Medipol University, Istanbul, 34220, Turkey
Abstract
With the raise of internet retailing, service quality of e-retailers has been recognized as an important factor in determining success levels of e-commerce ventures. New shopping habits resulted in a growing number of studies about customer satisfaction, trust, acceptance, service quality, customer perceptions and customer loyalty. Our paper examines the above-mentioned topic in Turkish e-business context. We applied our survey to 645 customers using the most popular 10 online retailers in Turkey, with the aim of understanding relationships between E-Service Quality, Perceived Value, Recovery Service Experiences and Loyalty intentions. We wanted to see the effects of recovery services during nonroutine encounters of customers with the sites as well as e- service quality’s effects on routine encounters. According to the results of our study, we can infer that there is a strong relationship between E-service Quality and Loyalty Intentions and Perceived Value act as a mediator between them.
© 2014 Published by Elsevier Ltd. Selection and/or peer-review under responsibility of 4th International Conference on Leadership, Technology and Innovation Management
Keyword; E- Service Quality; E- Recovery Service Quality; Perceived Value; Loyalty Intention.
1.Introduction
Quality is one of the most important and complex components of business strategy. It is a central element in both business strategy and academic research. Firms compete on quality, customers search for quality, and markets are transformed by quality. It is a key force leading to delighted customers, firm profitability, and the economic growth of countries. (Golder et. al., 2012) Meeting or surpassing customer expectations is the basis of quality- driven framework within organizations (Evans and Lindsay, 2011). In order to be competitive in a changing market, companies must improve their quality and innovativeness (Zehir and Sadikoğlu, 2012). Thanks to the “quality movement” that started around the early 1930’s,
© 2016 The Authors. Published by Elsevier Ltd. This is an open access article under the CC BY-NC-ND license (http://creativecommons.org/licenses/by-nc-nd/4.0/).
quality is no longer a peripheral issue “outsourced” to engineers, the “techies,” or the quality inspectors (Zehir et al., 2015) Instead, quality has become part of the mainstream of business thinking once managers at all levels have realised that they need to think of consumers’ quality needs as much as they need.
The rapid expansion of information and communication technologies in daily business activities is the most important long-term trend in the business world (Rust, 2001).In modern business world, e-commerce is an important tool for both individuals and companies. Incredible rise in the importance of Internet retailing resulted in more emphasis on service quality in the online environment and became an important factor in determining the success or failure of e-commerce ventures (Santos, 2003; Yang, 2001; Zeithaml, Parasuraman, & Malhotra, 2002).
As Deming (1986) suggests improved quality has long been recognized as a means to increase profitability and ensure long-run survival in a constantly changing business environment (Sebastianelli, et al., 2005) Early scholarly writings on Service quality suggested that service Structure quality stems from a comparison of what customers feel a company should offer with the company’s actual service performance (Parasuraman et al., 2005) Similarly Lewis and Mitchell (1990) described service as the difference between customer expectations of service and perceived service. If expectations are greater than performance, then perceived quality is less than satisfactory and hence customer dissatisfaction occurs.
As mentioned before understanding and measuring electronic service quality including its dimensions has become crucial since a growing volume of business takes place in the cyber world (Akinci, et al., 2010) Combined with the developments related to internet, emerging internet retailing has started to change shopping habits of individuals. Following these developments, academicians have started to study the concepts of electronic retail services and their quality (Zehir et al., 2015) Previously, the quality of electronic retail services has been measured by the same methods used in measuring normal service quality. However, it soon appeared that the previous methods had some disadvantages and in later researches, the scaling measures have been improved. Number of studies on electronic service quality is still at its preliminary phase from both theoretical and empirical perspectives and they can be categorized in three main categories: a) technical quality of Web sites, b) the dimensions that affect customer satisfaction, and c) Web site service quality (Akinci, et al., 2010).
In this study we also focused on online retailers namely e-service providers and their e-service quality. Business to Consumer (B2C) is one of the natures of transactions or interactions in e-service. According to Turban, et.al (2009), B2C refers to e-commerce model in which businesses sell to individual shoppers and the concept of e service regarding B2C marketing is an important component of our study. According to Rust and Lemon (2001, p. 86) the concept, e-service can be described as provision of a superior experience to consumers with respect to the interactive flow of information”. In fact, online services can be divided into two main dimensions, first a functional dimension that is what is delivered in terms of service outcome and the second technical dimension that is how is it delivered in term of service process but to fully capture all dimensions of an electronic service the functional/technical approach has to be expanded by taking into account an additional dimension comprising all aspects that take place before the actual delivery of the service (Bauer et al., 2006)
The purpose of this study is to identify the mediating effect of Perceived Value on the relationship between E-Services Quality, Loyalty Intentions and Recovery services of online retailers, considering the customers of 10 most popular Internet stores in Turkey. For this purpose, we researched the related literature, we developed a research model and hypotheses for this study, and we made numerous analyses in order to test our hypothesis. This study revealed the causes of changes in the Perceived Value and considering the effects of E-Services Quality, Recovery Service Quality and Loyalty Intention.
We also wanted to understand if recovery services, namely the kind of services online retailers serve in nonroutine circumstances, for example: in case of a problem, dissatisfaction or extra information demand, effect perceptions of customers or not and whether they contribute to customer loyalty. According to Meuter et al. (2000) the number of dissatisfied online customers experiencing service breakdowns, lost orders, or inadequate complaint handling is notable and these unsatisfying service encounters cause annual Web sales losses of several billion dollars per year (Rust and Lemon, 2001) and as a result managing electronic service quality becomes an essential challenge for e-retailers (Bauer et.al., 2006) So we expected to see the an important contribution of high quality recovery services in more satisfied and loyal customers.
All tables should be numbered with Arabic numerals. Headings should be placed above tables, left justified. Leave one line space between the heading and the table. Only horizontal lines should be used within a table, to distinguish the column headings from the body of the table, and immediately above and below the table. Tables must be embedded into the text and not supplied separately. Below is an example which authors may find useful.
2. Literature Review and Hypothesis
1.1. E Service Quality
As Deming (1986) suggests improved quality has long been recognized as a means to increase profitability and ensure long-run survival in a constantly changing business environment (Sebastianelli, et al., 2005) Early scholarly writings on Service quality suggested that service quality stems from a comparison of what customers feel a company should offer with the company’s actual service performance (Parasuraman et al., 2005) Similarly Lewis and Mitchell (1990) described service as the difference between customer expectations of service and perceived service. If expectations are greater than performance, then perceived quality is less than satisfactory and hence customer dissatisfaction occurs.
It took some time before marketers fully appreciated the potential impact of the Internet on marketing practices (Boshoff, 2007) However, the realization eventually dawned that if this new technology is to be used as a channel of distribution, consumer needs and customer satisfaction will be as important as always (Wang, Tang and Tang 2001) and a higher degree of e-Service quality has been considered to be one of the main entrepreneurial targets (Barrutia et. al, 2009) In fact, high e-SQ levels have been linked to better and more efficient (cf. Rust & Lemon, 2001) relations with customers, a greater ability to attract potential customers higher competitiveness and higher long-term profit levels for companies (Barrutia et. al, 2009). Delivering high quality service is considered an essential strategy for business success and survival (Reichheld & Schefter 2000) Insights from studies dealing with people-technology interactions imply that customer evaluation of new technologies is a distinct process (Parasuraman, et al., 2005) and Mick and Fournier (1995) suggest that (a) customer satisfaction with such products involves a highly complex, meaning-laden, long-term process; (b) the process might vary across different customer segments; and (c) satisfaction in such contexts is not always a function of preconsumption comparison standards (Parasuraman, et. Al, 2005)
Service quality in e-commerce can be defined as the consumers' overall evaluation and judgment of the excellence and e-service quality offerings in the virtual marketplace (Santos, 2003). Existing studies on e-service quality mostly focused on identifying the elements that define customers’ perception of service quality, and building models that outline the differences between customers’ expectations and the real service experience (Janda, Trocchia, & Gwinner, 2002; Zeithaml et al., 2002). The broad consensus concerning the relevance of e-SQ essentially stems from the idea that, although in the early phases of
electronic retail commerce, low prices and a mere presence within the web might be sufficient for commercial success, today, due to the intensity of competition, these factors simply constitute necessary conditions for survival, but are in themselves insufficient (Jun, Yang, & Kim, 2004; Madu & Madu, 2002).
According to Jeon (2009), based upon the review of literature and previous website service quality studies; functionality, customer experiential aspects and reputation dimensions determine website quality. There are nine attributes underlying these three major areas: information usefulness, usability, accessibility, aesthetics/design, privacy/security, personalization/customization, past experience, social influence, and advertisement.
E-Service Quality can be described as entire customer perceptions or evaluations of electronic service experience of the online marketplace (Santos, 2003). It can be observed that, in this definition; the meaning of service is comprehensive and includes both pre- and post- web site service aspects (Zeithaml etc., 2002) or with a wider approach it can be described as the consumer’s evaluation of process and outcome quality of the interaction with a service provider’s electronic channels’ (Gummerus et al., 2004).
Rowley (2006) defines electronic service (e-service) as deeds, efforts or performances whose delivery is mediated by information technology. Service quality is being increasingly recognized as an important aspect of electronic commerce. Since online comparisons of technical features of products are essentially costless, feasible, and easier than comparisons of products through traditional channels, service quality is the key determinant of successful e-commerce (Santos, 2003).
According to Francis & White (2002) dimensions of e-service quality are; web store functionality, product attribute description, ownership conditions, delivery, customer service and security whereas according to Ho & Lee (2007); information quality, security, ease of use, availability, customization, community, responsiveness, and delivery fulfillment are important indicators. Jeong & Lambert (2001) explained perceived usefulness, perceived ease of use and perceived accessibility as the basic dimensions of e-service quality in their research.
Kaynama & Black (2000) state that content and purpose, accessibility, navigation, design and presentation, responsiveness, background, and personalization and customization are the most important dimensions. According to Kim & Lee (2004) information content, structure and ease of use, reputation and security, and usefulness are important whereas O’Connor (2003) explained ease of use, transaction speed, update speed, traffic levels, integration and security in their research. Sanchez-Franco & Roldan (2005) stated that usefulness, ease of use and flow are basic dimensions whereas according to Yang et al. (2005) usefulness of content, adequacy of information, usability, accessibility, privacy/security, interaction are the dimensions that should be taken into consideration. Yoo & Donthu (2001) explained perceived quality of site-related aspects, ease of use, aesthetic design, processing speed, security in their research. Wolfinbarger & Gilly (2003) state that fulfillment/reliability, customer service, personalization, usability, experiential/atmospheric, ease of use, informativeness, selection, security/privacy are basic dimensions of service quality.
In response to the growing recognition that service quality in an electronic channel environment is different (and thus the way it ought to be measured), several researchers have attempted fill this gap (Boshoff, 2007). Examples include Loiacono, Watson and Goodhue’s [2002], WebQualTM instrument, Yoo and Donthu’s [2001] “SITEQUAL,” and Wolfinbarger and Gilly’s [2003] “eTailQ.” Undoubtfully the most effective instrument that measures E-S quality was the E-S-QUAL scale developed by Parasuraman, Zeithaml and Malholtra [2005].
Research about service quality has been popular for many years, but it is only recently that it started to take place in e-commerce environment ( Zehir et. Al, 2014). Three broad conclusions that are potentially relevant to defining, conceptualizing, and measuring perceived e-service quality emerge from the traditional SQ literature: (a) The notion that quality of service stems from a comparison of actual service
performance with what it should or would be has broad conceptual support (b) the five SERVQUAL dimensions of reliability, responsiveness, assurance, empathy, and tangibles capture the general domain of Service quality and (c) customer assessments of service quality are strongly linked to perceived value and behavioral intentions (Parasuraman, et al. 2005)
It is important to remember Garvin (1987, p. 104) ‘s well-known eight-dimensional framework for product quality: performance, features, reliability, conformance, durability, serviceability, aesthetics and perceived quality (Garvin, 1984, 1987). Similarly Zeithaml et al. (2002) and Parasuraman et al. (2005) empirically examined E-S-QUAL, a multiple item scale with core service quality aspects and four dimensions: efficiency, privacy, fulfillment and availability. Parasuraman et al. (2005) obtained following four dimensions. (1) Efficiency: The ease and speed of accessing and using the site. (2) Fulfillment: The extent to which the site’s promises about order delivery and item availability are fulfilled. (3) System availability: The correct technical functioning of the site. (4) Privacy: The degree to which the site is safe and protects customer information. Zeithaml (2002) has defined similar dimensions in the following manner. (1) Efficiency refers to the ability of the customers to get to web site, find their desired product and information associated with it and check out with minimal effort. (2) Fulfillment incorporates accuracy of service promises, having products in stock and delivering the products in the promised time. (3) Reliability is associated with the technical functioning of the site, particularly the extent to which it is available and functioning properly. (4)The privacy dimension includes assurance that shopping behavior data are not shared and that credit card information. Between two researches, we implemented the dimensions put forward by Parasuraman et al. (2005), since it is widely accepted by academia.
The need for a new scale for e service quality stemmed from the differences between face to face service and online services. For example: Voss (2000), pointed out that the Assurance and Empathy dimensions, as operationalized and measured by SERVQUAL, refer to human interaction between service provider and customer which simply may not take place during a Web-based service encounter (Boshoff, 2007). Academic researchers’ early attempts to evaluate or measure aspects related to Websites (such as SITEQUAL) were based on consumer perceptions, the researchers generally studied convenience samples in laboratory-like settings, which did not capture the realism of actual online buying. Many of those studies were also aimed more at providing feedback to Website developers and designers rather than at understanding actual buying decision-making (Boshoff, 2007).
Most of the studies on Internet retail service quality, have concentrated on developing measures for the evaluation of websites but as Wolfinbarger and Gilly (2003) argue, measuring e-service quality should go beyond the website interface (Rafiq et al., 2011) Customer’s online buying experience consists of everything from information search, product evaluation, decision making, the transaction, delivery, returns, and customer service. It is apparent that measures for evaluating just websites may not be sufficient for measuring service quality across various stages of the online retail service delivery. According to Parasuraman (2005) purpose of developing scales for e-service quality is measuring the whole customer experience regarding the e-service received rather than to generate information for website designers (Rafiq et al., 2011) According to Parasuraman (2000) any assessment of e- service quality should include all cues and encounters that occur before, during, and after the transaction, thus as mentioned before Parasuraman developed scale a 22-item scale on e-service quality with four dimensions, namely: Efficiency (ease and speed of accessing and using the site, eight items);
System Availability (correct technical functioning of the site, four items); Fulfilment (extent to which the site’s promises about order delivery and item availability are fulfilled, seven items); and Privacy (degree to which the site is safe and protects customer information, three items) (Rafiq et. Al., 2011)
Unfortunately, as Sousa and Voss (2006) believe, e-Service quality research to date exhibits a narrow focus: a single channel and front office orientation. e-Service quality scales consider the Internet channel as an isolated channel and not as one among various different channels that organisations make available
to their customers with an integrated multichannel focus (Barrutia et.al, 2009) , E Rec S Qual, developed by Parasuraman et al. (2005) tries to solve this problem by Recovery service items that measures.
1.2. Perceived Value
As Albrecht (1992) argues “the only thing that matters in the new world of quality is delivering customer value.” Value creation is seen by many commentators as the key to long-term success (Sweeney, et al.2001)
According to Monroe and Chapman (1987), consumers' preferences or choices depend on how they evaluate the quality or benefits to be received from a product rather than the cost or sacrifice inherent in the price. It has argued that buyers' perceptions of value represents a kind of trade-off between the quality or benefits they perceive in the product relative to the sacrifice they perceive by paying the price (Zehir, et al. 2015) ;
• Perceived Value = (Perceived Benefits) / (Perceived Sacrifice)
Zeithaml (1988, p 14) has suggested that perceived value can be regarded as a “consumer’s overall assessment of the utility of a product (or service) based on perceptions of what is received and what is given and classified four different consumer definitions of value: (1) value is low price, (2) value is whatever I want in a product, (3) value is the quality I get for the price I pay, and (4) value is what I get for what I give (Zeithaml, 1988)
The concept of perceived value has several models. Dodds and Krishnan presented the first model, the most known model, in 1984. There is a positive relationship between perceived quality and perceived value. Nevertheless, there is a negative relationship between perceived value and perceived sacrifice. Consequently, consumers conduct a benefit-cost analysis regarding to the product and they make the purchasing decision accordingly (Dodds and Monroe, 308, 1985).
In the light of this information, perceived value can be summarized as the value of a product that is determined by customer’s opinion about its value. It may have little or nothing to do with the product's market price, but depends on its ability to satisfy customers’ needs or requirements (Zehir, et al, 2005)
There are meaningful studies supporting the view that perceived values are related to the quality of the web site. For example a recent empirical study found that the quality of web site is positively associated with customers’ perceived value (Bauer, et al., 2006; Parasuraman etc., 2005; Wolfinbarger and Gilly, 2003). Moreover, Marimon et al. (2009) revealed that two of the dimensions, system availability and fulfilment, significantly and positively affect customer’s perceived quality and Fuentes Blasco et al. (2010) identify five dimensions of e-service quality; efficiency system availability and fulfilment, security and responsiveness; and revealed that all those dimensions positively influence customer’s perceived value.
1.3. Loyalty Intentions
While some organizations are content with focusing on simply achieving customer satisfaction, gaining and sustaining customer loyalty constitutes the ultimate aspiration of many contemporary service providers. Loyal customers buy more, are willing to spend more, are easier to reach, and act as enthusiastic advocates for our firms (Harris et al., 2004)
Recent research suggests that e-retailers enjoy customer loyalty more than bricks-and-clicks retailers do [Reichheld & Schefter 2000]. About one-half of e-retailers sales is accounted for by repeat loyal buyers [Balabanis & Reynolds 2006]. Sector analysis shows that only a very small minority of web site visitors (1.3–3.2 percent) return to make purchases (Boston Consulting Group, 2000; Shop.org, 2001) but, recent research indicates this small proportion of loyal online customers are highly profitable (Nielsen,
1997; Scheraga, 2000) and deserves attention (Harris et. al, 2004) According to Anderson & Srinivasan (2003) loyal customers may be worth up to ten times as much as its average customer and bring many benefits to a seller and be considered one of the critical indicators used to measure the success of marketing strategy.
In the marketing literature, brand loyalty is an indicator of customers’ degree of passion and commitment to the brand (Aaker, 1991). Jacoby and Chestnut approaches to the brand loyalty in five different aspects. These are; (1) biased (i.e. non-random), (2) behavioral response (i.e. purchase), (3) expressed over time, (4) by some decision-making unit, (5) with respect to one or more brands out of a set of such brands, and is a function of psychological (decision-making evaluate) processes (Jacoby and Chestnut, 1978). Engel etc. (1990) defined brand loyalty as a customer’s positive attitude and behavioral reaction towards one or several brands that are in the same product line, over a period.
According to Oliver (1997) in building customer loyalty there are four distinct, sequential phases. First, cognitive loyalty which refers to the existence of beliefs that a brand is preferable to others. Second, affective loyalty reflects a favorable attitude or liking based on satisfied usage. Third, conative loyalty constitutes the development of behavioral intentions characterized by a deeper level of commitment. Finally, action loyalty relates to the conversion of intentions to action, accompanied by a willingness to overcome impediments to such action (Harris et al., 2004)
Loyalty, has been conceived as a consumer’s intention to buy from a web site, and that consumers will not change to another website (Flavia´n et al.,2006). Customer loyalty has an important positive impact on a firm’s financial ‘‘bottom line’’ (Reichheld and Schefter, 2000) and even a small increase in the percentage of loyal customers results in significant rise in profits (Cyr et al., 2006)
Service quality has been shown to promote customer loyalty and retention (Parasuraman et al. 2005) Online shoppers are no longer willing to be engaged in extensive searches and they are willing to pay premium prices when transacting with e-retailers they experienced (Reichheld & Schefter 2000) Without doubt, several reason effect customer loyalty of online customers. First of all, web sites and intelligent search agents decrease search costs and encourages online customers to switch to an alternate e-retailer and e-retailers selling commodity products face the problem of differentiating themselves in markets where new entrants can easily compete as a result, winning customer loyalty is a priority for e-businesses survival (Swaid, 2009, Vatanasombut et al. 2004, Chen & Hitt 2002).
To sum up, the issues of loyalty mainly concerned on how loyalty is operationalized. It is very important to understand how we should measure loyalty (Zehir et al., 2015) Although there are three approaches that can be used to measure loyalty (i.e. behavioural, attitudinal, and composite approaches), most researchers resorted to attitudinal measurement in terms of intention to repurchase and intention to recommend as an indicator of loyalty (Sondon Jr. etc., 2007).
Researchers such as Chang et al. (2009) also argue that customers' perceived value positively contributes to e-loyalty by reducing individual’s need to seek alternative service providers. Moreover researchers as Rachjaibun (2007) found that e-relationship quality significantly affected loyalty. In our study we also wanted to see these relationships. Our first goal was to find out the relationship between E-Services Quality and Loyalty Intentions. Secondly, the relationship between Recovery Service Quality and Perceived Value and Thirdly, the relationship with Perceived Value and its effects on Loyalty Intentions were also studied. We studied those subjects because we found out that the mediating effect of Perceived Value on the relationship between E-Service Quality, Recovery Services and Loyalty Intention is a subject which has not been studied before in Turkish business context.
1.4. Perceived Online Support
Because of the fact that customers evaluate services on the basis of their perceptions of the total service experience, the service process is as important in shaping consumer perceptions as the outcome of the service delivery (Batson, 1995). Successful service providers manage every aspect of their ``servicescape'' to provide a uniform total experience for their customers (Bitner, 1992) and this makes online retailers consider the influence of price, promotion, place, people, processes and (sensory) physical evidence on their customers' perceptions of the service experience (Kolesar and Galbraith, 2000)
Without doubt responsiveness is one of the most important factors that should retailers take into considerance. Customers' perceptions about service provider's responsiveness will influence their assessment of service quality (Kolesar and Galbraith, 2000). To the extent that an e-retailer is prone to demonstrate both the willingness and flexibility to respond to customer’s specific needs, demands and problems, customers will recognize increased value in the service provided but demonstrating these qualities in a computer based interaction is very difficult, since the medium alienates the customer from the service provider (Kolesar and Galbraith, 2000) Online retailers use many on-line tools and service elements that respond to unique customer queries for example free contact phone numbers, live chat tools, emails (ensuring that they are replied timely). Online retailers name these services as Recovery services. There are three kind of recovery services. First; responding customers in their problems considering their transactions, for example a problem related to shipment or a defected good or a problem related to payment. Second kind of recovery service are the kind of services that encompasses the activities that online retailer compensates customers for problems. As an example: When there is a problem with their product whether the retailer get in touch with the customer, get the product back and make repayment or product change. And third kind of service is the availibility of assistance through telephone or online representatives namely call centers, free phone numbers, online chat availibilities etc.
Following the same process used in developing E S Qual, E Rec S Qual is used for measuring consumer’s perceptions regarding nonroutine encounters. E Rec S Qual is an e-recovery service quality scale containing 11 items in three dimensions: responsiveness, compensation, and contact, are employed when customer had nonroutine encounters to measure the effectiveness of handling problems and return, compensation for problems, and availability of assistance, respectively. In this scale Responsiveness is effective handling of problems and returns through the site, compensation is the degree to which the site compensates customers for problems and third dimension is contact, namely the availability of instant live assistance through telephone or online representatives.
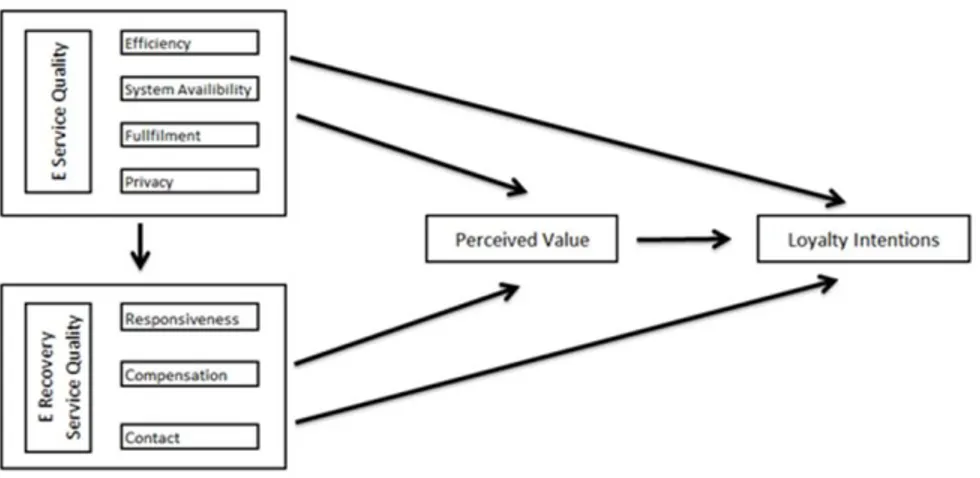
In order to investigate the relationships between E-Service Quality, E-Recovery Quality, Perceived Value and Loyalty Intentions we set up seven hypothesis as follows:
Hypotheses:
H1: There is a significant relationship between E-Service Quality and Perceived Value.
H2: There is a significant relationship between E-Recovery Service Quality and Perceived Value. H3: There is a significant relationship between E-Service Quality and Loyalty Intentions.
H4: There is a significant relationship between E-Recovery Service Quality and Loyalty Intentions. H5: There is a mediating effect of Perceived Value on the relationship between the total effect of E-Service and E- Recovery E-Service Quality versus Loyalty Intentions.
3.Methodology
1.1 Research Goal
From day to day online retailers are increasing in number and type and they are increasing their service quality in order to attract greater number of customers (Zehir, et al., 2015). Increasingly, suppliers are trying to understand what their customers want besides availability, timeliness, and reliability (Maltz and Maltz 1998). To deliver superior service quality, managers of companies with Web presences must first understand how consumers perceive and evaluate online customer service (Parasuraman et.al, 2005) In fact there is a vast range of ideas regarding the most important factors affecting online consumer’s behaviours. For example: Syed et al. (2008), the dominant factor which influences consumer perceptions of online purchasing is the website design characteristics and Shergill and Chen (2005) found that website design quality was an important issue in customer satisfaction. On the other hand Yam et al. (2011) suggested that privacy and security are important factors affecting consumers’ propensity to buy from online retailers. Moreover, Grace and Chia (2009) claimed that consumers’ attitudes and beliefs related to convenience and security concerns) have significant effects on their intention to purchase online (Ariff et al., 2013)
Because of the fact that this theme is a recently emerging study field in Turkey, studies held in this area are quiet limited and needs to be extended. In this study, the service qualities of e-commerce web sites have been measured by E-S-Qual scale. Aim of this study is to put forth if service quality of these web sites has an effect on their value perceived by their customers and loyalty intentions of their customers. Moreover, it has been investigated if perceived quality has a mediating effect between existent e-service quality and loyalty intentions of customers.
In this study, giving importance to recovery services as well as routine e- service quality, in our survey we asked questions regarding nonroutine experiences or customer’s suppositions regarding unexperienced but probable situations and their perceptions about online retailer’s recovery service quality regarding this services that is we wanted hypothetical answers regarding probable situations thus we applied all E-Rec-Squal and E-S-Qual questions to everybody contributing to our survey.
1.2. Sample and Data Collection
In this research in order to measure e-service quality we used E S Qual a multiple-item scale, developed by Parasuraman et al. (2005), consisting of four dimensions namely, efficiency, fulfillment, system availability and privacy and 22 items on these four dimensions.
Efficiency: The ease and speed of accessing and using the site. Whether the site is simple to use, structured properly, and requires a minimum of information to be input by the customer.
Fulfillment: The extent to which the site’s promises about order delivery and item availability are fulfilled.
System availability: The correct technical functioning of the site.
Privacy: The degree to which the site is safe and protects customer information. Degree to which the customer believes the site is safe from intrusion and personal information is protected.
E S Qual is defined broadly to encompass all phases of a customer’s interactions with a Web site: The extent to which a Web site facilitates efficient and effective shopping, purchasing, and delivery. Besides that, we used E Rec S Qual again designed by Parasuraman et al. (2005) consisting of 3 dimensions and11 items on these three dimensions measuring online retailer’s perceived sophistication on handling problems and getting in touch with customers on nonroutine circumstances and their excellence in replying customers’ information demands.
Responsiveness: Effective handling of problems and returns through the site. Compensation: The degree to which the site compensates customers for problems. Contact: The availability of assistance through telephone or online representatives
1.3 Research Model:
Figure 1. Research Model
Table 1. Research Model
For this study, a survey composed of 42 questions has been prepared and applied on randomly chosen individuals using e-commerce websites. Between 2013 and 2014, 750 questionnaires have been sent and 645 usable responses have been obtained by making face to face interviews. Data of the research have been analyzed by using SPSS 20.00 (Statistical Package for Social Sciences) for Windows.
Table 2. Descriptive Statistics
Variables n % Age 18-25 150 23,2 25-40 430 66,6 40-55 66 10,2 Gender Male 51 46,8 Female 58 53,2
Education level High School 166 25,8
Technical College 326 50,7
University 151 23,5
Length of time the evaluated website is used by the replier
0-6 months 123 19,2
6-12 months 120 18,6
12 months and more 403 62,4
Frequency of visits to the evaluated website 8 or less monthly 418 65,8
9 or more monthly 206 31,6
Monthly net income 801-1500 TL 179 27,8
1501-2500 TL 226 35,0
1.4 Statistical Analysis
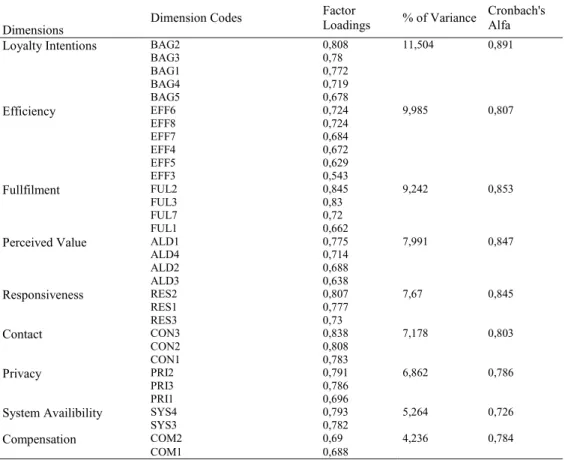
Table 3. Factor Analysis
Dimensions Dimension Codes
Factor
Loadings % of Variance
Cronbach's Alfa
Loyalty Intentions BAG2 0,808 11,504 0,891
BAG3 0,78 BAG1 0,772 BAG4 0,719 BAG5 0,678 Efficiency EFF6 0,724 9,985 0,807 EFF8 0,724 EFF7 0,684 EFF4 0,672 EFF5 0,629 EFF3 0,543 Fullfilment FUL2 0,845 9,242 0,853 FUL3 0,83 FUL7 0,72 FUL1 0,662
Perceived Value ALD1 0,775 7,991 0,847
ALD4 0,714 ALD2 0,688 ALD3 0,638 Responsiveness RES2 0,807 7,67 0,845 RES1 0,777 RES3 0,73 Contact CON3 0,838 7,178 0,803 CON2 0,808 CON1 0,783 Privacy PRI2 0,791 6,862 0,786 PRI3 0,786 PRI1 0,696
System Availibility SYS4 0,793 5,264 0,726
SYS3 0,782
Compensation COM2 0,69 4,236 0,784
COM1 0,688
Total variance was % 69,9 after factor analysis. KMO and Barlett analysis show that since KMO score is under 0,925, it is 0,914 and Barlett score is under 0,001 significance level, so it was meaningful to make factor analysis.
According to correlation analysis all factors are related to each other in 1/1000 significance level. Therefore, H1, H2, H3, H4, H5, H6, H7 are all accepted. The strongest correlation relationship resides in the relationship between Perceived Value and Loyalty Intentions (r=0,638; p = 0,000 <0,001). For the details you can see the correlation matrix.
Table 4. Correlation Matrix
Correlations
Standard Deviation
Mean Loyalty Perceived Value
Efficiency System Availibility
Fullfilment Privacy Compensation Contact Responsiveness Loyalty 0,65546 3,849 8 1 (0, 891) Perceived Value 1,36211 7,376 9 ,638 *** 1 (0,847)
Efficiency 4,001 ,412*** ,491*** 1 (0,807) System Availibilit y 0,82356 3,778 3 ,321*** ,391*** ,448*** 1 (0,726) Fullfilmen t 0,73032 3,938 7 ,470 *** ,418*** ,398*** ,332*** 1(0,853) Privacy 3,850 1 ,429 *** ,430*** ,384*** ,369*** ,414*** 1 (0,786) Compensa tion 0,86188 3,469 ,455*** ,392*** ,272*** ,187*** ,436*** ,370*** 1 (0,784) Contact 0,86234 3,602 ,312*** ,304*** ,190*** ,174*** ,262*** ,141*** ,400*** 1 (0,7178) Responsiv eness 0,77512 3,568 7 ,444 *** ,487*** ,386*** ,300*** ,372*** ,361*** ,552*** ,352*** 1 (0,845) **. Correlation is significant at the 0.01 level (2-tailed).
In this study, regression analysis is also conducted to test the hypotheses and to define the direction of relations. Regression analysis has been applied with the aim of testing whether Perceived Value has a mediating effect between the total effect of E-Service Quality and E Response Quality and Loyalty Intentions or not. The conditions of Baron and Kenny (1986) has been applied accurately in this analysis.
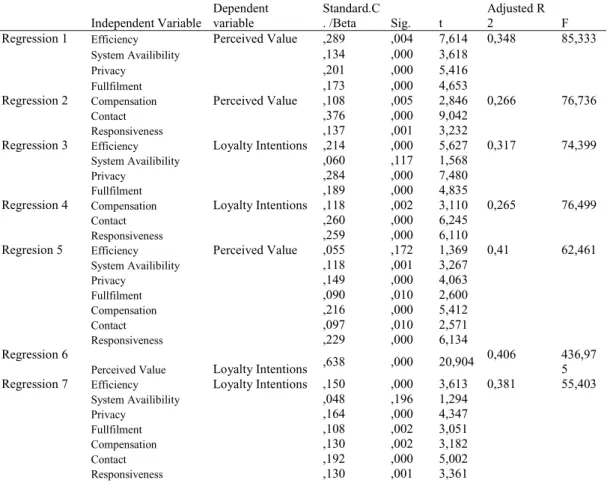
Table 5. Regression Analysis
Independent Variable Dependent variable Standard.C . /Beta Sig. t Adjusted R 2 F
Regression 1 Efficiency Perceived Value ,289 ,004 7,614 0,348 85,333
System Availibility ,134 ,000 3,618
Privacy ,201 ,000 5,416
Fullfilment ,173 ,000 4,653
Regression 2 Compensation Perceived Value ,108 ,005 2,846 0,266 76,736
Contact ,376 ,000 9,042
Responsiveness ,137 ,001 3,232
Regression 3 Efficiency Loyalty Intentions ,214 ,000 5,627 0,317 74,399
System Availibility ,060 ,117 1,568
Privacy ,284 ,000 7,480
Fullfilment ,189 ,000 4,835
Regression 4 Compensation Loyalty Intentions ,118 ,002 3,110 0,265 76,499
Contact ,260 ,000 6,245
Responsiveness ,259 ,000 6,110
Regresion 5 Efficiency Perceived Value ,055 ,172 1,369 0,41 62,461
System Availibility ,118 ,001 3,267 Privacy ,149 ,000 4,063 Fullfilment ,090 ,010 2,600 Compensation ,216 ,000 5,412 Contact ,097 ,010 2,571 Responsiveness ,229 ,000 6,134 Regression 6
Perceived Value Loyalty Intentions ,638 ,000 20,904
0,406 436,97
5 Regression 7 Efficiency Loyalty Intentions ,150 ,000 3,613 0,381 55,403
System Availibility ,048 ,196 1,294 Privacy ,164 ,000 4,347 Fullfilment ,108 ,002 3,051 Compensation ,130 ,002 3,182 Contact ,192 ,000 5,002 Responsiveness ,130 ,001 3,361
Regression 8 Efficiency Loyalty Intentions ,108 ,002 3,157 0,5 77,957 System Availibility ,001 ,965 ,044 Privacy ,147 ,000 4,201 Fullfilment ,041 ,244 1,166 Compensation ,127 ,001 3,388 Contact ,065 ,043 2,026 Responsiveness ,042 ,269 1,105 Perceived Value ,427 ,000 11,460
When the results of regression analysis examined;
H1: There is a significant relationship between E-Service Quality and Perceived Value. ( R2: 0, 348, F:85,333), Since all the relationships between subitems of E Service Quality and Perceived Value have P values smaller than 0,5 hypothesis is accepted. Efficiency is the strongest subdimension of E service quality in explaining the relationship between E service Quality and Perceived Value.
H2: There is a significant relationship between E-Recovery Service Quality and Perceived Value. R2:0,266, F: 76,735 and all the relationships between subitems of E Recovery Service Quality and Perceived Value have P values smaller than 0,5 significance level H2 is accepted and the strongest dimension explaining the relationship is Contact.
H3: There is a significant relationship between E-Service Quality and Loyalty Intentions. In this relationship R2: 0,317 and F: 74,399 and since all the relationships between subitems of E Service Quality and Loyalty Intentions have P values smaller than 0,5 hypothesis is accepted. Privacy is the strongest dimension in explaining the above mentioned relationship.
H4: There is a significant relationship between E-Recovery Service Quality and Loyalty Intentions.R2 =0,265 and F: 76,469 and all items have significant relationships with Loyalty intentions below 0,5 value thus hypothesis is accepted and Contact and Responsiveness dimensions are equally important in explaining tis relationship.
H5: H3: There is a significant relationship between Perceived Value and Loyalty Intentions. Regression 6 explains the meaningful relationship between Perceived Value and Loyalty.
Intentions. The P value of the relationship is smaller than 0,001 thus hypothesis is accepted (R2 = 0,406, F=436,975).
H6: There is a mediating effect of Perceived Value on the relationship between the total effect of E-Service and E- Recoverey E-Service Quality versus Loyalty Intentions. Regression 7 and Regression 8 make it clear that in the relationship between the total of E Service Quality items and E Recovery Service Quality items versus Loyalty Intentions when perceived value takes place in the analysis Model’s overall explanation rate increases and some items scores are decreasing. According to our scores Perceived Vale has a partial mediator effect. (R2 increased from 0,381 to 0,500).
When models are investigated we see that R2 explanation value is always between % 26 and %50. In models the power of ındependent variables are powerful at explaining the dependent variables, that is to say, their goodness of fits are powerful.
4. Conclusion and Recommendations
In order to deliver superior service quality, managers of companies with Web presences must first understand how consumers perceive and evaluate online consumer service (Parasuraman et al. 2005) In providing superior service quality to influence consumer e-satisfaction and e-loyalty, e-retailers should pay more attention to the attributes which consumers actually use in their evaluation of e-service quality (Kim & Kim , 2009) No longer are low price and web presence considered the drivers of success
(Parasuraman et al., 2005). Firms giving importance to E–S-Quality are obliged to serve without any trouble. Otherwise, they cannot fulfill their market-oriented duties (Zehir et al., 2013) In this study we have focused on the importance of electronic service quality and electronic response quality - which have become very important after companies started to adopt a more market oriented strategy- and their effects on Loyalty Intentions and Perceived Values.
By using E S Qual scale and E Rec S Qual, it is observed that the relationship of E-service Quality E Recovery Service Quality with Perceived Values and Loyalty Intentions is positive. After making correlation analysis and regression analysis it is observed that there are meaningful relationships between the four subdimensions of E-Service Quality and three dimensions of E Recovery Service Quality and Perceived Value. In this point the improvements in websites infrastructures and development of applications for after-sales support for example online live chat applications, 7-24 call center services and consumer friendly after-sale marketing strategies such as money-refund practices, quick shipment, payment at the door practices are important contributors for these results.
In creating Loyalty ensuring perceptions; Fulfillment, Effectiveness, Privacy, Compensation, Contact and responsiveness are all seen prominent initiators, thus it is observed that customers give importance to the tendency of websites in keeping their promise, emphasis on privacy and promptness in orders given from websites and they take into consideration the availibility of after sales services and ease of getting in touch with company agents.
One of the most important findings of the research is the fact that Perceived Value acts as a mediator between the total effect of E-service Quality and E Recovery Service Quality versus Loyalty Intentions. With this finding we understand that customers are building Value Perceptions about the web sites before and after buying something on their perceptions about the web site’s E Service Quality and E Recovery Service Quality of the e retailer. So we can deduct that managing perceptions is very important. Unless consumer perceptions are not managed properly, all the efforts regarding an increase in E Service Quality may not result in with the intended results.
In further studies concerning E-Service Quality and E- Recovery Service Quality, specific online shops can be compared or different websites from different countries and cultures can be compared as a cross cultural study or different customer segments can be compared and their shopping behaviour can be analyzed.
5. References
Aaker, D. A. (1991). Managing brand equity: Capitalizing on the value of a brand name. The Free Press, New York.
Baron, R. M., & Davıd, A.K.( 1986).The moderator-mediator variable distinction in social psychological research: Conceptual, strategic, and statistical considerations. Journal of Personality and Social Psychology, 51, 6,1173.
Barrutia, J.M., Charterina, J and Gilsanz, A. (2009). E-service quality: an internal, multichannel and pure service perspective, The Service Industries Journal, Vol. 29, No. 12, 1707–1721.
Bauer H.H., Falk T., Hammerschmidt M., (2006). eTransQual: A transaction process-based approach for capturing service quality in online shopping. Journal of Business Research, 59, 866–875.
Bauer, H. H., Falk, T., & Hammerschmidt, M., 2006. E-TransQual: A transaction process-based approach for capturing service quality in online shopping. Journal of Business Research, 59, 866-875.
Boshoff, C., (2007) A Psychometric Assesment of E-S-QUAL: A Scale To Measure Electronic Service Quality, Journal of Electronic Commerce Research, VOL 8, NO.1, 101- 114.
Chang, H.H., Wang, Y.H., and Yang, W.Y. (2009), “The impact of e-service quality, customer satisfaction and loyalty on e-marketing: moderating effect of perceived value”, Total Quality Management & Business Excellence, 20, 4, 423-443.
Chen, Pei-Yu and L. Hitt, (2002). “Measuring Switching Costs and Their Determinants in Internet Enabled Businesses: A Study of the Online Brokerage Industry”, Information Systems Research, Vol. 13, No. 3:255-276.
Dodds, W. B., Monroe K. B. & Grewal D. (1991) .Effects of Price, Brand and Store Information on Buyers’ Product Evaluations. Journal of Marketing Research, 25, 307-319.
Engel, J., Blackwell, R., & Miniard, P. (1990), Consumer Behavior, The Dryden Press, New Jersey. Francis, J., & White, L. (2002a). PIRQUAL: A scale for measuring customer expectations and perceptions of quality in Internet retailing. In Evans, K. & Scheer L. (Eds). Proceedings of the 2002 American marketing association winter educators’ conference: Marketing theory and applications. American Marketing Association, 13, 263-270.
Fuentes-Blasco, M., Saura, I., Berenguer-Contrı, G., & Moliner-Vela´zquez, B. (2010), Measuring the antecedents of e-loyalty and the effect of switching costs on website, The Service Industries Journal, 30,11, 1837-1852
Garvin, D. A. 1984. What does product quality really mean? Sloan Management Review (Fall): 25–43. Garvin, D. A. 1987. Competing on the eight dimensions of quality. Harvard Business Review 65: 101– 109.
Gummerus, J., Liljander, V., Pura, M., & Van Riel, A. (2004). Customer loyalty to content-based web sites: The case of an online health-care service. Journal of Services Marketing, 18(3), 175–186.
Hardeep, C., & Bala, M., (2010) “Confirmatory study on brand equity and brand loyalty: A Special look at the impact of attitudinal and behavioural loyalty”, Vision: The Journal of Business Perspective, 14, 1/2, 1-12.
Ho, C., & Lee, Y. (2007). The development of an e-travel service quality scale. Tourism Management, 28, 1434-1449.
Jacoby, J., & Chestnut, R. (1978). Brand loyalty: Measurement and management. New York: Wiley. Janda, S., Trocchia, P.J., & Gwinner, K.P. (2002). Consumer perception of Internet retail service quality. International Journal of Service Industry Management, 13(5), 412–431.
Jeon, M., (2009). “Impact of perceived website service quality on customer e-loyalty on a lodging website”. Unpublished doctoral dissertation, Iowa State University.
Jeong, M., & Lambert, C. U. (2001). Adaptation of an information quality framework to measure customers’ behavioural intentions to use lodging websites. International Journal of Hospitality Management, 20,2, 129-146.
Kaynama, S., & Black, C. (2000). A proposal to assess the service quality of online travel agencies: An exploratory study. Journal of Professional Services Marketing, 21,1, 63-89
Kim, W., & Lee, H.Y. (2004). Comparison of web service quality between online travel agencies and online travel suppliers. Journal of Travel & Tourism Marketing, 17,2/3, 105-116
Madu, C.N., & Madu, A.A. (2002). Dimensions of e-quality. International Journal of Quality & Reliability Management, 19(3), 246–258.
Marimon, F., Vidgen, R., Barnes, S., and Cristóbal, E. (2009), “Purchasing behavior in an online Supermarket: The applicability of E-S-QUAL”, International Journal of Market Research, 52, 1,111-129.
Monroe, K.B. and Chapman J. D. (1987), “Framing Effects on Buyers’ Subjective Product Evaluations”, Advances in Consumer Research, Vol: 14, Issue: 1, 193-197.
O’Connor, P., (2003). Online pricing: An analysis of hotel-company practices. Cornell Hotel and Restaurant Administration Quarterly, 44,1, 88-96
Parasuraman, A., Zeithaml, V., & Malhorta, A. (2005). E-S-QUAL: a multiple-item scale for assessing electronic service quality. Journal of Retailing, 64,1, 12-40.
Parasuraman, A., & Zeithaml, V.A. (2005). E-S-QUAL A Multiple-Item Scale for Assessing Electronic Service Quality, Journal of Service Research, 7, X,1-21
Rachjaibun, N. (2007). A study of antecedents of e-relationship quality in hotel websites. Unpublished doctoral dissertation, Oklahoma State University–Stillwater.
Rafiq, M., Lu, X., Fulford, H., (2011). Measuring Internet retail service quality using E-S-QUAL. Journal of Marketing Management iFirst, 2011, 1-15.
Reichheld, F. and P. Schefter., “E-loyalty: Your Secret Weapon on the Web”, Harvard Business Review, Vol. 78, No. 4:105–113, 2000.
Rowley, J. (2006) .An Analysis of the e-service literature: Towards a Research Agenda. Internet Research, 16,3, 339-359.
Rust RT. (2001).The rise of e-service. J Serv Res.;3(4):283–5.
Sanchez-Franco, M., & Roldan, J. (2005). Web acceptance and usage model: A comparison between goal-directed and experiential web users. Internet Research, 15,1, 21-48.
Santos, J., (2003). E-service quality: a model of virtual service quality dimensions. Management Service Quality, 13,3, 233-246.
Sebastianelli R., Tamimi N., & Rajan M., (2008). Perceived Quality of Online Shopping: Does Gender Make a Difference?, Journal of Internet Commerce, Vol. 7(4), 445- 469.
Sondoh, S. L., Omar, M. W., Wahid, N. A., Ismail, I., & Harun, A. (2007). The effect of brand image on overall satisfaction and loyalty intention in the context of color cosmetic, Asian Academy of Management Journal, 12,1, 83-107.
Swaid, S.I., (2009) Measuring The Quality of e-service: scale development and initial validation. Journal of Electronic Commerce Research, VOL 10, NO 1,13- 28.
Vatanasombut B., Stylianou, A. and Igbaria. M. (2004). How to retain online customers. Communications of the ACM, 47, 6, 65-69.
Wolfinbarger, M., &Gilly, M .(2003). E-TailQ: dimensionalizing, measuring, and predicting retail quality. Journal of Retailing, 79, 183-193.
Yang, Z. (2001). Consumer perceptions of service quality in Internet-based electronic commerce. Proceedings of the 30th EMAC Conference pp. 8–11. Bergen, Norway: The Norwegian School of Economics & Business Administration.
Yang, Z., Cai, S., Zhou, Z, & Zhou, N (2005). Development and validation of an instrument to measure user perceived service quality of information presenting web portals. Information & Management, 42, 4,575-589.
Yang, Z., Jun, M., & Peterson, R.T. (2004). Measuring customer perceived online service quality. Scale development and managerial implications. International Journal of Operations & Production Management, 24(11), 1149–1174.
Yoo, B., & Donthu, N. (2001). Developing a scale to measure the perceived quality of an Internet shopping site (SITEQUAL). Quarterly Journal of Electronic Commerce, 2, 1, 31-46.
Zehir, C and Sadikoglu, E (2012), Relationships among total quality management practices: An Empirical study in Turkish industry. International journal of Performability Engineering, 8, 6,667-678.
Zeithaml, V. A. (1988).Consumer perceptions of price.Quality and value: A means-end model and synthesis of evidence. Journal of Marketing, 52, 2-22.
Zeithaml, V. A., (2002). Service excellent in electronic channels. Managing Service Quality, 12, 3,135-138.
Zeithaml, V. A., Parasuraman, A. & Malhotra, A. (2000). “E-Service quality definition dimensions and conceptual model”, Marketing Science Institute.
Zeithaml, V. A., Parasuraman, A. & Malhotra, A., (2002). Service quality delivery through web sites: A critical review of extant knowledge. Journal of Marketing Science, 30,362-375
Stank, T. P., Goldsby T. J., and Vickery, S. K. (1999) Effect of Service Supplier Performance on Satisfaction and Loyalty of Store Managers in the Fast Food Industry, Journal of Operations Management, Vol. 17, No. 4, pp. 429-448
Maltz, A. and Maltz, E. (1998). Customer Service in the Distributor Channel Empirical Findings, Journal of Business Logistics, Vol. 19, No. 2, pp. 103-130, Marketing 30(1):8–25.
Lewis, B.R. and Mitchell, V.W. (1990) Defining and measuring the quality of customer service, Marketing Intelligence & Planning, Vol. 8, No. 6, pp. 11-17.
Harris, L. C., Goode, M.M., (2004), The four levels of loyalty and the pivotal role of trust: a study of online service dynamics, Journal of Retailing 80, 139–158.
Flavia´n, C.,Guinalı´u, M.,Gurrea,R.,2006.The role played by perceived usability, satisfaction and consumer trust on website loyalty. Information and Management 43 (1), 1–14.
Cyr D., Hassanein K., Head, M., Ivanov,A., (2006), The role of social presence in establishing loyalty in e-Service environments, Interacting with Computers 19, 43–56.
Bateson, J. (1995), Managing Service Marketing: Text and Readings, 3rd ed., The Dryden Press, Orlando, FL.
Bitner, M.J. (1992), ``Service scapes: the impact of physical surroundings on customers and employees'', Journal of Marketing, Vol. 56, April, pp. 57-71.
Mark B. Kolesar, R. Wayne Galbraith, (2000),"A services-marketing perspective on e-retailing: implications for e-retailers and directions for further research", Internet Research, Vol. 10 Iss: 5 pp. 424 – 432.
Turban E. King D., Lee, J. K. and Viehland D. (2009) Electronic Commerce 2009: A Managerial Perspective. Prentice Hall.
Ariff, M. S. M., Yan, N. S., Zakuan, N., Bahari, A. Z., and Ahmad Jusoh, A., (2013), Web-based Factors Affecting Online Purchasing Behaviour. IOP Conf. Series: Materials Science and Engineering,1-10.
Syed, Zaharah, Hishamuddin and Nilufar (2008)’Young consumers online shopping: an empirical study’, Journal of Internet Business, Issue 5, pp. 81-98.
Shergill, G.S. & and Chen, Z. (2005). Web-based shopping: Consumers’ attitudes towards online shopping in New Zealand, Journal of Electronic Commerce Research, VOL. 6, No.2.
Yam B. Limbu, Marco Wolf and Dale L. Lunsford (2011), ‘Consumers’ perceptions of online ethics and its effects on satisfaction and loyalty’, Journal of Research in Interactive Marketing, Vol. 5 No. 1, 2011, pp. 71-89.
Grace and Chia (2009), ‘Factors influencing satisfaction and loyalty in online shopping: and integrated model’, Online Information Review, Vil. 33 Iss: 3 pp. 458-475.
Anderson, R. E. & Srinivasan, S. S. (2003). E-satisfaction and E-loyalty: A Contingent Framework, psychology & Marketing, 20(2), 123–138.
Evans, J. R., and W. M. Lindsay, (2011), Managing for quality and performance excellence, eighth edition. Southwestern: Cengage Learning.
Golder, P., N., Mitra, D., & Moorman, C.,What Is Quality? An Integrative Framework of Processes and States, Journal of Marketing, Volume 76 (July 2012), 1–23
Akinci, S., Inan E. A, Aksoy, Ş., (2008), Re-assessment of E-S-Qual and E-RecS-Qual in a pure service setting, Journal of Business Research, 63, 232–240
Albrecht, Karl (1992). “The Only Thing That Matters,” Executive Excellence, 9(November), 7. Sweeney, Sweeneya, J. C., Soutarb Gn, N., (2001), Consumer perceived value: The development of a multiple item scale, Journal of Retailing 77, 203–220.