Future Academy ISSN: 2357-1330
This is an Open Access article distributed under the terms of the Creative Commons Attribution-Noncommercial 4.0 Unported License, permitting all non-commercial use, distribution, and reproduction in any medium, provided the original work is
http://dx.doi.org/10.15405/epsbs.2017.12.02.6
ISMC 2017
13
thInternational Strategic Management Conference
EVALUATION OF BRAND EQUITY USING BALANCED
SCORECARD: EVIDENCE FROM PRIVATIZED TURKISH
FIRMS
Hasan Dinçer
(a)*, Tuba Bozaykut Bük
(b)
* Corresponding author
(a) Istanbul Medipol University, Istanbul, Turkey, [email protected] (b) Istanbul Medipol University, Istanbul, Turkey, [email protected]
Abstract
Recent studies generally approach brand equity from a consumer oriented paradigm. Based on previous researches, the aim of this paper is to evaluate brand equity by a multidimensional perspective based on balanced scorecard approach. Besides consumer based aspect; financial, organizational, competition dimensions of brand equity are evaluated within a sample of privatized firms listed in Borsa Istanbul. For measuring brand equity, the study offers an original methodology of a hybrid multi-criteria decision making model designed for fuzzy environment. Thereby, the brand equity performances of the selected privatized firms are analyzed by using Fuzzy DEMATEL and Fuzzy VIKOR methods. The results of the analyses present that consumer based dimension is the most influential determinant of brand equity performance. Likewise, financial based dimension is found out to have effects on other brand equity dimensions. Finally, the study findings prove that firms privatized with a high-public-offering-share have the best brand equity performance compared to others.
© 2017 Published by Future Academy www.FutureAcademy.org.uk
Keywords: Brand equity, Brand equity performance, Balance scorecard, Fuzzy method, Privatization.
1. Introduction
Developed by Kaplan and Norton (1992, 1996), the balanced scorecard (BSC) has been acknowledged as one of the most referred performance assessment systems (Marr and Schiuma, 2003; Perkins et al., 2014). For a stronger performance evaluation, Norton and Kaplan (1992) combine both
financial and non-financial measures together with a strategic orientation. The authors claim that relying only on financial dimensions would create past oriented and one-dimensional control mechanisms. Accordingly besides financial perspective, Norton and Kaplan (1996) introduce three other measures which are namely; customer, internal processes, and learning & growth. Providing a richer framework with these supporting dimensions, Norton and Kaplan’s (1996) BSC presents a future-oriented value creation system developed in line with the strategic vision of the organization. Following Norton and Kaplan (1996), empirical studies have supported that firms with a BSC system is associated with improved performance (Hoque and James, 2000; Davis and Albright, 2004; De Geuser et al, 2009).
Correspondingly depending on Norton and Kaplan’s (1996) BSC approach, this paper argues that it would be incomplete to evaluate firms’ brand equity performance only from the consumer angle. For a comprehensive analysis of strategic positioning of the brand in the competition, a holistic view comprised of various perspectives is needed (Davis 2000; Baker et al., 2005; Christodoulides and de Chernatony, 2010). Thereby for developing a more strategic approach to brand equity performance, the current study combines consumer, financial and organizational measures with a supplement dimension of competition inspired by BSC’s learning and growth perspective.
In line with the given aim, the paper continues with relevant literature on the dimensions for measuring brand equity performance. Following literature, the research methodology and the application of this methodology on Turkish Firms privatized by public offering shares is discussed. Finally, the findings together with future implications are given.
2. Literature Review and Theoretical Framework
Managing brands becomes a strategic issue because they have the potential to be the most valuable asset of an organization. Having the potential of creating a competitive superiority, brand equity is defined as “a set of assets and liabilities linked to a brand, its name and symbol that add to or subtract from the value provided by a product or service to a firm and/or that firm’s customers” (Aaker,1991:15). Similarly, Srivastava and Shocker (1991) define brand equity as “a set of associations and behaviours on the part of a brand’s consumers, channel members and parent corporation that enables a brand to earn greater volume or greater margins that it could without the brand name and, in addition, provides a strong, sustainable and differential advantage.” Besides these definitions, Keller (1993:2) adopting a marketing perspective defines brand equity as “the differential effect of brand knowledge on consumer response to the marketing of the brand”.
Companies with strong brand equities have the advantage of having customers who are willing to pay price premiums and who are loyal to the given product (Keller, 1993). Aside customer level benefits, brand equity also has the positive outcomes of increased revenue, stable cash flow and higher profits on the firm level. Another advantage of strong brand equity is to overcome the negativities of possible crises or service failures (Matilla, 2001). Therefore, both strategies developed for brand equity and brand equity performance evaluation are of critical importance to firms for achieving a superior financial performance and a competitive advantage in the market.
2.1. Multidimensional evaluation of brand equity
Brand equity literature provides three main perspectives in terms of its dimensions. The first and the widely adopted perspective is consumer-based perspective. This dimension refers to consumer related issues such as brand knowledge, perceived brand quality, brand loyalty and brand trust (Aaker, 1996, Keller, 1993; He, & Wang, 2014). The second dimension, the financial-based perspective evaluates brand equity as a financial asset (Mahajan et al, 1994). From this perspective brand equity is defined as “the incremental cash flows which accrue to branded products over unbranded products” (Simon and Sullivan, 1993:30). Accordingly, the consumer and financial perspectives constitute the main tenets of BE studies.
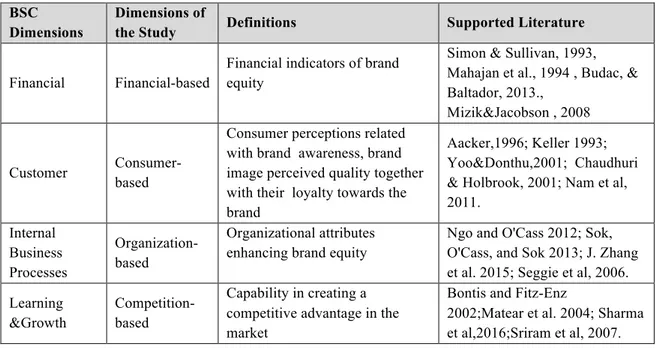
The two other dimensions of the study, organization-based and competition-based are borrowed from BSC approach. The organization-based dimension of BSC is related with the efficiency of “organizational processes such as product cycle time, productivity, cost, and time to market amongst others” (Perkins et al, 2014:156). Adopting this perspective to brand equity framework, organizations’ innovation, marketing and networking capabilities together with the use of sophisticated information technology systems come to the fore as critical dimensions. The other dimension adopted from BSC approach is competition-based and it is related with introducing new products or forming new brand extensions supported by marketing strategies and research, & development investments. All these four perspectives, their definitions and related studies are summarized at Table 1.
Table 01. Balance scorecard-based dimensions of brand equity BSC
Dimensions
Dimensions of
the Study Definitions Supported Literature Financial Financial-based
Financial indicators of brand equity
Simon & Sullivan, 1993, Mahajan et al., 1994 , Budac, & Baltador, 2013.,
Mizik&Jacobson , 2008
Customer Consumer-based
Consumer perceptions related with brand awareness, brand image perceived quality together with their loyalty towards the brand
Aacker,1996; Keller 1993; Yoo&Donthu,2001; Chaudhuri & Holbrook, 2001; Nam et al, 2011. Internal Business Processes Organization-based Organizational attributes enhancing brand equity
Ngo and O'Cass 2012; Sok, O'Cass, and Sok 2013; J. Zhang et al. 2015; Seggie et al, 2006. Learning
&Growth
Competition-based
Capability in creating a competitive advantage in the market
Bontis and Fitz-Enz
2002;Matear et al. 2004; Sharma et al,2016;Sriram et al, 2007.
3. Research Method
3.1. Sample
Firms privatized with highest public offering shares listed in Borsa Istanbul (BIST) are selected for the sample of the study. The rationale behind this sample relies on the relationship between brand equity and privatization. From the perspective of brand equity, the expected results of the privatization would be to increase brand value and achieve competitive advantage in the market. Correspondingly, the
most influential method for privatization is to offer company shares to the public. Through public offerings, it is aimed to create an increase in demand for the shares of the firm. Furthermore, capital of the companies becomes accessible even to the smallest investors by this privatization method. Similarly, an important reason for the increasing demand of individual and institutional investors to the shares is the perception that through privatization, the brand value would increase.
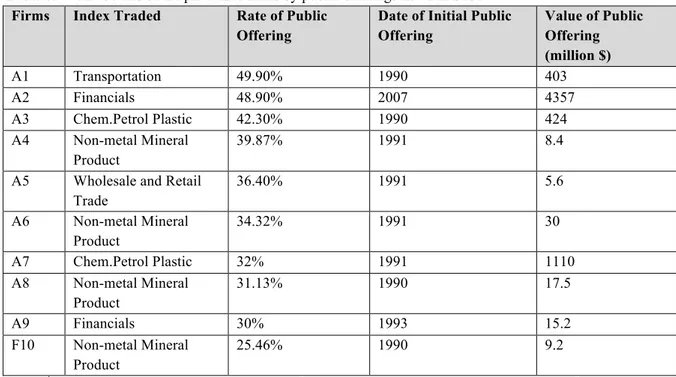
Table 02. The details of the privatized firms by public offerings listed in BIST* Firms Index Traded Rate of Public
Offering
Date of Initial Public Offering Value of Public Offering (million $) A1 Transportation 49.90% 1990 403 A2 Financials 48.90% 2007 4357 A3 Chem.Petrol Plastic 42.30% 1990 424 A4 Non-metal Mineral Product 39.87% 1991 8.4
A5 Wholesale and Retail Trade 36.40% 1991 5.6 A6 Non-metal Mineral Product 34.32% 1991 30 A7 Chem.Petrol Plastic 32% 1991 1110 A8 Non-metal Mineral Product 31.13% 1990 17.5 A9 Financials 30% 1993 15.2 F10 Non-metal Mineral Product 25.46% 1990 9.2
* Source: Doğan, M.N. (2016). Türkiye’de Özelleştirmenin Son 30 Yılı, T.C. Başbakanlık Özelleştirme
İdaresi Başkanlığı.
From the first privatization by public offering in 1988 to 2016, the highest public offering shares in privatization is %49.9 (Doğan, 2016) and four (A4, A6, A8, A10) out of ten firms with highest public offering shares operate in cement industry. Two firms are from banking industry and two firms are from energy industry. More to that, one is functioning in the air transportation and the last one is in the retail sector.The details of the firms are presented at table 2.
In the further sections, brand equity performances of these firms will be evaluated and discussed.
3.2. Analyses: Fuzzy DEMATEL
The DEMATEL (decision making trial and evaluation laboratory) is a method originated by the Geneva Research Centre of the Battelle Memorial Institute (Baykasoğlu et al. 2013). The use of the technique with the fuzzy sets theory provides the flexibility from the lack of knowledge under the uncertainty, imprecision and subjective information in case of the relationship of systems are generally presented with the crisp values in building a structural model. More to that, the Fuzzy DEMATEL is known as an extended technique for making better decisions under the fuzzy environment (Büyüközkan and Çifçi, 2012; Kuo, 2011; Abdullah and Zulkifli, 2015; Khorasaninejad et al. 2016). The Fuzzy DEMATEL technique can be detailed as follows (Uygun et al. 2015; Kuo, 2011; Baykasoğlu et al. 2013; Najafinasab et al. 2015; Yeh and Huang, 2014):
Step 1: Assign the ratings of relation between criteria with linguistic terms. The evaluation criteria is designed using the fuzzy linguistic scale.
Step 2: Compute the initial direct-relation fuzzy matrix. Direct relation matrix is constructed using the evaluations of the decision makers for each dimension and criterion. The decision makers’ scores can be obtained to present the pairwise comparisons of the dimensions and criteria with the fuzzy numbers. The initial direct-relation fuzzy matrix
𝑍
is constructed from the convergence of the linguistic terms provided by the experts scores where𝑍
!"= (𝑙
!", 𝑚
!", 𝑢
!")
presents the degree of the influence using triangular fuzzy numbers with the equation (1).𝑍
=⎥
⎥
⎥
⎥
⎥
⎥
⎦
⎤
⎢
⎢
⎢
⎢
⎢
⎢
⎣
⎡
0
~
~
~
0
~
~
~
0
2 1 2 21 1 12!
!
"
#
"
"
"
!
!
#
"
"
!
!
!
!
n n n nz
z
z
z
z
z
(1)The average fuzzy scores are used to obtain the initial direct-relation matrix with the equation (2).
𝑍 =
!!!!!!!!!⋯!!! (2)
Step 3: Normalize the direct effect matrix. The values are attained by normalizing the initial influence matrix with the following equations.
𝑋
=⎥
⎥
⎥
⎥
⎥
⎥
⎦
⎤
⎢
⎢
⎢
⎢
⎢
⎢
⎣
⎡
nn n n n nx
x
x
x
x
x
x
x
x
~
~
~
~
~
~
~
~
~
2 1 2 22 21 1 12 11!
!
"
#
"
"
"
!
!
#
"
"
!
!
!
!
(3) where𝑥
!"=
!!" !=
!!" !,
!!" !,
!!" ! (4)𝑟 = 𝑚𝑎𝑥
!!!!! !!!!𝑢
!" (5)Step 4: Construct the total influence fuzzy matrix. The total influence fuzzy matrix is calculated by the equations (6)-(12). Three crisp matrices are employed and
𝑥
!"= (𝑙′
!", 𝑚′
!", 𝑢′
!")
is defined as:𝑋
! =⎥
⎥
⎥
⎥
⎥
⎥
⎦
⎤
⎢
⎢
⎢
⎢
⎢
⎢
⎣
⎡
0
'
'
'
0
'
'
'
0
2 1 2 21 1 12!
!
"
#
"
"
"
!
!
#
"
"
!
!
!
!
n n n nl
l
l
l
l
l
𝑋
! =⎥
⎥
⎥
⎥
⎥
⎥
⎦
⎤
⎢
⎢
⎢
⎢
⎢
⎢
⎣
⎡
0
'
'
'
0
'
'
'
0
2 1 2 21 1 12!
!
"
#
"
"
"
!
!
#
"
"
!
!
!
!
n n n nm
m
m
m
m
m
𝑋
! =⎥
⎥
⎥
⎥
⎥
⎥
⎦
⎤
⎢
⎢
⎢
⎢
⎢
⎢
⎣
⎡
0
'
'
'
0
'
'
'
0
2 1 2 21 1 12!
!
"
#
"
"
"
!
!
#
"
"
!
!
!
!
n n n nu
u
u
u
u
u
(6) The total influence matrix is defined as:𝑇 = lim
!→!𝑋 + 𝑋
!+ ⋯ + 𝑋
! (7)𝑇
=⎥
⎥
⎥
⎥
⎥
⎥
⎦
⎤
⎢
⎢
⎢
⎢
⎢
⎢
⎣
⎡
nn n n n nt
t
t
t
t
t
t
t
t
~
~
~
~
~
~
~
~
~
2 1 2 22 21 1 12 11!
!
"
#
"
"
"
!
!
#
"
"
!
!
!
!
(8) where𝑡
!"= (𝑙′′
!", 𝑚′′
!", 𝑢′′
!")
and (9)𝑙′′
!"= 𝑋
!×(𝐼 − 𝑋
!)
!! (10)𝑚′′
!"= 𝑋
!×(𝐼 − 𝑋
!)
!! (11)𝑢′′
!"= 𝑋
!×(𝐼 − 𝑋
!)
!! (12)Step 5: Compute the defuzzified total influence matrix. The defuzzification of process is employed to obtain the influential network relation map with the values of
(𝐷
!+ 𝑅
!)
!"# and(𝐷
!− 𝑅
!)
!"# by the following equations.𝐷
!!"# indicates the the sum of all vector rows while𝑅
!!"#represents the sum of all vector colums.(𝐷
!+ 𝑅
!)
!"# denotes the total degree of the influence among criteria, and the higher its value, the closer the criterion is to object’s central point.(𝐷
!− 𝑅
!)
!"# is the degree of causality among criteria. When(𝐷
!− 𝑅
!)
!"# is positive, it means that criterion i influences other criteria. Otherwise, the criterion is influenced by other criteria.Converting fuzzy data into crisp scores deffuzzification method is applied to convert the triangular fuzzy numbers
𝑓
!"= (𝑙
!", 𝑚
!", 𝑢
!")
,𝑗 = 1, … , 𝐽
, the crisp value of the i-th criterion is determined by the equations (13)-(21) ( Opricovic, and Tzeng, 2003).𝑢
!!"#= 𝑚𝑎𝑥𝑢
!, 𝑙
!!"#= 𝑚𝑖𝑛𝑙
!𝑗
(13)∆
!"#!"#= 𝑢
!!"#− 𝑙
!!"# (14)𝑥
!"= 𝑙
!"− 𝑙
!!"#∆
!"# !"# (15)𝑥
!"= 𝑙
!"− 𝑙
!!"#∆
!"# !"# (16)𝑥
!"= 𝑢
!"− 𝑙
!!"#∆
!"# !"# (17)𝑥
!!"= 𝑥
!"1 + 𝑥
!"− 𝑥
!" (18)𝑥
!!"= 𝑥
!"1 + 𝑥
!"− 𝑥
!" (19)where ls and rs are the left and right normalized values respectively.
𝑥
!!"#$%= 𝑥
!!"1 − 𝑥
!!"
+ 𝑥
!!"𝑥
!!"1 − 𝑥
!!"+ 𝑥
!!" (20)𝑓
!"= 𝑙
!!"#+ 𝑥
!!"#$%
∆
!"#!"# (21)The deffuzzification procedure is applied for all criteria
𝑓
!, 𝑖 ∈ 𝑛,
where𝑛
denotes the set of criteria evaluated with fuzzy numbers.3.3. Analyses: Fuzzy VIKOR
Opricovic developed the method called as The VIKOR (Vlsekriterijumska Optimizacija I Kompromisno Resenje) in 90’s for the complex systems and compromise solution defining the closest one to the ideal solution and provides an agreement reached by mutual concessions (Yücenur and Demirel, 2012; Ju and Wang, 2013; Fu et al. 2010; Shaverdi et al. 2011; Wu et al. 2009; Ramezaniyan et al. 2012; Mohaghar et al., 2012). The method is employed for selecting a set of alternatives, and defining compromise solutions for the decision making problem with conflicting criteria to reach a final decision (Opricovic, 2011; Opricovic and Tzeng, 2007). The decision matrix of multi-criteria problem is presented as: C1 C2 C3 … Cn D=
⎥
⎥
⎥
⎥
⎥
⎥
⎦
⎤
⎢
⎢
⎢
⎢
⎢
⎢
⎣
⎡
mn m m m n n n mX
X
X
X
X
X
X
X
X
X
X
X
X
X
X
X
A
A
A
A
!
"
#
"
"
"
!
!
!
"
3 2 1 3 33 32 31 2 23 22 21 1 13 12 11 3 2 1 (22)where A1, A2, . . .,Am are possible alternatives, C1,C2, . . .,Cn are criteria Xij is the rating of alternative Ai with respect to criterion Cj.
The VIKOR method under the fuzzy environment can be detailed in the following steps (Chen and Klein, 1997):
Step 1: Determine the linguistic variables for evaluating alternatives. Linguistic terms and triangular fuzzy numbers are used for assessing alternatives.
Step 2: Construct the fuzzy decision matrix. The aggregated fuzzy ratings
x~
ijof alternatives and a fuzzy decision matrix are determined using linguistic evaluations provided by the decision makers with the equation (23)⎥
⎦
⎤
⎢
⎣
⎡
=
∑
= n e e ij ijx
k
x
1~
1
~
, i=1,2,3,…,m (23)Step 3: Calculate the fuzzy best and worst values. The fuzzy best value
~
f
j* and fuzzy worst value− j
f
~
for all criterion functions are computed by the formula (24)
, ~ max ~* ij i J x f = and
~
min
~
ij,
i jx
f =
− (24)Step 4: Compute mean group utility and maximal regret as:
(
)
(
)
∑
= −−
−
=
in j j ij j j if
f
x
f
w
S
1 * *~
~
~
~
~
~
(25)(
)
(
)
⎥
⎥
⎦
⎤
⎢
⎢
⎣
⎡
−
−
=
− j j ij j j j if
f
x
f
w
R
~
~
~
~
~
max
~
* * (26)where
w~
j are the fuzzy weights of criteria,S
~
i is Ai with respect to all criteria calculated by the total of the distance for the fuzzy best value, andR
~
i is Ai with respect to the j-th criterion, calculated by maximum distance of the fuzzy best value.Step 5: Compute the value of
Q
~
i. The value is calculated for final ranking by the equation (41):(
~
~
*) (
~
~
*)
( )
1
(
~
~
*) (
~
~
*)
~
R
R
R
R
v
S
S
S
S
v
Q
i=
i−
−−
+
−
i−
−−
(27) where i i S S~* min~ = ,S
iS
i~
max
~
=
− , i iR
R
~
*min
~
=
,R
iR
i~
max
~
=
− and v is presented as the weight
of the strategy of maximum group utility, whereas 1 – v is the weight of the individual regret (Kaya and Kahraman, 2010). In this study, v is assumed to have the value of 0.5.
Step 6: Sort the values of S,R,Q. After the defuzzification process of the
Q
~
iby the maximizing set and minimizing set method (Chen, 1985), the values S, R and Q in decreasing order are sorted for the alternatives. In addition, to check the final ranks, two conditions must be carried out:Condition 1: Acceptable Advantage is:
( ) ( )
(2) (1)1
/
(
1
)
−
≥
−
Q
A
j
A
Q
(28)where
A
(2)is the second position in the alternatives ranked by Q (minimum).Condition 2: Acceptable stability in decision making is:
The alternative
A
(1) must also be the best ranked by S or/and R. This compromise solution is stable within a decision-making process, which could be the strategy of maximum group utility (when v > 0.5 is needed), or ‘‘by consensus’’ v ≈ 0.5, or ‘‘with veto’’ (v < 0.5).“If one of the conditions is not satisfied, a set of compromise solutions is selected. The compromise solutions are composed of (1) alternatives
A
(1)andA
(2)if only condition C2 is not satisfied, or (2) alternativesA
(1),A
(2) . . . ,A
(M) if condition C1 is not satisfied.A
(M)is calculated by the relation(
( )) ( )
(1)1
/
(
1
)
−
<
−
Q
A
j
A
Q
M for maximum M (the positions of these alternatives are close)” (Dincer and Hacioglu, 2013:1078).4. An Application on Privatized Firms listed in Borsa Istanbul
Using Fuzzy method, the alternative sample firms are ranked through a two-phased analysis. First phase defines the relative importance of the dimensions with the fuzzy DEMATEL and the following phase continues with the fuzzy VIKOR to rank the alternatives.
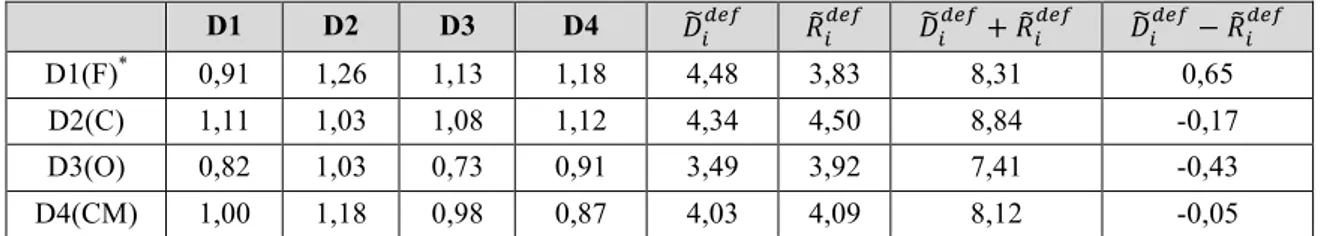
Table 03. Total influence matrix and impact-relationship degrees of the dimensions
D1 D2 D3 D4 𝐷!!"# 𝑅!!"# 𝐷!!"#+ 𝑅!!"# 𝐷!!"#− 𝑅!!"# D1(F)* 0,91 1,26 1,13 1,18 4,48 3,83 8,31 0,65
D2(C) 1,11 1,03 1,08 1,12 4,34 4,50 8,84 -0,17 D3(O) 0,82 1,03 0,73 0,91 3,49 3,92 7,41 -0,43 D4(CM) 1,00 1,18 0,98 0,87 4,03 4,09 8,12 -0,05 *F stands for financial, C stands for Consumer, O refers to organizational and CM refers to competition dimensions.
The importance of the dimensions and the cause and effect relationships could be presented by using the Fuzzy DEMATEL method. As seen in table 4, D2 is the most important factor while D3 has the weakest importance in the brand equity. Additionally, D1 is the most influential factor in the balanced scorecard-based brand equity factors as D2, D3, and D4 are all influenced by D1.
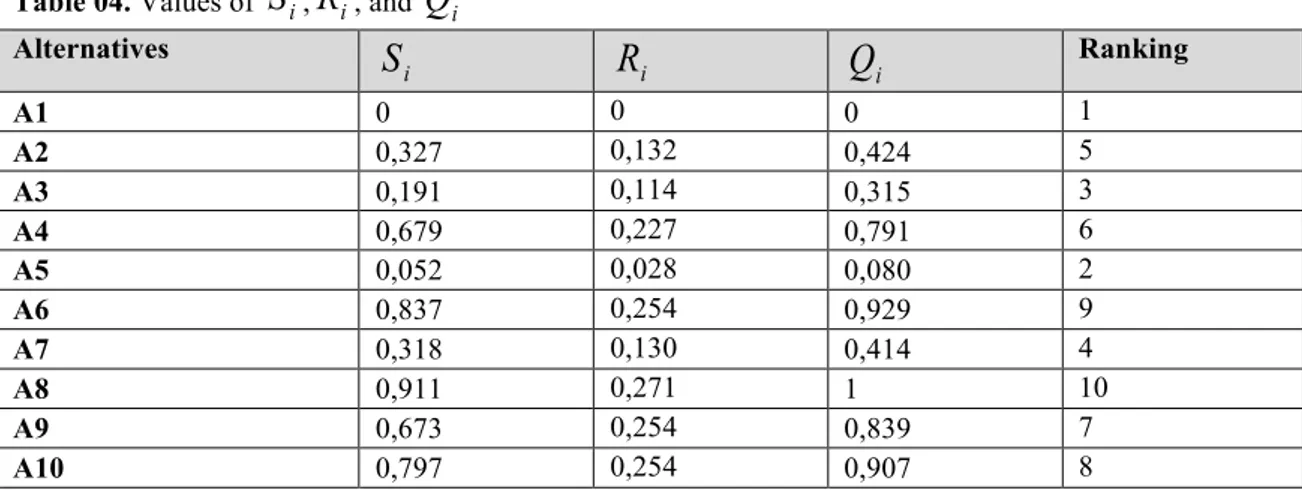
Table 04. Values of
S
i,R
i, andQ
i Alternatives iS
R
iQ
i Ranking A1 0 0 0 1 A2 0,327 0,132 0,424 5 A3 0,191 0,114 0,315 3 A4 0,679 0,227 0,791 6 A5 0,052 0,028 0,080 2 A6 0,837 0,254 0,929 9 A7 0,318 0,130 0,414 4 A8 0,911 0,271 1 10 A9 0,673 0,254 0,839 7 A10 0,797 0,254 0,907 8The alternatives are ranked via the Fuzzy VIKOR method. Table 4 illustrates that A1 is the best firm in the performance while A8 has the worst performance in balanced scorecard-based brand equity. The performance results of the brand equity for the privatized firms listed in BIST are ranked as A1, A5, A3, A7, A2, A4, A9, A10, A6, and A8 respectively.
5. Conclusion and Discussions
As a financial and value creating asset, brand equity has a strategic importance for firms regardless of industry. In evaluating brand equity, relying only on consumer or financial measures would only provide a single perspective. By adopting a BSC mind set, the current study evaluates brand equity performance of the Turkish firms privatized by public offerings based on financial, consumer, organizational and competition perspectives.
The study findings provide evidence that in evaluating brand equity, consumer-based is the most important dimension followed by financial-based dimension. The explanation behind this finding can be traced in the numerous consumer-based brand equity studies based on the basic premise that the perceptions, attitudes or behaviours of consumers is the main determinant of brand equity (Aacker,1996; Keller 1993; Yoo, & Donthu, 2001; Chaudhuri, & Holbrook, 2001; Nam et al, 2011). Furthermore, financial-based dimension is found out to be influential on the other dimensions. Also, organization-based perspective is found out to be least influential factor on brand equity when compared with other dimensions of the study. Thereby, it can be stated that study results confirm brand equity literature by presenting consumer and financial perspectives as the most significant determinants of brand equity performance.
The brand equity performance ranking list presents that A1 has the highest whereas A8 has the lowest brand equity performance. Although there are some deviations, the list shows that firms with high rate of public offering shares also have high brand equity performances. The exceptions of A7 and A5 can be explained through these companies’ organizational features. Both firms are the oldest and the most influential corporations in their industries; and hence, they have already developed a strong brand equity performance regardless of the privatization. Similarly though having a high level of public offering shares, A2 is perceived as one of the old-fashioned, bureaucratic corporation by most Turkish consumers.
These findings once again indicate that brand equity should be evaluated through a multiple set of dimensions rather than one measure.
As a final note to the managers, it can be recommended that a special attention should be paid to consumer perceptions, attitudes and behaviours in terms of branding strategies. Correspondingly the financial indicators as market capitalization and cash flows should be taken into consideration both for brand equity performance and sustainable business success. Further to that, introducing new products or services that could create an influence in the market and adopting marketing strategies for brand growth and extensions should be supported by R&D activities.
As for the limitations of the study, it can also be stated that the findings of the study can’t be generalized to all firms. Thereby for future studies, it can be advised to focus on other forms of privatization, on industrial differences and on cross-country analyses through different models and methods to provide a richer grasp of brand equity measurements.
References
Aacker, D.A. (1996). Measuring brand equity across products and markets. California Management Review, 38(3), 102–120.
Aaker, D. A. (1991). Managing brand equity: capitalizing on the value of a brand name, The Free Press, New York.
Abdullah, L., & Zulkifli, N. (2015). Integration of fuzzy AHP and interval type-2 fuzzy DEMATEL: An application to human resource management. Expert Systems with Applications, 42(9), 4397-4409. Baker, C., Nancarrow, C., and Tinson, J. (2005) “The mind versus market share guide to brand equity”
International Journal of Market Research, 47(5), 523-540.
Baykasoğlu, A., KaplanoğLu, V., DurmuşoğLu, Z. D., & Şahin, C. (2013). Integrating fuzzy DEMATEL and fuzzy hierarchical TOPSIS methods for truck selection. Expert Systems with Applications, 40(3), 899-907.
Bontis, N., & Fitz-Enz, J. (2002). Intellectual capital ROI: a causal map of human capital antecedents and consequents. Journal of IntellectualCapital, 3(3), 223-247.
Budac, C., & Baltador, L. (2013). The value of brand equity. Procedia Economics and Finance, 6, 444-448.
Büyüközkan, G., & Çifçi, G. (2012). A novel hybrid MCDM approach based on fuzzy DEMATEL, fuzzy ANP and fuzzy TOPSIS to evaluate green suppliers. Expert Systems with Applications, 39(3), 3000-3011.
Chaudhuri, A., & Holbrook, M. B. (2001). The chain of effects from brand trust and brand affect to brand performance: the role of brand loyalty. Journal of Marketing, 65(2), 81-93.
Chen, C. and Klein, C. M. (1997). An efficient approach to solving fuzzy MADM problems. Fuzzy Sets and Systems, 88, 51-67.
Chen, S. (1985). Ranking Fuzzy Numbers With Maximizing Set and Minimizing Set. Fuzzy Sets and Systems, 17: 113129.
Christodoulides, G., & De Chernatony, L. (2010). Consumer-based brand equity conceptualization and measurement: A literature review. International journal of research in marketing, 52(1), 43-66. Davis, S.M. (2000) Brand Asset Management, Jossey Bass, CA.
Davis, S., & Albright, T. (2004). An investigation of the effect of balanced scorecard implementation on financial performance. Management Accounting Research, 15(2), 135-153.
De Geuser, F., Mooraj, S., & Oyon, D. (2009). Does the balanced scorecard add value? Empirical evidence on its effect on performance. European Accounting Review, 18(1), 93-122.
Dincer, H., & Hacioglu U. (2013). Performance evaluation with fuzzy VIKOR and AHP method based on customer satisfaction in Turkish banking sector. Kybernetes, 42(7), 1072-1085.
Doğan, M.N. (2016). Türkiye’de Özelleştirmenin Son 30 Yılı, T.C. Başbakanlık Özelleştirme İdaresi Başkanlığı.
Fu, H.P., Chu, K.K., Chao, P., Lee, H.H. and Liao, Y.C. (2010), “Using fuzzy AHP and VIKOR for benchmarking analysis in the hotel industry”. The Service Industries Journal, Vol. 31, No. 14, pp. 2373-2389.
Hoque, Z., & James, W. (2000). Linking balanced scorecard measures to size and market factors: impact on organizational performance. Journal Of Management Accounting Research, 12(1), 1-17. Ju, Y. and Wang, A. (2013). Extension of VIKOR method for multi-criteria group decision making
problem with linguistic information. Applied Mathematical Modelling, Vol. 37, pp. 3112-3125. Kaplan, R.S. and Norton, D.P. (1996). Linking the balanced scorecard to strategy. California
Management Review, Vol. 39 No. 1,pp. 53-79.
Kaplan, R. and Norton, D. (1992). The balanced scorecard: measures that drive performance, Harvard Business Review 70 (1), 71–79.
Kaya, T. and Kahraman, C. (2010). Multicriteria renewable energy planning using an integrated fuzzy VIKOR & AHP methodology: The case of Istanbul. Energy, 35, 2517-2527.
Keller, K.L. (1993). Conceptualizing, measuring ,and managing customer-based brand equity. Journal of Marketing, 57, 1–22.
Khorasaninejad, E., Fetanat, A., & Hajabdollahi, H. (2016). Prime mover selection in thermal power plant integrated with organic Rankine cycle for waste heat recovery using a novel multi criteria decision making approach. Applied Thermal Engineering, 102, 1262-1279.
Kuo, M. S. (2011). Optimal location selection for an international distribution center by using a new hybrid method. Expert Systems with Applications, 38(6), 7208-7221.
Mahajan, V, Rao, VR. & Srivastava, RK. (1994). An approach to assess the importance of brand equity in acquisition decisions. J Prod Innovation Management,11:221-35.
Marr, B., & Schiuma, G. (2003). Business performance measurement–past, present and future. Management decision, 41(8), 680-687.
Matear, S., Gray, B. J., & Garrett, T. (2004). Market orientation, brand investment, new service development, market position and performance for service organisations. International Journal of Service Industry Management, 15(3), 284-301.
Matilla, A.S., 2001. The impact of relationship type on customer loyalty in a context of service failure. J. Serv. Res. 4 (2), 91-101.
Mizik, N. and Jacobson, R. (2008). The Financial Value Impact of Perceptual Brand Atributes. Journal of Marketing Research, 45, 1, pp. 15-32.
Mohaghar, A., Fathi, M.R., Zarchi, M.H. and Omidian, A. (2012). A combined VIKOR – Fuzzy AHP approach to marketing strategy selection. Business Management and Strategy, 3(1), 13-27. Najafinasab, F., Karbassi, A. R., & Ghoddousi, J. (2015). Fuzzy analytic network process approach to
evaluate land and sea criteria for land use planning in coastal areas. Ocean & Coastal Management, 116, 368-381.
Nam, J., Ekinci, Y., & Whyatt, G. (2011). Brand equity, brand loyalty and consumer satisfaction. Annals of Tourism Research, 38(3), 1009-1030.
Ngo, L. V., & O'Cass, A. (2012). In search of innovation and customer‐related performance superiority: The role of market orientation, marketing capability, and innovation capability interactions. Journal of Product Innovation Management, 29(5), 861-877.
Opricovic, S. (2011). Fuzzy VIKOR with an application to water resources planning. Expert Systems with Applications, 38, 12983–12990.
Opricovic, S. & Tzeng, Gwo-Hshiung (2007). Extended VIKOR method in comparison with outranking methods. European Journal of Operational Research, 178, 514–529.
Opricovic, S., & Tzeng, G. H. (2003). Defuzzification within a multicriteria decision model. International Journal of Uncertainty, Fuzziness and Knowledge-Based Systems, 11(05), 635-652.
Perkins M., Grey A., and Remmers H. (2014). What do we really mean by “Balanced Scorecard”?. International Journal of Productivity and Performance Management, 63(2), 148-169.
Ramezaniyan, M., Kazemi, M., Jafari, H. and Elahi, S. (2012). Application of integrated fuzzy VIKOR and AHP methodology to contractor ranking. Management Science Letters, 2(5), 1511-1526. Seggie, S. H., Kim, D., & Cavusgil, S. T. (2006). Do supply chain IT alignment and supply chain
interfirm system integration impact upon brand equity and firm performance?. Journal of Business Research, 59(8), 887-895.
Sharma, P., Davcik, N. S., & Pillai, K. G. (2016). Product innovation as a mediator in the impact of R&D expenditure and brand equity on marketing performance. Journal of Business Research, 69(12), 5662-5669.
Shaverdi, M., Akbari, M. and Tafti, S.F. (2011). Combining fuzzy MCDM with BSC approach in performance evaluation of Iranian private banking sector. Advances in Fuzzy Systems, 12, 1-12. Simon, C. J., & Sullivan, M. W. (1993). The measurement and determinants of brand equity: A financial
approach. Marketing Science, 12(1), 28-52.
Sok, P., O’Cass, A., & Sok, K. M. (2013). Achieving superior SME performance: Overarching role of marketing, innovation, and learning capabilities. Australasian Marketing Journal, 21(3), 161-167. Sriram, S., Balachander, S., & Kalwani, M. U. (2007). Monitoring the dynamics of brand equity using
store-level data. Journal of Marketing, 71(2), 61–78.
Srivastava R.K. & Shocker A.D. (1991). Brand equity: a perspective on its meaning and measurement. Marketing Science Institute: Cambridge.
Uygun, Ö., Kaçamak, H., & Kahraman, Ü. A. (2015). An integrated DEMATEL and Fuzzy ANP techniques for evaluation and selection of outsourcing provider for a telecommunication company. Computers & Industrial Engineering, 86, 137-146.
Wu, H.Y., Tzeng, G.H. & Chen, Y.H. (2009). Fuzzy MCDM approach for evaluating banking performance based on balanced scorecard. Expert Systems with Applications, 36, 10135-10147. Yeh, T. M., & Huang, Y. L. (2014). Factors in determining wind farm location: Integrating GQM, fuzzy
DEMATEL, and ANP. Renewable Energy, 66, 159-169.
Yoo, B., & Donthu, N. (2001). Developing and validating a multidimensional consumer-based brand equity scale. Journal of Business Research, 52(1), 1-14.
Yücenur, G.Y., & Demirel, N.Ç. (2012). Group decision making process for insurance company selection problem with extended VIKOR method under fuzzy environment. Expert Systems with Applications, 39, 3702–3707.