RAPID INCREASE IN NON-AGRICULTURAL UNEMPLOYMENT CONTINUES
Seyfettin Gürsel*and Ayşenur AcarAbstract
Seasonally adjusted labor market data shows that non-agricultural unemployment rate increased by 0.5 percentage points in the period of July 2014 compared to the period of June 2014, and reached 12.5 percent. Slight increase in non-agricultural employment was not enough to offset the strong increase in non-agricultural labor force. We observe a stagnation in construction employment. Employment losses in manufacturing sector were
counterbalanced with the employment increases in service sector. Our forecasting model based on Kariyer.net series indicate that non-agricultural unemployment will continue to increase in the next period.
Rapid increase in non-agricultural labor force and slowing-down in non-agricultural employment
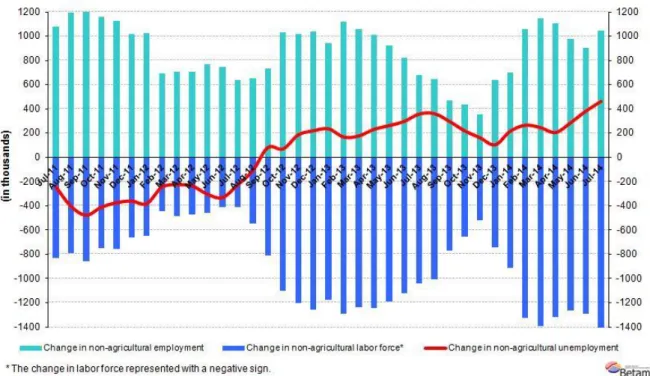
According to the data released by TurkSTAT, non-agricultural labor force increased by 1 million 510 thousand (6.9 percent) and non-agricultural employment increased by 1 million 46 thousand (5.4 percent) in the period of July 2014 (Figure 1). Consequently, the number of persons unemployed in non-agricultural sectors increased by 464 thousand. Non-agricultural employment increased below 1 million in the periods of May and June 2014. The increase in non-agricultural labor force in the period of July 2014 is the highest observed since the beginning of the monthly labor market series.
Figure 1 Year-on-year changes in non-agricultural labor force, employment and unemployment
Source: TurkSTAT,Betam
Strong increase in non-agricultural unemployment
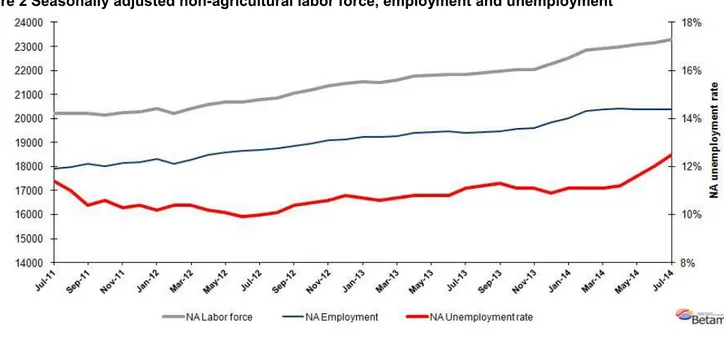
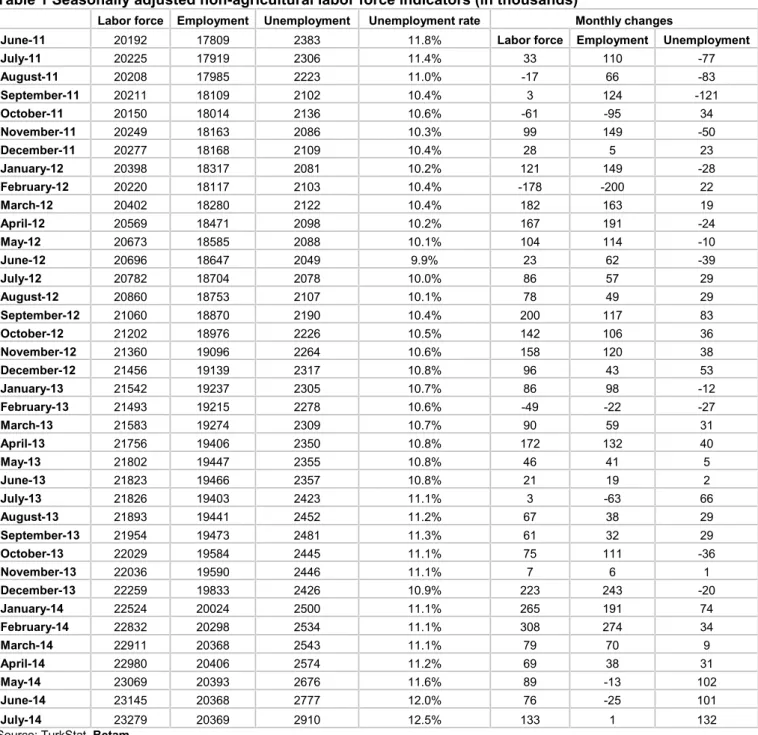
According to seasonally adjusted data, non-agricultural labor force increased by 133 thousand in the period of July 2014 compared to the period of June 2014, and reached 23 million 279 thousand (Figure 2, Table 1).
Non-*Prof. Dr. Seyfettin Gürsel, Betam, Director, [email protected]
Ayşenur Acar, PhD, Betam, Research Assistant, [email protected]
Labor Market Outlook:
October 2014
www.betam.bahcesehir.edu.tr
2
agricultural employment decreased by one thousand and reached 20 million 369 thousand. Hence, the number of persons unemployed in non-agricultural sectors increased by 132 thousand and non-agricultural unemployment rate increased by 0.5 percentage point and reached 12.5 percent. Non-agricultural unemployment that has been moving in the range of 10-11 percent January 2011 and reached its peak rate (12 percent) in the period of June 2014. In the period of July 2014, non-agricultural unemployment strongly increased by 0.5 percentage point and reached 12.5 percent. Low economic growth begins to sharply increase the unemployment rate.
Figure 2 Seasonally adjusted non-agricultural labor force, employment and unemployment
Source: TurkStat,Betam
Non-agricultural unemployment will continue to increase in the next period
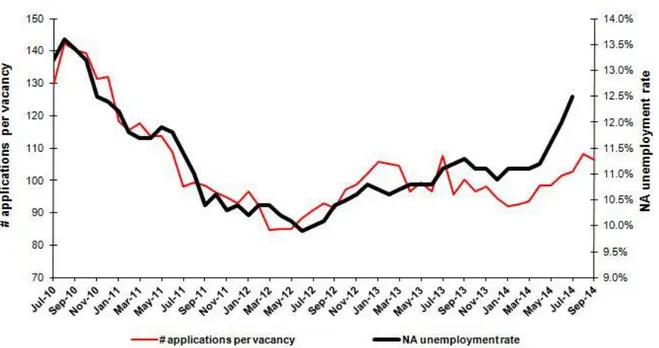
Our calculations based on the seasonally adjusted application per vacancy statistics calculated using Kariyer.net1
series accurately predicted the direction of unemployment for the periods of June and July 2014. Parallel to our expectations, unemployment strongly increased in these two periods. The seasonally adjusted application per vacancy statistics calculated using Kariyer.net are presented in Figure 3. The application per vacancy has been increasing since January 2011, continued to increase in July and August 2014, but it decreases in September 2014. According to the our forecasting model, unemployment figure of August 2014 that is average of three months, we expect that unemployment will increase in the period of August 2014.
1 Betam has been calculating application per vacancy using series released by Kariyer.net for a while. Seasonal and calendar adjustment
procedure is applied to application per vacancy series. A decrease in applications per vacancy may be caused by an increase in vacancies or by a decrease in the number of applications. An increase in vacancies signals economic growth while decreasing number of applications indicates a decrease in number of people looking for a job. Monthly labor market series released by TurkStat is the average of three months. Therefore, application per vacancy statistics calculated using Kariyer.net series is the average of three months as well.
Figure 3 Seasonally adjusted non-agricultural unemployment rate and application per vacancy
Source: Kariyer.net, TurkStat,Betam
Employment losses in manufacturing sector
Seasonally adjusted labor market series show that construction employment that has been decreasing since the last four periods, slightly increased by 2 thousand in the period July 2014 (Table 2, Figure 4).2Employment in services increased by 89 thousand. However, employment in manufacturing sector that has been either decreasing or slightly increasing, decreased by 89 thousand. Employment increase in services was counterbalanced with the employment decline in manufacturing sector, and therefore, non-agricultural employment slightly increased in the period of July 2014. Even though slowdown in economic growth in the second quarter affects construction and manufacturing employment, one should be cautious in reading the labor market statistics as recent revisions caused a break in the series and the base effects continue (Figure 4). Increases in unemployment will probably slow down in the next period.
2Employment in each sector is seasonally adjusted separately. Hence the sum of these series may differ from the seasonally adjusted series of
www.betam.bahcesehir.edu.tr
4
Figure 4 Employment by sectors (in thousands)3Source: TurkStat,Betam
Table 1 Seasonally adjusted non-agricultural labor force indicators (in thousands)
Labor force Employment Unemployment Unemployment rate Monthly changes
June-11 20192 17809 2383 11.8% Labor force Employment Unemployment
July-11 20225 17919 2306 11.4% 33 110 -77 August-11 20208 17985 2223 11.0% -17 66 -83 September-11 20211 18109 2102 10.4% 3 124 -121 October-11 20150 18014 2136 10.6% -61 -95 34 November-11 20249 18163 2086 10.3% 99 149 -50 December-11 20277 18168 2109 10.4% 28 5 23 January-12 20398 18317 2081 10.2% 121 149 -28 February-12 20220 18117 2103 10.4% -178 -200 22 March-12 20402 18280 2122 10.4% 182 163 19 April-12 20569 18471 2098 10.2% 167 191 -24 May-12 20673 18585 2088 10.1% 104 114 -10 June-12 20696 18647 2049 9.9% 23 62 -39 July-12 20782 18704 2078 10.0% 86 57 29 August-12 20860 18753 2107 10.1% 78 49 29 September-12 21060 18870 2190 10.4% 200 117 83 October-12 21202 18976 2226 10.5% 142 106 36 November-12 21360 19096 2264 10.6% 158 120 38 December-12 21456 19139 2317 10.8% 96 43 53 January-13 21542 19237 2305 10.7% 86 98 -12 February-13 21493 19215 2278 10.6% -49 -22 -27 March-13 21583 19274 2309 10.7% 90 59 31 April-13 21756 19406 2350 10.8% 172 132 40 May-13 21802 19447 2355 10.8% 46 41 5 June-13 21823 19466 2357 10.8% 21 19 2 July-13 21826 19403 2423 11.1% 3 -63 66 August-13 21893 19441 2452 11.2% 67 38 29 September-13 21954 19473 2481 11.3% 61 32 29 October-13 22029 19584 2445 11.1% 75 111 -36 November-13 22036 19590 2446 11.1% 7 6 1 December-13 22259 19833 2426 10.9% 223 243 -20 January-14 22524 20024 2500 11.1% 265 191 74 February-14 22832 20298 2534 11.1% 308 274 34 March-14 22911 20368 2543 11.1% 79 70 9 April-14 22980 20406 2574 11.2% 69 38 31 May-14 23069 20393 2676 11.6% 89 -13 102 June-14 23145 20368 2777 12.0% 76 -25 101 July-14 23279 20369 2910 12.5% 133 1 132
6
Table 2 Seasonally adjusted employment by sector (in thousands)Agriculture Manufacturing Construction Service Monthly changes
June-11 5364 4826 1681 11302 Agriculture Manufacturing Construction Service
July-11 5391 4846 1706 11367 27 20 25 65 August-11 5450 4816 1761 11408 59 -30 55 41 September-11 5381 4866 1763 11481 -69 50 2 73 October-11 5412 4823 1681 11510 31 -43 -82 29 November-11 5404 4870 1671 11622 -8 47 -10 112 December-11 5328 4873 1636 11659 -76 3 -35 37 January-12 5333 4864 1709 11745 5 -9 73 86 February-12 5275 4808 1563 11746 -58 -56 -146 1 March-12 5223 4850 1577 11853 -52 42 14 107 April-12 5251 4930 1651 11890 28 80 74 37 May-12 5295 4908 1725 11951 44 -22 74 61 June-12 5253 4900 1746 12002 -42 -8 21 51 July-12 5264 4926 1736 12041 11 26 -10 39 August-12 5253 4892 1764 12097 -11 -34 28 56 September-12 5316 4911 1780 12179 63 19 16 82 October-12 5355 4917 1784 12275 39 6 4 96 November-12 5363 5003 1804 12289 8 86 20 14 December-12 5345 5051 1778 12309 -18 48 -26 20 January-13 5331 5073 1815 12350 -14 22 37 41 February-13 5297 5023 1802 12389 -34 -50 -13 39 March-13 5282 5083 1785 12406 -15 60 -17 17 April-13 5272 5176 1805 12426 -10 93 20 20 May-13 5211 5200 1749 12499 -61 24 -56 73 June-13 5184 5163 1781 12521 -27 -37 32 22 July-13 5201 5146 1727 12530 17 -17 -54 9 August-13 5212 5117 1753 12571 11 -29 26 41 September-13 5203 5096 1779 12598 -9 -21 26 27 October-13 5115 5090 1853 12641 -88 -6 74 43 November-13 5074 5064 1806 12720 -41 -26 -47 79 December-13 5059 5131 1899 12803 -15 67 93 83 January-14 5402 5232 1953 12839 343 101 54 36 February-14 5530 5359 2020 12919 128 127 67 80 March-14 5601 5365 1982 13022 71 6 -38 103 April-14 5566 5373 1904 13129 -35 8 -78 107 May-14 5568 5364 1854 13175 2 -9 -50 46 June-14 5495 5332 1800 13236 -73 -32 -54 61 July-14 5422 5243 1802 13325 -73 -89 2 89