Pyroelectric Infrared (PIR) Sensor Based Event Detection
a thesis
submitted to the department of electrical and
electronics engineering
and the institute of engineering and sciences
of b
˙Ilkent university
in partial fulfillment of the requirements
for the degree of
master of science
By
Emin Birey Soyer
July 2009
Prof. Dr. Enis C¸ etin(Supervisor)
I certify that I have read this thesis and that in my opinion it is fully adequate, in scope and in quality, as a thesis for the degree of Master of Science.
Assoc. Prof. Dr. U˘gur G¨ud¨ukbay
I certify that I have read this thesis and that in my opinion it is fully adequate, in scope and in quality, as a thesis for the degree of Master of Science.
Asst. Prof. Dr. Sinan Gezici
Approved for the Institute of Engineering and Sciences:
Prof. Dr. Mehmet Baray
Director of Institute of Engineering and Sciences
ABSTRACT
Pyroelectric Infrared (PIR) Sensor Based Event Detection
Emin Birey Soyer
M.S. in Electrical and Electronics Engineering
Supervisor: Prof. Dr. Enis C
¸ etin
July 2009
Pyroelectric Infra-red (PIR) sensors have been extensively used in indoor and outdoor applications as they are low cost, easy to use and widely available. PIR sensors respond to IR radiating objects moving in its viewing range. The current sensors give an output of logical one when they detect a hot object’s motion and a logical zero when there is no moving hot object. In this method, only moving objects can be detected and the rate of false alarm is high.
New types of PIR sensors are more sophisticated and more capable. They have a lower false alarm ratio compared to classical ones. Although they can distinguish pets and humans, again they can only be used for detection of hot object motions due to the limitations caused by the usage of the simple compara-tor structure inside. This structure is unalterable, not flexible for development, and not suitable for implementing algorithms.
A new approach is developed to use PIR sensors by modifying the sensor circuitry. Instead of directly using the output of a classical PIR sensor, an ana-log signal is extracted from the PIR output and it is sampled. As a result, intelligent signal processing algorithms can be developed using the discrete-time sensor signal. In this way, it is possible to develop human, pet and flame de-tection methods. It is also possible to find the direction of moving objects and
We focus on object and event classification using sampled PIR sensor sig-nals. Pet, human and flame detection methods are comparatively investigated. Different human motion events are modeled and classifed using Hidden Markov Models (HMM) and Conditional Gaussian Mixture Models (CGMMs). The sam-pled data is wavelet transformed for feature extraction and then fed into HMMs for analysis. The final decision is reached according to the Markov Model pro-ducing the highest probability. Experimental results demonstrate the reliability of the proposed HMM based decision and event classification algorithm.
Keywords: Pyroelectric infra-red (PIR) sensor, flame detection, pet detection, human detection, event detection, wavelet transform, Hidden Markov Models, Conditional Gaussian Mixture Models, classification, Bayesian Statistics, Least-Mean-Square (LMS) algorithm
¨
OZET
P˙IROELEKTR˙IK KIZILBER˙IS˙I ALGILAYICI TABANLI OLAY
TESP˙IT˙I
Emin Birey Soyer
Elektrik ve Elektronik M¨
uhendisli˘
gi B¨
ol¨
um¨
u Y¨
uksek Lisans
Tez Y¨
oneticisi: Prof. Dr. Enis C
¸ etin
Temmuz 2009
Piroelektrik Kızıl¨otesi (P˙IK) algılayıcılar, ucuz, kolay kullanımlı ve kolay bulu-nabilir olduklarından dolayı, i¸c ve dı¸s mekan uygulamalarında ¸co˘gunlukla kul-lanılmaktadır. PIR sens¨orler, g¨ord¨ukleri alanda hareket eden ve kızıl¨otesi yayın yapan nesnelere tepki verir. Mevcut algılayıcılar, hareket eden sıcak bir nesne g¨ord¨uklerinde mantıksal bir, hi¸c bir ¸sey g¨ormediklerinde ise mantıksal sıfır verir-ler. Bu y¨ontemle, sadece hareket eden nesneler tespit edilir ve hata oranı y¨uksektir.
Yeni nesil P˙IK algılayıcılar daha karma¸sık ve daha yeteneklidir. Bilinen di˘gerlerine g¨ore daha d¨u¸s¨uk bir hata oranına sahiptirler. ˙Insanlarla hayvanları birbirinden ayırabilmesine ra˘gmen, basit bir kıyaslayıcı devresinin kullanılması nedeniyle, sadece hareket eden sıcak nesneleri algılamak i¸cin kullanılır. Bu yapı de˘gi¸stirilemez, geli¸stirmek i¸cin esnek de˘gildir ve algoritmaları uyumlamak i¸cin elveri¸sli de˘gildir.
Bu ¸calı¸smada, bu algılayıcıların kullanımı i¸cin yeni bir yakla¸sım ger¸cekle¸stiril-mi¸stir. Mevcut P˙IK algılayıcıların ¸cıkı¸slarını do˘grudan kullanmak yerine, piyasada bulunan P˙IK algılayıcılar uyarlanarak kullanılmı¸stır. Bu yapı sa-yesinde, P˙IK algılayıcıların ¨orneksel ¸cıkı¸sları ¨orneklenmi¸stir. Ayrıca, bu ¨
geli¸stirilebilmektedir. Ayrıca, algılayıcı dizisi kullanılarak hareket eden hedefin iz tespiti yapılabilir.
Bu ¸calı¸smada, P˙IK algılayıcıların ¨orneklenmi¸s ¸cıkı¸sları kullanılarak, nesne ve olay ayrımı ¨uzerine yo˘gunla¸sılmı¸stır. Hayvan, insan ve alev tespiti, kar¸sılıklı olarak ara¸stırılmı¸stır. Farklı insan hareketleri modellenmi¸stir ve sınıflandırılmı¸stır. Hesaplama maliyetini az tutmak i¸cin, Hızlı Fourier D¨on¨u¸s¨um¨u (HFD) y¨ontemleri kullanılmamı¸stır. Onun yerine, farklı nesneleri tanımlamak i¸cin bir raslantısal y¨ontem, Saklı Markov Modeli (SMM), kullanılmı¸stır ve farklı olayları tanımlamak i¸cin Ko¸sullu Gauss Karı¸sım Modelleri (KGKM) kul-lanılmı¸stır. ¨Orneklenen veri, nitelik ¸cıkartma i¸cin dalgacık d¨on¨u¸s¨um¨une s¨ur¨ul¨ur ve sonra analiz i¸cin SMM’ye verilir. Herbir SMM’de ¨uretilen olasılıklardan y¨uksek olanına g¨ore karar verilir. Farklı senaryolar i¸ceren deneysel testler, ¨onerilen SMM y¨onteminin g¨uvenilirli˘gini g¨ostermektedir.
Anahtar Kelimeler: piro-elektrik kızılberisi algılayıcı, alev tespiti, hayvan tespiti, insan tespiti, olay tespiti, dalgacık d¨on¨u¸s¨um¨u, saklı Markov modelleri, ko¸sullu Gauss karı¸sım modelleri, sınıflandırma, Bayes sayımlamaları, en k¨u¸c¨ uk-ortalama-kare algoritması
ACKNOWLEDGEMENTS
I would like to express my gratitude to my supervisor Prof. Dr. A. Enis C¸ etin for his guidance and valuable comments throughout my thesis and its directive actions for me to improve my skills. His wise knowledge inspired me in my re-search.
I would like to thank Prof. U˘gur G¨ud¨ukbay and Prof. Sinan Gezici for show-ing keen interest to subject matter and acceptshow-ing to read and review my thesis. Furthermore, I would like to thank Dr.Beh¸cet U˘gur T¨oreyin, Dr.Onay Ur-falıo˘glu for their guidance and valuable comments involving their experience. Also, I would like thank to my colleagues and closest friends M. Sencer Aky¨uz,
¨
Ozkan Sa˘glam, for their unlimited support.
I wish to thank all of my friends and colleagues at ISYAM and our depart-ment for their collaboration and support. My special thanks go to Erdem Den-gel,Yi˘githan Dedeo˘glu, Fatih Erden. I would also like to thank our department’s secretary M¨ur¨uvet Parlakay for her assistance during my years in Bilkent.
Besides, I am grateful that Aselsan Inc. has given me opportunity to com-plete my Master’s Degree. My colleagues also deserve my thankfulness for their continuing support and comments.
Finally, I would like to give my best gratitude to my family, for their support and encouragement to complete this thesis.
1 INTRODUCTION 1
2 Pyroelectric Infrared (PIR) Sensors 5
2.1 IR Radiation . . . 8
2.2 Pyroelectricity . . . 9
2.3 Theory of Operation . . . 10
2.4 PID Sensor Module Configuration . . . 11
2.4.1 Fresnel Lens . . . 11
2.4.2 PIR Sensors . . . 14
2.4.3 Amplifier Circuitry . . . 17
2.4.4 Comparator . . . 20
2.5 First Generation (Ordinary) Sensors . . . 23
2.6 Second Generation Sensors . . . 24
2.7 Third Generation Sensors . . . 24
3 Pet Detection 26 3.1 Data Processing . . . 27 3.2 Experimental Results . . . 31 3.3 Conclusion . . . 34 4 Flame Detection 35 4.1 Data Acquisition . . . 37
4.2 Sensor Data Processing and HMMs . . . 41
4.2.1 Threshold Estimation for State Transitions . . . 46
4.3 Experimental Results . . . 48
4.4 Summary . . . 49
5 Human Motion Event Detection 51 5.1 PIR Event Detection System . . . 52
5.1.1 Event Classes . . . 52
5.1.2 Feature Extraction using Wavelet Domain Processing . . . 53
5.1.3 GMM Training . . . 55
5.1.4 Event Detection . . . 55
5.2 Experimental Results . . . 56
5.3 Conclusion . . . 59
6 Conclusions and Future Work 60
List of Figures
2.1 A typical PID sensor block schema. . . 10 2.2 A plano convex lens and fresnel lens, adopted from [2]. . . 11
2.3 Typical fresnel lens dimensions, adopted from [2]. . . 12 2.4 An example pattern for D203S model PID, adopted from [3]. . . . 13
2.5 Three types of PIDs and their patterns, adopted from [4]. . . 13
2.6 The pattern of the PID sensor used in this study, adopted from [12]. 14 2.7 A PIR sensor and its equivalent circuit, adopted from [3]. . . 15
2.8 IR filter spectral response, adopted from [3]. . . 15 2.9 An example drawing of PIR response to a moving body, adopted
from [2]. . . 16
2.10 A simple PID amplifier circuitry, adopted from [2]. . . 17 2.11 Frequency response of the amplifier circuit. . . 18
2.12 The output of the the first stage and second stage amplifier. . . . 18
2.13 Walking man at 2m distance to PIR sensor. The signal is sampled with 50Hz. . . 19
2.15 A simple PID comparator circuitry, adopted from [2]. . . 21
2.16 The second stage amplifier and comparator output for walking man at 2m. . . 22
2.17 The second stage amplifier and comparator output for background. 22 2.18 A simple PID comparator circuitry that can give the direction of motion, adopted from [2]. . . 23
2.19 A typical PID circuitry, adopted from [2]. . . 24
2.20 Typical third generation sensor circuitry. . . 25
3.1 PIR sensor output signals recorded at a distance of 2m for (a) a human being, and (b) a pet. . . 28
3.2 Three-state Markov models used to represent (a) ‘pet’ and (b) ‘human’ classes, respectively. . . 29
3.3 Background data and its wavelet transform in absolute value (high-frequency component of the filter bank). . . 30
3.4 Time gaps of a pet motion that can be mis-classified as background. 33 3.5 Time gaps of a human motion that can be mis-classified as back-ground. . . 33
4.1 Flame flicker spectrum distribution. . . 38
4.2 Background signal sampled with 50Hz. . . 38
4.3 Walking man at 5 m. . . 39
4.4 Flame at 5 m. . . 39 4.5 Shaking hands at 1 m. . . 40
4.6 Single sided amplitude spectrum for background and man walking at 5 m. . . 41 4.7 Single sided amplitude spectrum for flames at 5 m and shaking
hands at 1 m. . . 42
4.8 Absolute value of wavelet transform results for background and man walking at 5 m (high-frequency component of the filter bank). 43
4.9 Absolute value of wavelet transform results for flames at 5 m and shaking hands at 1 m (high-frequency component of the filter bank). 43 4.10 HMM models used for classifying fire and non-fire events. . . 45
4.11 A typical plot of the dissimilarity function D(T 1, T 2). It is multi-modal and non-differentiable. . . 47
4.12 The PIR sensor is encircled. The fire is close to die out completely. A man is also within the viewing range of the sensor. No false alarm is issued for this case. . . 49
5.1 Tangential (a) and radial motion (b) relative to a PIR sensor. . . 53
5.2 Background (a) and its wavelet transform (b). . . 54 5.3 Typical sampled sensor signals for all 6 event classes. . . 57
at 5m distance, (c) tangential run at 5m distance, (d) radial walk from 2m to 5m distance, (e) radial walk from 5m to 2m distance and (f) background signal. . . 58
List of Tables
3.1 The results with 108 Human, 120 pet, 120 background test se-quences. The system is connected to a PC and gives 0 for back-ground, 1 for detection of a pet and 2 for detection of a human within the viewing range of the PIR sensor. . . 32
4.1 Results with 198 fire, 588 non-fire test sequences. The system triggers an alarm when fire is detected within the viewing range of the PIR sensor. . . 49
5.1 Number of Gaussians Me of each GMM pe. . . 57
5.2 Classification performance and confused classes for various motion events. . . 58
Chapter 1
INTRODUCTION
A Pyroelectric Infrared (PIR) Sensor is a pyroelectric device that can sense in-frared (IR) radiation changes within its viewing range. In other words, these sensors are sensitive to moving objects radiating IR light. A PIR sensor creates temporary electric potential whenever a change of IR radiation occurs on the viewing range of the sensor, but the electric potential generated is very small in amplitude and must be amplified significantly. That is because PIR sensors can not be used alone, instead they become one of the key components of a passive infrared device (PID) with some other circuitry. The basic structure of a PID contains four main structures: A Fresnel lens, a PIR sensor, an amplifier cir-cuitry and a comparator plus time delayer circir-cuitry. Structural details are given in Chapter 2.
Fresnel lens focuses IR radiation on PIR sensor and PIR sensor measures the change in the IR rate and creates an electric potential difference corresponding to the variation in the IR radiation. However, this potential difference is very small and must be amplified without introducing noise. The amplifier circuitry aims to have a large gain for the sensor signal and surpress the ambient noise at the same time. So, generally a two stage bandpass amplifier is used. The amplified sensor signal is then compared with a threshold. If the signal stays
in the range determined by the threshold then it is assumed that no motion is observed, otherwise it is assumed that there is a moving target. This threshold based approach may generate false alarms. Therefore ordinary PIR sensors are simple and give an output of logical one when they detect a motion and a logical zero when there is no moving object within their viewing ranges.
The PIDs are low-cost, easy to use and widely available commercially. These practical features made them used in many indoor and outdoor applications in-cluding the security systems. However, as described above, simple PID structures may produce false alarms. For example, a PID located at the outside of a build-ing can produce alarms to pets, or even wind. So, high false alarm rates reduce their reliability. That is because in most security applications they are used as an assistant device of a surveillance system. Another type of application seen in the market is to use an array of sensors to create a sensor network structure [39, 40] and analyze the total data taken from each sensor. This increases the success and reliability of the system.
In order to increase false alarm immunity and add extra features, there exist some research articles and patents on PIDs in the literature [5]-[11]. Some of these patents deal with the hardware structure inside the PID [5, 8, 9, 11], and noise reduction [7]. These describe better PIDs compared to commertially avail-able ordinary ones. The new generation PIDs try to improve the basic structure of old ones by modifying the comparator circuitry. For example, patented auto-pulse signal processing and dual-edge processing systems are described in [4].
One of the major problems in the new generation PIDs is due to the analog hardware implementation of the algorithms. The analog hardware implementa-tions are not flexible to implement sophisticated algorithms or to switch from an algorithm to another to adapt to changing environmental parameters. So the current analog hardware based approach is not a good solution because of its limited nature.
CHAPTER 1. INTRODUCTION 3
the PID sensor circuitry with the aim of extracting a discrete-time signal. In-stead of directly using the output of a classical PIR sensor, an analog signal is extracted from the PIR output and it is sampled. As a result, intelligent signal processing algorithms can be developed using the discrete-time sensor signal. In this way, it is possible to develop human, pet, and flame detection methods. It is also possible to find the direction of moving objects and estimate their distance from the sensor. Furthermore, the path of a moving target can be estimated using a PIR sensor array.
In this thesis, we also focus on object and event classification using sampled PIR sensor signals. Pet, human and flame detections are comparatively investi-gated. Different human motion events are modeled and classified using Hidden Markov Models (HMM) and Conditional Gaussian Mixture Models (CGMMs). In the proposed approach wavelets or sub-band analysis are used in dynamic texture modeling. This leads to computationally effcient algorithms for texture feature analysis, because computing wavelet coefficients is an order-(N) type op-eration. So, in order to keep the computational cost low, FFT methods are not implemented. Instead, a stochastic method, Hidden Markov Model (HMM), is used to characterize different objects and Conditional Gaussian Mixture Mod-els (CGMMs) is used for different events characerization. The sampled data is wavelet transformed for feature extraction and then fed into HMMs for analysis. A decision is reached according to the Markov Model producing the highest prob-ability. Experimental results demonstrate the reliability of the proposed HMM based decision and event classification algorithm.
In Chapter 2, detailed information about the PIR sensors and PIDs are pro-vided. Also sensor structure used in this work and the modifications done on the structure is presented in that chapter. In Chapter 3, the pet and human detection method is decribed and false alarm immunity of the PIDs is analyzed. Markov Models characterizing human and pet behaviour use wavelet domain sig-nals instead of regular sensor signal to achieve robustness against sensor drift.
In Chapter 4, a flame detection method based on flame flicker behavior is devel-oped. HMM for flames are estimated and tested with different human motion and flame test data. In Chapter 5, five type human motion events are classi-fied using conditional Gaussian mixture models. These models are tested with different test data and the results are presented.
Chapter 2
Pyroelectric Infrared (PIR)
Sensors
A Pyroelectric Infrared (PIR) sensor is a device that can sense the infrared (IR) light within its viewing range. This sensor is a passive device that simply mea-sures the changes in the IR levels emitted by surrounding objects. Since this device is a passive measuring device it is also called “Passive Infrared” sensor. PIR will detect any object emitting IR radiation, heat or changes in the back-ground IR level. IR radiating objects include humans, animals, vehicles and wind. The sensor by itself has a short range of approximately 1m maximum [1] but using a lens that focuses the IR radiation on the sensor we can increase the sensing range to 30m [1]. Therefore the PIDs are more suitable for indoor applications or short range outdoor applications.
Since the sensor responds to the IR changes within its viewing range, it is generally used for motion detection. A PIR based motion detector (usually called PID, for Passive Infrared Detector) uses this PIR sensor with some additional electronics circuitry for detecting motion. A typical PID sensor gives a logical zero when there is no motion or to the background IR level, and gives a logical one when it detects a hot body motion. A PIR sensor becomes useful when it
is used in PID. In this thesis, both the PIR sensor and the PID will be studied, because of this reason.
The PID sensors are widely used especially in indoor and short range outdoor applications directly or as an assistance of a video camera, since they are very cheap, easy to use and widely available commercially. Besides, in some applica-tions, a PID sensor network is build in order to cover a large area or an entire building for monitoring purposes [40]. Although they are used widely in indoor and outdoor applications, their application areas are limited. Security systems, robotics, burglar alarms, visitor acknowledgement, light switch control and in-telligent toys, etc. are some of example applications.
As mentioned above, a classical PID sensor is sensitive to the IR radiation, so their response is affected by some factors like the ambient temperature, hu-midity, moving object’s speed, direction of motion, distance to the sensor and the moving object’s body itself. Since PID gives a logical one or a logical zero as its output, the amplitude of the response isn’t affected, but the duration and the frequency of the response change by these factors. The response of the sensor is weakened by the increasing temperature and humidity. As the humidity in the air increases, the IR radiation is absorbed and attenuated more. A good example is the increasing heat absorption of the atmosphere when the weather is cloudy. Also high humidity causes vapor on the surface of the sensor which recedes IR radiation captured by the sensor. When the ambient temperature becomes high, e.g. above 40 degrees, or very low, e.g. below zero, the sensitivity of the PIR decreases [3]. Also sudden temperature changes can create a moving object response, in other words a false alarm, and if this sudden temperature change situation continues, the sensor response can be unstable, e.g. output continuously switches between one and zero. This unstable condition can be ob-served especially in windy weathers. On the other hand, when the body of the moving object is big, or when the object gets close to the sensor, PIR responds faster and the duration of the response becomes longer. When the moving target
CHAPTER 2. PYROELECTRIC INFRARED (PIR) SENSORS 7
is too small or too far from the sensor, the sensor can ignore it or gives no re-sponse or gives a very short rere-sponse. In addition when the moving object emits more heat, a longer response will be given by the sensor. Moreover the direction of motion and speed of the moving object creates a different non-linear charac-teristic at the sensor’s response. As the speed of the moving object increases, the duration of the response decreases but when the object moves very slowly, there is a possibility for the sensor not to distinguish it from the background. Since the viewing range of the sensor is limited by approximately 140 degrees in azimuth and 125 degrees in elevation [3], the faster object spends less time in the viewing range and this causes shorter response duration. Moreover, the direction of the moving object gives different results. If we think of some basic movement directions such as, parallel to the sensor or towards the sensor and obtain the results, we get different type of responses. The parallel response is simply like increasing sinusoidal behavior at the beginning and then decreasing sinusoidal behavior but when we deal with a direction toward to the sensor we get a more complicated sinusoidal response.
Since a typical PID sensor only responds to the motion of any object that emits IR radiation, independent of the source of motion, it is hard to distinguish different objects from each other. That leads an increasing false alarm ratio be-cause instead of a real target like human, PID sensor can respond to different sources such as animals or even a wind. On the other hand, PID sensor basically gives a one for the motion and a zero for no-motion, so it becomes very hard for the user to understand the source of motion, in other words we cannot distin-guish different objects by looking at the output of the PID sensor. This limits the usage area of these sensors.
If we focus on these problems, we can see that in the commercial market some methods such as temperature compensation, auto pulse signal processing and some patents [4]-[11] were developed in order to increase the robustness and decrease the false alarm ratio. But these methods deal with just some current
problems that are observed for classical PIDs, not developing the current vision. In this theses, PID sensors will be analyzed in three categories: first, second and third generation. Briefly, the first generation sensors are very simple struc-tured sensors composed of a sensing stage, then an amplifier stage and finally a comparator stage. These type of sensors are not robust and precise compared to second and third generations. Second generation sensors have a similar structure to the first generation, but they have additional comparator stage for increased robustness and precision. The false alarm rate in the second generation is lower compared to that in the first generation. The third generation sensors, developed by us, have sensing and amplifying stages that are modified versions of those in the second generation. They also have a microcontroller with an ADC stage that converts the analog signals to digital instead of comparing with a defined threshold as seen in the first and second generations. This last stage implements signal processing on these samples. More detailed information is given in the Chapter 2, Chapter 3, Chapter 4.
In this work, the first study is to increase the information that a PID sensor gives so that a well developed signal processing can be implemented to distinguish different events. At this point a new approach for PIR sensor signal processing is developed. A classical second generation PID sensor is modified for extracting all possible information from the PID sensor. This work is also applicable for the first generation PID sensors and explained in detail in the third generation sensor part.
2.1
IR Radiation
Infrared (IR) radiation is a type of electromagnetic radiation. Infrared light has a longer wavelength than visible light. The infrared has a wavelength of 750 nm to 100 µm. The infrared radiation is invisible to humans but we can feel it as heat. Infrared region can further be divided into sub-regions as follows:
CHAPTER 2. PYROELECTRIC INFRARED (PIR) SENSORS 9
• Near Infrared (NIR): 750 nm to 1.5 µm.
• Short Wavelength Infrared (SWIR): 1.5 µm to 3 µm. • Mid Wavelength Infrared (MWIR): 3 µm to 8 µm. • Long Wavelength Infrared (LWIR): 8 µm to 15 µm. • Far Infrared (FIR): Longer than 15 µm.
The MWIR and LWIR is known as the thermal infrared. All objects emit what is known as black body radiation (thermal radiation). This is emitted from the surface of an object which is due to the its temperature. Human body at normal body temperature radiates IR approximately at wavelengths around 9.4 µm.
2.2
Pyroelectricity
Pyroelectricity (from the Greek pyr, fire, and electricity) is the ability of certain materials to generate a temporary electrical potential when they are heated or cooled. It is a migration of positive and negative charge to opposite ends of a crystal’s polar axis as a result of a change in temperature, and this causes an electrical polarization. This polarization change gives rise to a temporary electric potential, although this disappears after the dielectric relaxation time.
Pyroelectricity can be visualized as one side of a triangle, where each corner represents energy states in the crystal: kinetic, electrical and thermal energy. The side between kinetic and electrical corners represents the pyroelectric effect and produces no kinetic energy.
This effect is first observed in quartzs. If a crystal develops a positive charge on one face during heating, it will develop a negative charge on the same face during cooling. This ability of the crystals is used for detecting infrared radiation.
2.3
Theory of Operation
A typical PID (1st generation) is generally composed of four blocks shown in Figure 2.1. The first block is for optical focusing of the IR radiation onto the
Figure 2.1: A typical PID sensor block schema.
PIR sensor. For this purpose, Fresnel lenses are preferred since they have lower thickness. The second block is the sensing block. This block contains a PIR sensor for detecting the IR radiation. PIR sensors have IR filters mounted on them so that they respond to the optimal IR frequency range of interest. The third block is the amplifier stage, which amplifies the output signal of the PIR sensor. A typical amplifier block is composed of a two stage amplifier in which each stage has a gain of approximately 100. The last stage is the comparator stage that gives the output voltage of either 5V for logic one or 0V for logic zero. Beyond these blocks, second generation PID sensors have extra comparator circuitry for increasing the robustness of the sensor. For the third generation PID sensor we place an ADC and a microcontroller instead of a comparator block. These blocks and the first, second, third generation sensors are explained in detail in the next sections.
CHAPTER 2. PYROELECTRIC INFRARED (PIR) SENSORS 11
2.4
PID Sensor Module Configuration
As previously pointed, a typical PID sensor module is composed of four basic structures:
• A fresnel lens, • a PIR sensor,
• the amplifier circuitry and • the comparator circuitry.
2.4.1
Fresnel Lens
A Fresnel lens is a plano convex lens that has been collapsed on itself as in Figure 2.2 to form a flat lens that retains its optical characteristics but is much smaller in thickness and therefore has less absorption loss.
Figure 2.2: A plano convex lens and fresnel lens, adopted from [2].
The Fresnel lens is made of an infrared transmitting material that has an IR transmission range of 8 µm to 14 µm that is most sensitive to human body radiation. It is designed to have its grooves facing the IR sensing element so
that a smooth surface is presented to subject side of the lens which is usually the outside of an enclosure that houses the sensor [1].
The lens element is round with a diameter of 1 inch and has a flange that is 1.5 inches square. This flange is used for mounting the lens in a suitable frame or enclosure. Mounting can best and most easily be done with strips of scotch tape. Silicon rubber adhesive can also be used to form a more waterproof seal [1].
A typical Fresnel lens for the first generation PID sensor is FL65 [2]. FL65 has a focal length of 0.65 inches from the lens to the sensing element. It has been determined by experiment to have a field of view of approximately 10 degrees when used with a PIR325 PIR sensor. Figure 2.3 shows the lens geometry.
Figure 2.3: Typical fresnel lens dimensions, adopted from [2].
Another issue of a Fresnel lens is the pattern. The pattern affects the perfor-mance of the sensor directly. In order to increase the perforperfor-mance and coverage, different geometries are applied. An example can be seen in Figure 2.4.
CHAPTER 2. PYROELECTRIC INFRARED (PIR) SENSORS 13
Figure 2.4: An example pattern for D203S model PID, adopted from [3].
Different types of PID sensors have different patterns based on their usage. Some example patterns are shown in Figure 2.5.
Figure 2.5: Three types of PIDs and their patterns, adopted from [4].
In the second generation PID sensors coverage is increased, since our sensors are modified versions of the second generation PID sensors, we have the same
pattern shown in Figure 2.6.
Figure 2.6: The pattern of the PID sensor used in this study, adopted from [12].
2.4.2
PIR Sensors
PIR sensor is an electronic device that generates an electric charge when exposed to infrared radiation. As the name implies this sensor is made of pyroelectric materials such as crystals. When the amount of infrared radiation that is strik-ing to the crystal changes, the amount of charge also changes. This charge is sensed and converted to a voltage level via a FET transistor that is build inside the sensor. The sensor is sensitive over a wide spectrum. The sensor and the equivalent circuit is shown in Figure 2.7.
CHAPTER 2. PYROELECTRIC INFRARED (PIR) SENSORS 15
Figure 2.7: A PIR sensor and its equivalent circuit, adopted from [3].
In order to limit the sensitivity range of the sensor, there is an IR filter at the top. This filter is generally designed for a bandwidth of 5.5 µm to 15 µm. A typical spectral response of this filter is shown in Figure 2.8.
Figure 2.8: IR filter spectral response, adopted from [3].
Dual compensated sensing elements are applied to suppress the interference resulting from temperature variation. As a result, the operating stability of the sensor is greatly improved. In such a configuration, the PIR measurements cancel each other so that the average temperature of the field of view is removed from the electrical signal; an increase of IR energy across the entire sensor is
self-cancelling and will not trigger the device. This allows the device to resist false indications of change in the event of being exposed to flashes of light or field-wide illumination. (Continuous bright light could still saturate the sensor materials and render the sensor unable to register further information.) At the same time, this differential arrangement minimizes common-mode interference, allowing the device to resist triggering due to nearby electric fields. An example drawing for the PIR response to a moving body is shown in Figure 2.9
Figure 2.9: An example drawing of PIR response to a moving body, adopted from [2].
However, a differential pair of sensors cannot measure temperature in this configuration and therefore this configuration is specialized for motion detectors.
CHAPTER 2. PYROELECTRIC INFRARED (PIR) SENSORS 17
2.4.3
Amplifier Circuitry
Since PIR sensor’s output is very low, it should be well amplified. This part of a first generation PID sensor is a two stage amplifier in which each stage has a gain of approximately 100, corresponding to a total gain of 10000. Because there is a high gain, amplifiers with band-pass characteristics are used. An example of this two stage is shown in the red box of Figure 2.10.
Figure 2.10: A simple PID amplifier circuitry, adopted from [2].
As mentioned in the previous chapter, the output of a PIR sensor has a low frequency tendency around DC to 10Hz [2]. So the frequency response of the amplifier block tends to remove or reduce the high frequency components while amplifying the interested frequency band in the output signal of a PIR. The frequency response of the first and the second amplifier outputs are plotted below for the circuit shown in Figure 2.10.
Figure 2.11: Frequency response of the amplifier circuit.
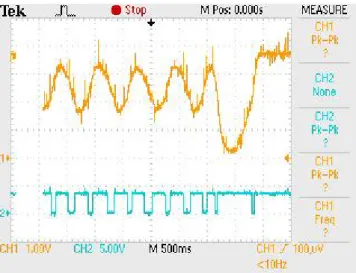
In Figure 2.12, the output of the first and second stages for a walking person is shown.
Figure 2.12: The output of the the first stage (shown in blue, CH2) and second stage (shown in orange, CH1) amplifier.
CHAPTER 2. PYROELECTRIC INFRARED (PIR) SENSORS 19
At the output of the amplifier block we have an analog signal. In order to get a meaningful output in the first and second generation sensors, this analog signal is compared with thresholds, but the third generation sensor just samples this analog signal instead of comparing with thresholds. So that after sampling, we move into digital domain instead of analog domain, and that leads us to im-plement signal processing.
Typical signals seen at the output of the amplifier block, when there is ob-served motion and a background or no-motion, are shown in Figures 2.13 and 2.14, respectively.
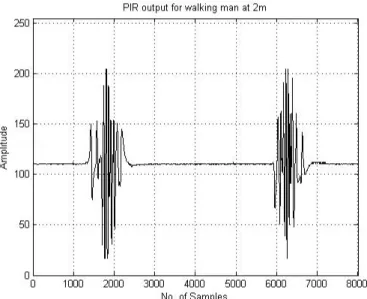
Figure 2.13: Walking man at 2m distance to PIR sensor. The signal is sampled with 50Hz.
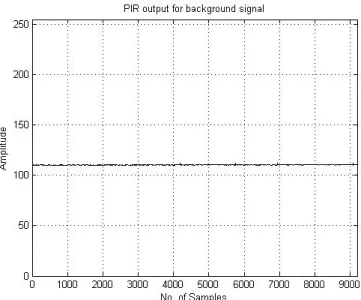
Figure 2.14: Background signal sampled with 50 Hz.
2.4.4
Comparator
As mentioned above the amplifier stage gives an amplified analog signal of PIR sensor output. In order to get meaningful information from PID this analog signal is compared with thresholds. If the signal stays between two threshold values then the signal belongs to ambient, and there is no motion. So the comparators give an output of 0V . On the other hand, if there is a motion the signal tends to have higher amplitude. This time, signal passes beyond the threshold values and one of the comparators give an output of 5V . This points that the sensor has detected a motion. The comparator circuitry of a first generation PID sensor is shown in the red box of Figure 2.15.
CHAPTER 2. PYROELECTRIC INFRARED (PIR) SENSORS 21
Figure 2.15: A simple PID comparator circuitry, adopted from [2].
Here the threshold values are chosen about ± 200mV around the half of supply voltage (Vcc) because when there is no-motion signal shows a DC behavior
that has amplitude of Vcc/2. But when there is a weak motion even far from the
sensor, the signal starts to behave like a sinusoid with an offset voltage of Vcc/2
and an amplitude depending on the source distance, source IR radiation quantity. So in order to capture even weak motions these threshold values are kept small enough. But this also increases the false alarm ratio. Comparator outputs can drive a delay circuit so that the PID can give a outputs with longer durations instead of giving short pulses. In Figure 2.16 and Figure 2.17, the output of the second stage amplifier and comparators are given for the motion and background cases, respectively.
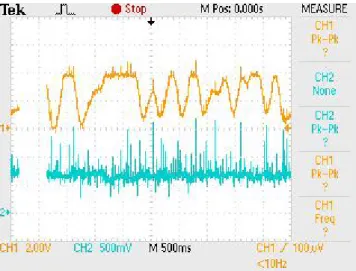
Figure 2.16: The second stage amplifier (shown in orange, CH1) and comparator (shown in blue, CH2) output for walking man at 2m.
Figure 2.17: The second stage amplifier (shown in orange, CH1) and comparator (shown in blue, CH2) output for background.
The direction of the motion can be detected due to the PIR sensor nature. Thus, a different configuration of the comparators can tell us the direction of the motion. A general configuration is shown in Figure 2.18.
CHAPTER 2. PYROELECTRIC INFRARED (PIR) SENSORS 23
Figure 2.18: A simple PID comparator circuitry that can give the direction of motion, adopted from [2].
Here the comparator outputs are separated so that if we have a positive edge we get 5V from the top comparator and 0V from the bottom comparator, and we get an opposite behavior for the negative edge.
In the second generation sensors, the comparator part is more complicated in order to decrease the false alarm ratio.
2.5
First Generation (Ordinary) Sensors
This is the most primitive PID type. This type of sensors have the highest false alarm ratios and cannot distinguish the moving targets. A typical configuration was shown in Figure 2.1 and an example circuit schema is presented in Figure 2.19.
Figure 2.19: A typical PID circuitry, adopted from [2].
2.6
Second Generation Sensors
The second generation sensors are the modified version of the first type. Except PIR sensor part, the rest of the PID is modified. Fresnel lens geometry is changed for higher sensitivity and wider range. The amplifier part is modified for low noise. The comparator part is ‘re-created’ and new extra circuitry is added in order to implement patented algorithms like auto pulse signal processing, temperature compensation. By these changes, the PID becomes more robust and the false alarm ratio is decreased. These PIDs can also distinguish moving targets like a human or an animal and responds accordingly.
2.7
Third Generation Sensors
Although the second generation sensors are developed versions of the first gen-eration, they have some absence in the false alarm ratios and their potential was
CHAPTER 2. PYROELECTRIC INFRARED (PIR) SENSORS 25
not used efficiently. In the second generation of PID, the analog signal of the amplifier is converted to pulses and the decisions are made according to these pulses. This is not very useful for applying different algorithms and limits the abilities that we can develop. Instead of creating pulses, in the third generation PIDs, an ADC conversion is implemented and a sampled version of the amplifiers analog output is obtained. In Figure 2.20 a typical diagram is shown.
Figure 2.20: Typical third generation sensor circuitry.
We sample the analog input and feed the data into a microcontroller based structure so that we can either implement algorithms in the microprocessor or bypass the data to a PC via serial communication. In this way, we can use dif-ferent techniques to analyze the sensor output and create models for difdif-ferent targets.
Another major problem for the second generation sensors is the saturation problem. When we have a strong IR source, the amplifiers get saturated. This distorts the output signals of the amplifiers and prevents us to characterize dif-ferent events in detail. The amplifier gain is adjusted so that a human walking at a distance of 1m in front of the sensor will not saturate the amplifiers.
Pet Detection
In this chapter, signals produced only by PIR sensor is analyzed to distinguish pet and human. Since a PID responds to the heat change in the ambient indepen-dent from the source, all of the IR radiating sources whether they are necessary or not, are detected and this causes too many useless information and increases false alarm ratios especially in safety and security applications. In order to de-crease the false alarm ratios, distinguishing the IR radiating sources, such as a human and pet, from each other becomes important.
Detection of a person in an unsupervised area is a practical problem with ap-plications in safety and security areas including supportive home environments. Intelligent homes will have the capability of monitoring activities of their occu-pants and automatically provide assistance to elderly people and young children using a multitude of sensors in the near future. A good example is given in [14]. On the other hand, computer vision-based systems may provide effective and complimentary solutions for motion detection and pattern recognition [15]. Al-though visual systems are highly successful for detection and recognition, cameras must be placed in several parts of the house including bathrooms. Even if the video data is neither stored nor sent to an outside center for further processing, many people may find such a practice disturbing. This solution is not a cost
CHAPTER 3. PET DETECTION 27
effective solution since we need lots of camera with an image processing unit. However, an intelligent PIR sensor can be a cost effective solution and since it is used everywhere people would not be iritated. So the problem becomes distinguishing different IR sources.
In this work, signals produced by PIR sensor are processed in the wavelet domain. It is experimentally observed that the wavelet transform domain signal processing provides better results than the time-domain signal processing be-cause wavelets capture sudden changes in the signal and ignore stationary parts of the signal. For our purposes, it is important to detect sudden changes rather than drifts or low frequency variations. Feature parameters are extracted from wavelet signals in fixed-length data windows and they are used in Hidden Markov Models (HMMs) which are trained according to possible human being and pet activities.
3.1
Data Processing
As indicated in Chapter 1, commercially available PIR sensors produce binary outputs; however, we capture a continuous amplitude analog signal indicating the strength of the received signal. The corresponding circuit is shown in Figure 2.10. The samples are taken from “OUT2” output point in Figure 2.10 and the sampling rate is 50Hz.
The strength of the received signal from a PIR sensor increases by the size of the IR radiating source within its viewing range. Also the distance of the source has an important role at the output signal amplitude and shape. The effects of these two factors can be easily observed at the output. Briefly, a bigger object moving at a certain distance creates higher amplitude at the output then a smaller one moving at the same distance. So the PIR signal amplitudes for a person expected to be higher than the amplitudes due to the motion of a pet as pets are smaller than human beings for a given distance. On the other hand,
Figure 3.1: PIR sensor output signals recorded at a distance of 2m for (a) a human being, and (b) a pet.
the amplitude decreases with increasing distance. So a simple amplitude-based classification is not enough for distinguishing, instead we should characterize dif-ferent source signals. A typical PIR sensor signal for a person and a pet is shown in Figure 3.1.
When we focus on other characteristics of a PIR signal, we observe that the frequency of the signal is also changing with the speed of the IR radiating source within its viewing range. This can be another distinguishing factor since pets move faster than the human beings. This can be observed in the sensor output signal, as shown in Figure 3.1.
There is a bias offset in the PIR sensor output signal, which changes accord-ing to the room temperature. Wavelet transform of the PIR signal removes this bias. Let x[n] be a sampled version of the signal coming out of a PIR sensor. Wavelet coefficients obtained from a single stage subband decomposition, w[k], corresponding to [12.5Hz, 25Hz], frequency information of the original sensor output signal x[n] are evaluated with the integer arithmetic high-pass filter, cor-responding to Lagrange wavelets [28] followed by decimation. The used highpass filter is the filter bank of a biorthogonal wavelet transform used in the analysis [28]. The lowpass filter has the transfer function
Hl(z) = 1 2+ 1 4(z −1+ z1) (3.1)
CHAPTER 3. PET DETECTION 29
and the corresponding highpass filter has the transfer function Hh(z) = 1 2 − 1 4(z −1 + z1). (3.2)
In this case, the wavelet transform coefficients, w[k], are directly used as a feature parameter in an HMM-based classification. Two triple state HMMs are used for classifying human, pet and background. In Figure 3.2 an example is shown.
Figure 3.2: Three-state Markov models used to represent (a) ‘pet’ and (b) ‘hu-man’ classes, respectively.
The wavelet results of the PIR sensor are analyzed in small windows that have a size of 50 sample and corresponds to 1sec. Every window is fed into HMM and classified as human, pet or background. If the wavelet of the output of the PIR sensor stays below a predefined threshold, i.e. Tp1, then this indicates
that the sensor stays in S0 state. If nth window stays in S0 state completely,
this means that there is no motion for the nth window. Tp1 is chosen according
to experimental results. When the wavelet of a background is analyzed, the coefficients tend to stay below 0.8 but when there is an observed motion, one
or more coefficients pass over this value. A background data and the wavelet transform is shown in Figure 3.3 .
Figure 3.3: Background data and its wavelet transform in absolute value (high-frequency component of the filter bank).
Next, we define a non-negative threshold Tp2in the wavelet domain. If there is
a motion for the nthwindow, at least one of the corresponding wavelet coefficients satisfies |w[k]| ≥ Tp1. If any wavelet coefficient satisfies Tp1 ≤ |w[k]| ≤ Tp2,
then we obtain state S1; otherwise, state S2, i.e. |w[k]| ≥ Tp2, is attained as
the current state. Wavelet signal captures the high frequency information in the signal. Therefore, we expect that there will be more transitions occurring between states due to the motion of a pet. Tp2is chosen as twice of the Tp1value,
because the motion of a pet has a small effect on PIR, so that choosing a bigger Tp2 value will decrease robustness for the frequency seperation. Especially when
CHAPTER 3. PET DETECTION 31
the human is far from the sensor, the effect is decreasing and has a close behavior of a pet in terms of amplitude. Therefore, frequency content becomes important. This is observed by increasing transitions between states in our HMM. Choosing a higher Tp2 value will cause loss of information in the state transitions.
For the training of the HMMs, the state transition probabilities for human being and pet models are estimated from 50 consecutive wavelet coefficients covering a time frame of one second. During the classification phase, a state history signal consisting of 50 consecutive wavelet coefficients is computed from the received sensor signal. This state sequence is fed to the human being and pet models in running windows. The model yielding highest probability is determined as the result of the analysis of PIR sensor data.
3.2
Experimental Results
In our experiments we record pet and human motions at a distance of 2 m − 5 m to the sensor. For pet sequences, a cat is moved in front of the sensor and we record the output signals. For the human sequences, we record walking and run-ning person sequences. The person within the viewing range of the PIR sensor walks or runs on a straight line which is tangent to the circle with a radius of 2 m − 5 m and the sensor being at the center. The HMM models for PIR sensor are trained with three two-minute-long recordings of background, walking signals of a single person and random activities of a pet. The results are shown in Table 3.1.
Table 3.1: The results with 108 Human, 120 pet, 120 background test sequences. The system is connected to a PC and gives 0 for background, 1 for detection of a pet and 2 for detection of a human within the viewing range of the PIR sensor.
Test Cases Number of Sequences Number of Pet Detection Number of Human Detection Number of Test Signals Classified as Background Human Test Sequences 108 0 83 25 Pet Test Sequences 120 110 0 10 Background Test Sequences 120 0 0 120
A total of 348 recordings containing human, pet and background activities are used for testing. We have no HMM corresponding to the background case and no background test sequences classified as a human or a pet. This is due to the non-continuous motion of the human and pet. As shown in Figures 3.4 and 3.5, there are some time gaps in the motion; thus, if the time gap is long enough, sensor adapts itself to this new ambient scenario and assumes it as background.
CHAPTER 3. PET DETECTION 33
Figure 3.4: Time gaps of a pet motion that can be mis-classified as background.
Figure 3.5: Time gaps of a human motion that can be mis-classified as back-ground.
Since these gaps are longer for human motion compared to the pet motion, we have more false alarms in human data classified as background. This is
also observed when a human stands in front of the PIR sensor without moving because when a constant IR radiating object moves, it creates a heat change in the ambient and the PIR responds to this change. When this object stays constant, the sensors respond as background temperature is changed and adapts itself to this new background. These false alarms are actually not important because the human or the pet is actually detected in spite of occasional false alarms.
3.3
Conclusion
In this chapter, a method for distinguishing a pet, a human inside an intelligent environment/building equipped with a PIR sensor is proposed. Wavelet based features are extracted from PIR sensor outputs and are fed to two HMMs for human and pet. Sensor recordings containing various human and pet motions are used for training the HMMs corresponding to human and pet models. Clas-sification is done by the results of the probabilities of each HMMs. This sensor can be used as an assistant to a camera based system or can be complementary to a multitude sensor system [14]. The proposed system can further be improved to handle false alarm sources like barking dogs, wind, slamming doors and so forth. This can be achieved by training models similar to ones defined in this chapter. It can also be used to increase the robustness of camera-based systems inside and outside of an intelligent building.
Chapter 4
Flame Detection
In this chapter, a flame detection system based on wavelet analysis of PIR sensor signals is described. Since PIR sensor is sensitive to IR radiation, PIR sensor re-sponds to flames as well as it does to any other moving hot object. The problem is to find some special characteristics that belong to flames for separating them from other objects and these must be robust enough to have a low false alarm ratio.
Conventional point smoke and fire detectors typically detect the presence of certain particles generated by smoke and fire by ionization or photometry. An important weakness of point detectors is that the smoke has to reach the sensor. This may take significant amount of time to produce an alarm and therefore it is not possible to use them in open spaces or large rooms. The main advantage of PIR based sensor system for fire detection over the conventional smoke detec-tors is the ability to monitor large rooms and spaces because they analyze the infrared light reflected from hot objects or fire flames to reach a decision. When we apply different algorithms on the same sensor it is possible to detect different events. So instead of using different type sensors, we can just use PIDs.
Moreover, there are also some disadvantages of the system over conventional smoke detectors. One of them occurs because of the complex layout of any room.
In order to get robust results, PIR sensor should directly see the flames. If the flame occurs behind a big object, the probability of detection decreases since the object masks the IR radiation. In addition, different PID sensors can give same characteristic signals for the same event but with different amplitudes. The reason is because of the differences of the structure. Even this, can be observed between same types of 2 PIDs. The algorithm should be calibrated for every sensor. Another disadvantage is the test case. We implement some tests for dif-ferent situations but more detailed tests should be applied for difdif-ferent ambient conditions with different situations in order to get more trustable and robust system.
It is reported that turbulent flames of an uncontrolled fire flicker with a fre-quency of around 10 Hz [16, 17]. Recently developed video based fire detection schemes also take advantage of this fact by detecting periodic high-frequency behavior in flame colored moving pixels [18] - [20]. Actually, instantaneous flame flicker frequency is not constant and it varies in time. As reported in [31] and [29], flame flicker behavior is a wide-band activity covering 1 Hz to 13 Hz. Therefore, a Markov model based modeling of flame flicker process produces more robust performance compared to frequency domain based methods. Markov models are extensively used in speech recognition systems and in computer vision applica-tions [21]-[24]. In [29], several experiments on the relaapplica-tionship between burner size and flame flicker frequency are presented. Recent research on pyro-IR based combustion monitoring includes [30] where monitoring system using an array of PIR detectors is realized.
A regular camera or typical IR flame sensors have a fire detection range of 30 meters. This is due to the fact that flicker in flames cannot be or sensed from longer distances. Therefore, PIR based systems provide a cost-effective solution to the fire detection problem in relatively large rooms as the unit cost of a camera based system or a regular IR sensor based system is in the order of one thousand dollars.
CHAPTER 4. FLAME DETECTION 37
We also used wavelet domain signal processing, which provides robustness against sensor signal drift due to temperature variations in the observed area. Regular temperature changes due to hot plates and radiators are slow variations compared to the moving objects and flames. Since wavelet sub-signals of a wave-form are high-pass and band-pass in nature they do not get affected by the slow variations.
Events are classified into two different classes in this approach. The first class represents fire events, on the other hand, the second class represents non-fire events. Since PIR sensor circuits are designed for detecting the movement of hot objects, we include regular human motion events such as walking or running in the non-fire event class.
The PIR sensor can be considered as a single-pixel camera without loss of generality. Therefore, the proposed PIR based fire detection algorithm is ob-tained methods developed in Chapter 2.
Data acquisition and the PIR systems are described in the next Section. The proposed algorithm and the experiments are presented in Sections 4.2 and 4.3, respectively.
4.1
Data Acquisition
In order to get the digital samples from PID, digital sampling structure described in the first Chapter is used. In addition, for capturing the flame flicker process the analog signal is sampled with a sampling frequency of fs = 50 Hz because
the highest flame flicker frequency is 13 Hz [17] and fs = 50 Hz is well above
2 × 13 Hz. In Figure 4.1, a frequency distribution plot corresponding to a flickering flame of an uncontrolled fire is shown. It is clear that the sampling frequency of 50 Hz is sufficient.
Typical sampled signal for no activity case using 8 bit quantization is shown in Figure 4.2.
Figure 4.1: Flame flicker spectrum distribution.
Figure 4.2: Background signal sampled with 50Hz.
Other typical received signals from a moving person, shaking hands and flick-ering fire are presented in Figures 4.3, 4.4 and 4.5.
CHAPTER 4. FLAME DETECTION 39
Figure 4.3: Walking man at 5 m.
Figure 4.5: Shaking hands at 1 m.
The strength of the received signal from a PIR sensor increases when there is motion due to a hot body within its viewing range. However, the motion may be due to human motion taking place in front of the sensors or flickering flame. As can be noticed from the figures, shaking hands and flame flicker have a close behaviour. In this chapter the PIR sensor data is used to distinguish the flame flicker from the motion of a human being like running or walking. Typically the PIR signal frequency of oscillation for a flickering flame is higher than that of PIR signals caused by a moving hot body. In order to keep the computational cost of the detection mechanism low, we decided to use Lagrange filters for obtaining the wavelet transform coefficients as features instead of using a direct frequency approach, such as FFT based methods. On the other hand in the next section it is shown that wavelet results are more distinguisable compared to fft results.
CHAPTER 4. FLAME DETECTION 41
4.2
Sensor Data Processing and HMMs
The PIR signals processed by using FFT methods, are shown in Figures 4.6 and 4.7.
Figure 4.6: Single sided amplitude spectrum for background and man walking at 5 m.
Figure 4.7: Single sided amplitude spectrum for flames at 5 m and shaking hands at 1 m.
And the corresponding results obtained by using wavelets (explained in detail in this section) are shown in Figures 4.8 and 4.9.
CHAPTER 4. FLAME DETECTION 43
Figure 4.8: Absolute value of wavelet transform results for background and man walking at 5 m (high-frequency component of the filter bank).
Figure 4.9: Absolute value of wavelet transform results for flames at 5 m and shaking hands at 1 m (high-frequency component of the filter bank).
As seen from the figures, the wavelet results have better characteristics for classification. Also the computational cost is lower when we use wavelets. The rest of this secion mentions about the methods used in this work.
There is a bias in the PIR sensor output signal which changes according to the room temperature. This variaton is very slow compared to normal events. Wavelet transform of the PIR signal removes this bias. Let x[n] be a sampled version of the signal coming out of a PIR sensor. Wavelet coefficients obtained af-ter a single stage subband decomposition, w[k], corresponding to [12.5Hz, 25Hz] frequency band information of the original sensor output signal x[n] are evaluated with an integer arithmetic high-pass filter corresponding to Lagrange wavelets [28] followed by decimation. The filter bank of a biorthogonal wavelet transform is used in the analysis. The lowpass filter has the transfer function:
Hl(z) = 1 2+ 1 4(z −1 + z1) (4.1)
and the corresponding high-pass filter has the transfer function
Hh(z) = 1 2 − 1 4(z −1+ z1). (4.2)
The term HMM is defined as “hidden-state” Markov model in Rabiner [24]. However, the term HMM is also used in a relaxed manner when several Markov models are used to classify events. The term “hidden” refers to the fact that the model producing the observed data is unknown. An HMM based classification is carried out for fire detection. Two three-state Markov models are used to represent fire and non-fire events (cf. Figure 4.10).
CHAPTER 4. FLAME DETECTION 45
Figure 4.10: HMM models used for classifying fire and non-fire events.
In these Markov models, state S1 corresponds to no activity within the view-ing range of the PIR sensor. The system remains in state S1 as long as there is not any significant activity, which means that the absolute value of the cur-rent wavelet coefficient, |w[k]|, is below a non-negative threshold T 1. A second threshold T 2 is also defined in wavelet domain which determines the state tran-sitions between S2 and S3. If T 1 < |w[k]| < T 2, then state S2 is attained. In case of |w[k]| > T 2, state S3 is acquired.
The first step of the HMM based analysis consists of dividing the wavelet co-efficient sequences in windows of 25 samples. For each window, a corresponding state transition sequence is determined. An example state transition sequence of size 5 may look like
C = (S2, S1, S3, S2, S1). (4.3)
Since the wavelet signal captures the high frequency information in the signal, we expect that there will be more transitions occurring between states when monitoring fire compared to human motion.
4.2.1
Threshold Estimation for State Transitions
The thresholds T 1 and T 2 in the wavelet domain determine the state transition probabilities for a given sensor signal. In the training step, the task is to find optimal values for T 1 and T 2. Given (T 1, T 2) and ground-truth fire and non-fire wavelet training sequences, it is possible to calculate the transition probabilities for each class. Let aij denote the transition probabilities for the ‘fire’ class and
bij denote the transition probabilities for the ‘non-fire’ class.
The decision about the class affiliation of a state transition sequence C of size L is done by calculating the two joint probabilities Pa(C) and Pb(C)
correspond-ing to fire and non-fire classes, respectively:
Pa(C) = Y i pa(Ci+1|Ci) = Y i aCi,Ci+1 (4.4) and Pb(C) = Y i pb(Ci+1|Ci) = Y i bCi,Ci+1 (4.5)
where pa(Ci+1|Ci) = aCi,Ci+1, and pb(Ci+1|Ci) =
Q
ibCi,Ci+1, and i = 1, ..., L .
In case of Pa(C) > ξPb(C), for ξ > 0, the class affiliation of state transition
sequence C will be declared as ‘fire’, otherwise it is declared as ‘non-fire’. In our implementation, we take ξ = 1 without loss of generality.
Given Na training sequences A1, ..., ANa from ‘fire’ class and Nb training
se-quences B1, ..., BNb from ‘non-fire’ class, the task of the training step is to find
the tuple (T 1, T 2) which maximizes the dissimilarity D = (Sa − Sb)2, where
Sa=PiPa(Bi) and Sb =PiPb(Ai).
This means that for each given tuple (T 1, T 2), there is a specific value of the dissimilarity D, so that D is a function of (T 1, T 2)
CHAPTER 4. FLAME DETECTION 47
Figure 4.11 shows a typical plot of the dissimilarity function D(T 1, T 2). It can be seen from this figure that the cost function D is multi-modal and and non-differentiable. Therefore, we solve this maximization problem using a Genetic Algorithm (GA) having the objective function D(T 1, T 2).
Figure 4.11: A typical plot of the dissimilarity function D(T 1, T 2). It is multi-modal and non-differentiable.
For the training of the HMMs, the state transition probabilities for human motion and flame are estimated from 250 consecutive wavelet coefficients cover-ing a time frame of 10 seconds.
During the classification phase a state history signal consisting of 50 con-secutive wavelet coefficients are computed from the received sensor signal. This state sequence is fed to fire and non-fire models in running windows. The model yielding highest probability is determined as the result of the analysis of PIR
sensor data.
For flame sequences, the transition probabilities aij’s should be high and close
to each other due to random nature of uncontrolled fire. On the other hand, tran-sition probabilities should be small in constant temperature moving bodies like a walking person because there is no change or little change in PIR signal values. Hence, we expect a higher probability for b00 than any other b value in the
non-fire model which corresponds to higher probability of being in S1. The state S2 provides hysteresis and it prevents sudden transitions from S1 to S3 or vice versa.
4.3
Experimental Results
The analog output signal is sampled with a sampling frequency of 50 Hz and quantized at 8 bits. Real-time analysis and classification methods are imple-mented with C++ running on a PC. Digitized output signal is fed to the PC via RS-232 serial port.
The detection range of a PIR sensor based system is 9meters but this is enough to cover most rooms with high ceilings. In our experiments we record fire and non-fire sequences at a distance of 5 m to the sensor. For fire sequences, we burn paper and alcohol, and record the output signals. For the non-fire se-quences, we record walking and running person sequences. The person within the viewing range of the PIR sensor walks or runs on a straight line which is tangent to the circle with a radius of 5 m and the sensor being at the center.
The training set consists of 90 fire and 90 non-fire recordings with durations varying between three to four seconds. The test set for fire class is 198 and that of non-fire set is 558. Our method successfully detects fire for 195 of the sequences in the fire test set. It does not trigger fire alarm for any of the sequences in the non-fire test set. This is presented in Table 4.3.
CHAPTER 4. FLAME DETECTION 49
Table 4.1: Results with 198 fire, 588 non-fire test sequences. The system triggers an alarm when fire is detected within the viewing range of the PIR sensor.
No. of Sequences No. of False Alarms No. of Alarms
Fire Test Sequences 198 3 195
Non-Fire Test Sequences 588 0 0
The false negative alarms, 3 out of 198 fire test sequences, are issued for the recordings where a man was also within the viewing range of the sensor along with a fire close to diminish inside a waste-bin. The test setting where false alarms are issued is presented in Figure 4.12.
Figure 4.12: The PIR sensor is encircled. The fire is close to die out completely. A man is also within the viewing range of the sensor. No false alarm is issued for this case.
4.4
Summary
A method for flame detection using PIR sensors is proposed. Analog signal from a PIR sensor is sampled with a sampling frequency of 50 Hz and quantized with 8 bits. Single level wavelet coefficients of the output signal are used as feature
vectors for flame detection.
PIR sensor output recordings containing various human movements and flames of paper and alcohol fire at a range of 5 m are used for training the HMMs corresponding to different events. Thresholds for defining the states of HMMs are estimated using an evolutionary algorithm, since the underlying cost function to be minimized has proved to be multi-modal and non-differentiable. Flame detection results of the proposed algorithm show that the single-pixel as-sumption for PIR sensor proves to be a correct one.
We show that low-cost PIR sensors that are commonly used as indoor and outdoor motion detectors, can be utilized as fire sensors when coupled with ap-propriate processing. The main advantage of a PIR based fire detection system over conventional particle sensors is its ability to detect the presence of fire from a distance that results in a faster response time.
Chapter 5
Human Motion Event Detection
Intelligent rooms with audio, video and low cost PIR sensors will have the capa-bility of monitoring activities of their occupants and automatically provide as-sistance to elderly people and young children using a multitude of sensors in the near future [23]. Other applications include surveillance, information retrieval, indexing and security monitoring. Examples for video based event detection ap-plications are described in [17, 18, 20, 24]. In [23], the motion of a suddenly falling person is distinguished using a multitude of sensors including PIR sen-sors. In [25], an array of PIR sensors is used to detect direction of motion and the number of people passing. In this chapter, an approach based on PIR sensor data for human action monitoring is proposed.
As mentioned, we remove the simple comparator part of the PID to gather the 1-D signal directly generated by the PIR sensor. Due to the fact that 3-D information is mapped to 1-3-D, the question arises whether it is possible to uniquely determine the class from the sensor data or whether there is too much ambiguity to do so. In the proposed approach, although there is ambiguity, it is possible to detect several different motion events successfully.
The proposed system uses the wavelet transform for feature extraction from the raw 1-D PIR signal. It is experimentally observed that the wavelet transform

![Figure 2.5: Three types of PIDs and their patterns, adopted from [4].](https://thumb-eu.123doks.com/thumbv2/9libnet/5979659.125282/29.892.174.845.671.962/figure-types-pids-patterns-adopted.webp)
![Figure 2.6: The pattern of the PID sensor used in this study, adopted from [12].](https://thumb-eu.123doks.com/thumbv2/9libnet/5979659.125282/30.892.321.629.214.548/figure-pattern-pid-sensor-used-study-adopted.webp)
![Figure 2.9: An example drawing of PIR response to a moving body, adopted from [2].](https://thumb-eu.123doks.com/thumbv2/9libnet/5979659.125282/32.892.218.734.396.896/figure-example-drawing-pir-response-moving-body-adopted.webp)
![Figure 2.10: A simple PID amplifier circuitry, adopted from [2].](https://thumb-eu.123doks.com/thumbv2/9libnet/5979659.125282/33.892.174.808.388.663/figure-simple-pid-amplifier-circuitry-adopted.webp)
![Figure 2.15: A simple PID comparator circuitry, adopted from [2].](https://thumb-eu.123doks.com/thumbv2/9libnet/5979659.125282/37.892.180.812.138.428/figure-simple-pid-comparator-circuitry-adopted.webp)