Perceptual asynchronies and the dual-channel
differential latency hypothesis
h u l u s i k a f a l ı g ¨
o n ¨
u l , s a u m i l s . p a t e l , h a l u k
o ˘
¨
g m e n ,
h a r o l d e . b e d e l l , a n d g o p a t h y p u r u s h o t h a m a n
Summary
The dual-channel differential latency hypothesis ( ¨O˘gmen et al. 2004) successfully accounts for many aspects of the flash-lag effect (FLE). Here we use the dual-channel differential latency hypothesis to explain an illusion of perceived line length that can be viewed as one component of an illusion reported by Cai and Schlag (2001a). In the phenomenon studied here, a flash is presented collinear with a moving line that is simultaneously changing in length. The moving line is perceived to be misaligned with the flash (the FLE) and the length of the moving line is perceived to differ from its physical length at the instant of the flash. We designate this phenomenon the Cai line-Length Effect (CLE). Our analysis treats a horizontally moving line that also changes its vertical length as composed of two simultaneous motion components: (1) horizontal motion, and (2) vertical expansion or contraction. We measured perceived position misalignment and length misperception in the CLE paradigm, as well as separately for stimuli with the individual motion components of the CLE, as a function of target luminance. Perceived position misalignment and length misperception varied similarly with target luminance, both in the CLE paradigm and when the individual motion components were tested separately. The misperception of stimulus position and length in the CLE reflects an additional processing delay that may be caused by an interaction between the motion components in two directions. We conclude that the dual-channel differential latency hypothesis can account for the perceived spatiotemporal misalignment of stimulus features defined by motion components in terms of the neural latencies involved in processing these motion components.
A moving object is perceived to be displaced spatially in the direction of motion with respect to the perceived position of a flashed object, even when the two objects are aligned physically on the retina. This illusion is usually called the flash-lag effect: FLE (for reviews see Krekelberg & Lappe 2001; Nijhawan 2002; ¨O˘gmen et al. 2004). However, because the perceived displacement can change from a lag to a lead when the detectability of the flashed and the moving objects is manipulated (Purushothaman et al. 1998; Patel et al. 2000; ¨O˘gmen et al. 2004), we suggest that the flash-misalignment effect (FME) is a more appropriate designation. This illusory phenomenon is important to understand because it bears upon the temporal fidelity of sensory processing as well as on the accuracy of visually guided behaviors, such as catching a moving object (Nijhawan 1994).
Space and Time in Perception and Action, eds. Romi Nijhawan and Beena Khurana. Published by Cambridge University Press.
c
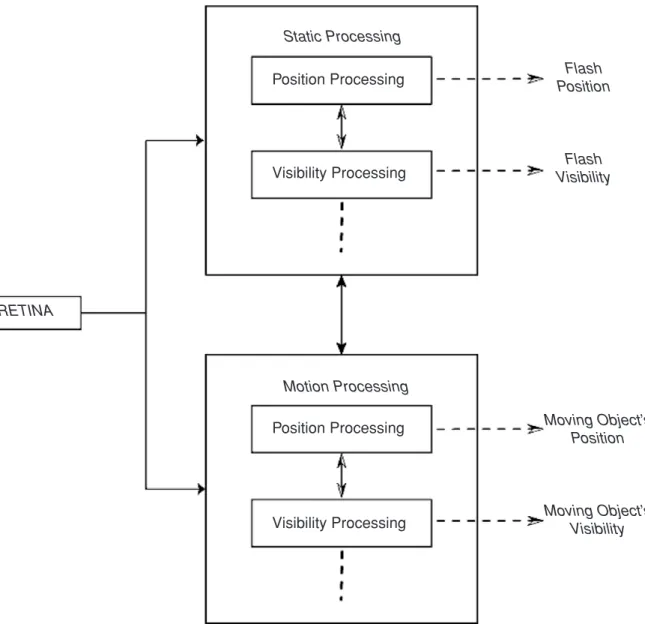
Static Processing Flash Position Flash Visibility Moving Object’s Position Moving Object’s Visibility Motion Processing RETINA Position Processing Visibility Processing Position Processing Visibility Processing
Fig. 22.1 The architecture of the dual-channel differential latency model. Static and moving stimuli are processed in different subsystems. Within each subsystem (or channel) various stimulus attributes (e.g., visibility and position) are processed by largely separate modules (adapted from ¨O˘gmen et al. 2004).
¨
O˘gmen et al. (2004) reviewed several proposed explanations for the FME. Here, we will focus primarily on the dual-channel differential latency hypothesis, which, in our opinion, provides the most parsimonious explanation of the FME. In this chapter, we seek to extend the dual-channel differential latency hypothesis to account for the perceptual outcome in stimulus conditions that include simultaneous motion components in two directions.
We begin by providing a brief description of the dual-channel differential latency hypoth-esis. The reader is referred to ¨O˘gmen et al. (2004) for a more comprehensive description. In our model, static and moving stimuli are processed in parallel by largely separate sub-systems (i.e., dual channels), termed the static and motion sub-systems, respectively. Moreover, within each system (or channel), the computations of stimulus position and stimulus visibil-ity are different processes with different temporal properties (Fig. 22.1). These subsystems also interact to ensure that a stimulus generally produces a coherent visual percept. The
time that signals from the retina take to reach the two subsystems may be different, in part because they could reside in separate anatomical areas in the brain. In addition, because the subsystems that process static and moving stimuli are likely to have different temporal properties, the resulting percepts may be delayed further by differing amounts. Similar concepts also have been applied to motion/color asynchrony phenomenon (Moutoussis & Zeki 1997; Bedell et al. 2003; Arnold 2005; Bedell et al. 2006).
In the present model, a flash-lag effect occurs if the perception of the flashed object is delayed relative to that of the moving object. The delay between the retinal stimulation and the percept that it generates consists of two components: (1) the accumulated propa-gation delays (Tp), and (2) the additional delays introduced by the subsystem’s processing dynamics (Td). Whereas Tp is largely independent of the temporal characteristics of the stimulus, Td is not. In other words, if we consider a stimulus in terms of its temporal frequency components, the effect of Tp is to introduce a phase shift in each component directly proportional to the component’s temporal frequency. On the other hand, Td reflects the interaction between the stimulus and the processing subsystem. If the subsystem is linear shift invariant, then processing can be viewed as the convolution of the stimulus with the system’s temporal impulse response function. For example, if the processing subsystem is a linear, shift-invariant, first-order, low-pass filter characterized by a single time constant (τ ), and the input to this system is a moving stimulus that can be described as a linear change in position over time (i.e., a ramp stimulus), then the steady state output of the system is a ramp that is delayed by exactly the time constant, τ . On the other hand, if the input is a sinusoidal stimulus of temporal frequency f, the steady state output of the same processing subsystem will have a phase shift of atan(2πf τ ) (the phase response of the system) corresponding to a delay of atan(2πf τ )/2πf that depends on f and τ . For a sinusoidal stimulus, the delay will be relatively constant for low temporal frequencies but will decrease and approach zero for high temporal frequencies. The model’s explanation for the FME that occurs with a continuously moving object is illustrated in Fig. 22.2.
In the example shown in Fig. 22.2, the moving object is assumed to have begun its motion sufficiently early so that the motion processing system (or channel) and hence the trajectory of the moving object’s perceived position has already reached steady state. In steady state, the total time, including the time needed to relay the retinal information to the position computation subsystem in the motion processing system and the time that the subsystem takes to compute the position, equals dm. Hence, the perceived position of the moving object is delayed by dm. Note that when the motion processing system is in steady state, the visibility computation subsystem does not interact with the position computation subsystem and hence is largely ignored in the present analysis for the perceived position of the moving object. The stationary flash is presented when it is physically collinear with the position of the moving object. In the dual-channel differential latency model, the stationary flash’s position and visibility are computed by a separate static processing system (or channel). First, we examine the visibility processing subsystem in the static processing system. The total time to relay the flash’s information from the retina to the visibility computation subsystem in the static processing system and the time that the subsystem
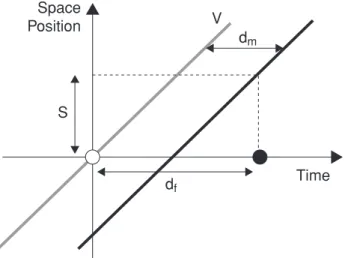
Space Position S Time df dm V
Fig. 22.2 Space–time diagram that explains the FME based on the dual-channel differential latency model. In this example, the moving object is assumed to have begun its motion sufficiently early such that the trajectory of its perceived position has reached steady state. The physical position of the moving object is represented by the oblique gray line. The perceived position of the moving object, which is delayed by dm, is represented by the black oblique line. The flash (unfilled circle) is presented
when it is physically collinear with the position of the moving object. If the flash is perceived after a delay of df (filled circle), the perceived position of the moving line is ahead of the perceived position
of the flash by a spatial displacement, s. The value of s is equal to v(df − dm), where v is the speed of
the moving object and (df − dm) is the differential latency between the perception of the flashed and
the moving object. Note that even though the visibility processing of the stationary flash is dynamic, the filled circle in the figure only shows the instant when the output crosses a critical signal-to-noise ratio for the first time.
takes to produce an output larger than a critical signal-to-noise ratio is equal to df. Hence, the flash is perceived after a delay of df. The position computation subsystem in the static processing system also operates in parallel to yield the perceived position of the stationary flashed object. For the analysis here, we assume that a steady state output of the position computation subsystem is available before the output of the visibility processing subsystem reaches the critical signal-to-noise ratio. In the example in Fig. 22.2, because df is greater than dm, the perceived position of the moving line is ahead of the perceived position of the flash by a spatial displacement, s. The value of s is equal to v(df − dm), where v is the speed of the moving object and (df − dm) is the differential latency between the perception of the flashed and the moving object. Note that in the dual-channel differential latency model the space–time characteristics of the perception of a stationary flashed and a moving object can be represented independently in space–time plots such as the one shown in Fig. 22.2. The reader is referred to ¨O˘gmen et al. (2004) for a comprehensive review of the transient dynamics of the motion processing system.
It is important to recognize that Fig. 22.2 is ambiguous in that one can view the perceived trajectory of the moving object as either temporally or spatially lagging the physical stimu-lus. To resolve this ambiguity, we examined the perceived position of the moving object from the onset of motion to the time when the perception of position reaches steady state ( ¨O˘gmen et al. 2004). The results indicate that the perceived position of the moving object lags the physical retinal stimulation temporally. This conclusion is consistent with the outcome of
other studies that introduced changes in the speed (Brenner & Smeets 2000) or direction of the moving object’s trajectory (Eagleman & Sejnowski 2000; Whitney et al. 2000).
Most of the studies that investigated FME used one stimulus that moved in a single linear or circumferential direction and another stimulus that was flashed. However, the dual-channel differential latency hypothesis can be extended to predict the outcome of experiments with stimuli that contain more complex motion components. Cai and colleagues (Cai et al. 2000; Cai & Schlag 2001a; Cai & Schlag 2001b; Cai & Cavanagh 2002; Cai 2003) introduced an experimental paradigm in which a moving target changed features such as length and color either smoothly or abruptly. In one of these experiments, the stimulus consisted of a moving line that gradually changed its length as it moved. In the middle of the motion trajectory, a brief flash was presented collinear with the moving line. As expected on the basis of the FME, the observer sees the moving line spatially ahead of the flash’s position at the instant (s)he perceives the flash. In addition, the observer perceives the length of the moving line to be longer than its physical length at the time the flash is presented. We will call this illusion the Cai line-Length Effect (CLE). Our analysis treats a horizontally moving line that also changes its vertical length as a combination of two simultaneous motion components: (1) horizontal motion, and (2) vertical expansion or contraction. It is important to note the distinction between a stimulus resulting in the CLE and a stimulus with circular motion. In both stimuli, assuming stimulus motion occurs in a frontoparallel plane, there are two linear (horizontal and vertical) components of motion. However, in the former case, the components of motion can be perceived separately in the frontoparallel plane and/or can be integrated into a single direction of depth toward or away from the frontoparallel plane, whereas in the latter case they are integrated into a single direction in the frontoparallel plane. In other words, the processing of the stimulus resulting in the CLE and a stimulus in circular motion is distinct and hence can take different amounts of time. We will visit this issue again toward the end of the chapter. Here, we consider how the CLE can be explained by the dual-channel differential latency hypothesis.
Consider a vertical line that starts moving rightward from a location in the left visual field at a speed of vh deg/sec. As the line moves its length increases at a rate of vv deg/sec. Both the rightward motion and the increase in line length stop when the line reaches a location in the right visual field. The observer fixates a position that is horizontally halfway between the starting and the ending positions of the line’s rightward motion trajectory and vertically just below the moving line. When the moving line is directly above the fixation point, a flash is presented just below the fixation point in physical horizontal alignment with the moving line. The predictions of the dual-channel differential latency hypothesis for this version of the CLE paradigm are illustrated in Fig. 22.3. These predictions are derived for one level of detectability of the moving line but can be generalized readily to other levels of detectability (see ¨O˘gmen et al. 2004 for modifications relating to detectability).
The time-varying aspects of the stimulus are decomposed into two components: (1) a component that corresponds to horizontal motion, and (2) a component that corresponds to vertical expansion (i.e., an increase in length). For simplicity, we assume for now that the rightward line motion and the vertical expanding motion are processed separately without interactions. Figure 22.3 only shows the steady state responses corresponding to these two
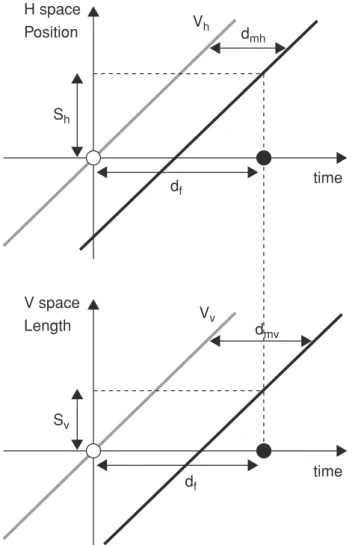
H space Position V space Length time time Sh Sv Vh Vv dmh dmv df df
Fig. 22.3 Space–time diagram illustrating the CLE. The top and bottom parts of this figure, which represent the simultaneous horizontal position and vertical length of the stimulus, respectively, are similar to Fig. 22.2. Note that for the bottom figure, the origin’s y-coordinate represents a nonzero length. For purposes of generalizability, the steady state latencies for the horizontal position and vertical length perception are dmhand dmvrespectively. When the flash is perceived (filled circle), the
perceived position of the moving object is shahead of the flash and the perceived length of the moving
object is svlonger than the physical line length at the instant of flash presentation. The values, shand sv, are equal to vh(df − dmh) and vv(df − dmv), respectively, where vh is the horizontal speed of the
moving line and vh is its rate of length change. In this illustration and in our experiments, vh and vv
are equal. The differential latencies between the perception of the flashed and the moving objects’ horizontal position and vertical length are (df − dmh) and (df − dmv), respectively.
types of stimulus motion. As seen in Fig. 22.3, each type of motion may be delayed by a different amount depending on the dynamics of the relevant processing mechanism. The following predictions can be derived for the perception of the moving stimulus at the instant that the flash becomes visible:
(1) When the flash is perceived, the horizontal position of the moving line will be misaligned, as expected from the FME. The sign and magnitude of the misalignment will depend on the relative delays involved in processing the horizontal position of the moving line and the detection of the flash.
(2) When the flash is perceived, the length of the moving line will be misperceived compared to its physical length at the time of flash presentation, as described by the CLE. The sign and magnitude of the misperception will depend on the relative delays involved in processing the vertical length of the changing line and the detection of the flash.
(3) Increasing the detectability of the moving stimulus should reduce its latency (Roufs 1974; Williams & Lit 1983) and should therefore cause the perceived position misalignment in the horizontal direction (the magnitude of the FME) to change in the direction of a greater position lead for the moving stimulus.
(4) Increasing the detectability of the moving stimulus should also cause the misperception of line length to change in the direction of a greater length lead.
(5) If the two types of motion are processed largely independently and the perceptual illusion related to each type of motion occurs due to differential processing latencies, then the effects of changing stimulus detectability in the CLE paradigm should be equivalent to the effects observed when the horizontal and vertical (length-change) components of line motion are examined separately.
We tested these predictions in a series of psychophysical experiments. Because the temporal response of the visual system depends on retinal eccentricity (McKee & Taylor 1984; Tyler 1985), in all of these experiments the retinal eccentricity, at which the critical information for the observers’ judgments occurred, was kept constant.
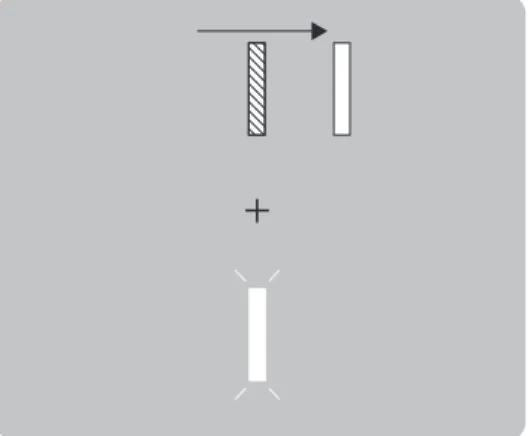
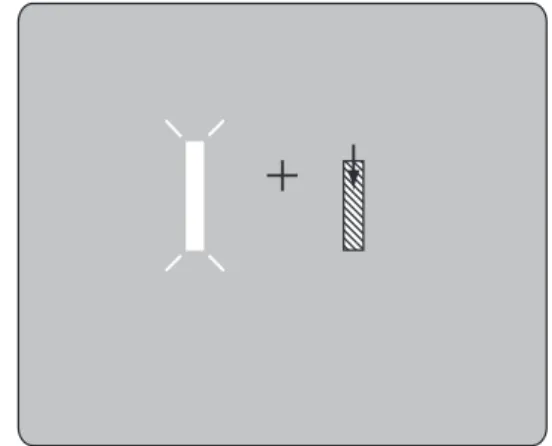
In our first experiment, we measured the spatial misalignment between a flashed bar and a line of fixed vertical length that moved in the horizontal direction. This experiment examined the horizontal motion component of the CLE. The stimulus configuration for this experiment is shown in Fig. 22.4.
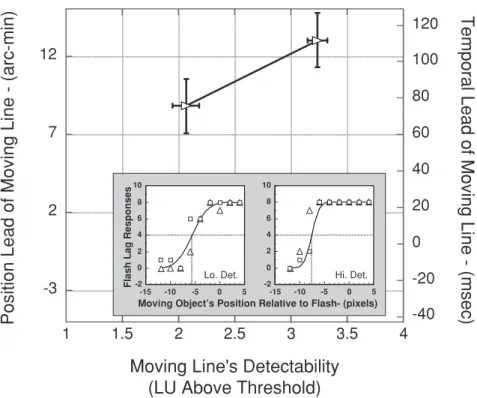
In separate runs, we measured the flash misalignment for a moving line that was on average 2.1 and 3.2 log units (LU, averaged across three observers, one of whom was naive) above its detection threshold. The results of this experiment are shown in Fig. 22.5. For both levels of detectability, the moving line was perceived to be ahead of the flash at the instant the flash was perceived, that is, a positive FME or a flash-lag effect was observed. Consistent with previous results (Purushothaman et al. 1998; Patel et al. 2000;
¨
O˘gmen et al. 2004), the perceived spatial position lead of the moving object increases with an increase in its detectability (F[1,6]= 38.7, p = 0.007). The rate of increase of position is about 30 msec per LU of the moving line’s detectability. We will use this rate in the following to compare the steady state dynamics of position processing for targets that move in the horizontal direction and that expand/contract in the vertical direction.
A repeated-measures analysis of variance (ANOVA) was performed to statistically eval-uate the results of this and subsequent experiments. The factors included in the ANOVA were luminance (two levels) and experiment (four levels). The outcome variable was the magnitude of the FME, in min arc. The main effects of luminance (F[1,2] = 85.9, p = 0.01) and experiment (F[3,6] = 18.3, p = 0.005) were significant, but their interaction was not (F[3,6]= 0.6, p = 0.65). Posthoc contrasts were used to compare specific pairs of conditions within and across the separate experiments (see the following). A second repeated-measures ANOVA using the same factors was performed to evaluate possible changes in the inverse slopes of the psychometric functions (outcome variable), specified
+
Fig. 22.4 Stimulus configuration for the first experiment. A vertical line (8.8× 88 min arc) moved horizontally along a trajectory that was 1 deg (from the center of the fixation target to the lower edge of the line) above a fixation cross (1.1 cd/sq-m) on a computer monitor (pixel size= 2.2 min arc) connected to a VSG-2/3 board. The background luminance of the screen was 1.9 cd/sq-m. The speed of the moving line was 1.9 deg/sec and the duration of motion was 1.3 sec (69 frames of 18.75 msec each). The direction of motion was chosen randomly for each trial. When the position of the moving line was in the vicinity of the fixation cross (textured rectangle above fixation cross), a vertical bar (white 8.8× 88 min arc rectangle below fixation cross) was flashed 1 deg (from the center of the fixation cross to the upper edge of the bar) below it. The duration of the flash was 18.75 msec. The luminance of the flash was 10.2 cd/sq-m and its detectability averaged across the three observers was 1.45 LU (± 0.30 SD) above its detection threshold. The viewing distance was 1 m. The time instant at which the flash was presented varied from trial to trial using the method of constant stimuli. The observers binocularly judged whether the position of the moving line was to the left or right of the flashed bar. A psychometric function was constructed from the collected data, and the 50% point on the curve corresponds to the point of subjective alignment (PSA). The physical misalignment occurring at the PSA was defined as the flash misalignment or, equivalently, as the misalignment in the position of the moving line. In the FME, at the time the observers perceive the flash, the moving line is perceived to be ahead of its physical location, as illustrated by the white rectangle above the fixation cross.
in min arc per 1 SD change in the percentage of responses. There was no effect of luminance (F[1,2]= 0.002, p = 0.97) or experiment (F[3,6] = 6.3, p = 0.09), and no evidence of a luminance by experiment interaction (F[3,6]= 0.09, p = 0.84).
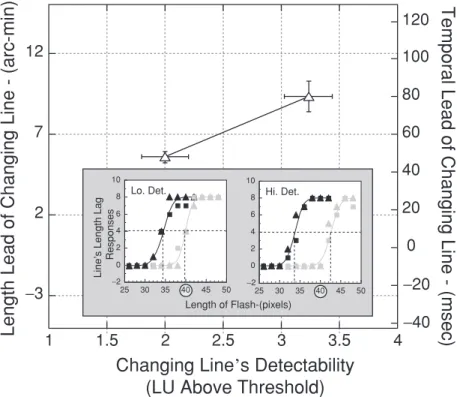
In our second experiment, we examined the vertical component of motion in the CLE, that is, the vertical change in line length. The stimuli for this experiment are shown in Fig. 22.6.
The perceived length at the time of the flash was measured for two levels of detectability of the expanding and contracting lines. To obtain a bias-free estimate, the data for the expanding- and contracting-line conditions were averaged. The average data for the same observers are shown in Fig. 22.7.
As in the first experiment, the perceived length of the line is ahead of its physical length at the instant the flash is perceived for both detectabilities of the changing line. These results indicate that an FME also occurs for the line-length component of the CLE.
In agreement with Experiment 1, the lead in the length of the changing line increases as the level of detectability increases (F[1,6]= 30.9, p = 0.009). The rate of increase in length
-3 2 7 12 -40 -20 0 20 40 60 80 100 120 1.5 1 2 2.5 3 3.5 4
Position Lead of Moving Line - (arc-min)
Temporal Lead of Moving Line - (msec)
Moving Line's Detectability (LU Above Threshold) -2 0 2 4 6 8 10 -15 -10 -5 0 5 -2 0 2 4 6 8 10 -15 -10 -5 0 5
Moving Object’s Position Relative to Flash- (pixels)
Flash Lag Responses Lo. Det. Hi. Det.
Fig. 22.5 The misalignment in the position of the moving line as a function of its detectability in Experiment 1. The left (right) ordinate represents the position misalignment in spatial (temporal) units. The temporal misalignment is obtained by dividing the spatial misalignment by the speed of the moving line. The luminance of the moving lines was 4.9 and 62.0 cd/sq-m in the low and high detectability conditions, respectively. The plotted data are also equivalent to the FME with positive numbers representing a flash-lag. The data shown are the average of three observers (one of whom was naive). In this and other figures, error bars represent the standard deviation across observers. Inset: The psychometric functions of the naive observer for two detectability conditions. The x-axis represents the position of the moving line relative to the position of the flash at the time of the presentation of the flash (-ve numbers represent a spatial lag for the moving line). The y-axis represents the number of times an observer responded that the flash spatially lagged the moving line. Each relative position is represented eight times in an experimental run. In this and subsequent figures, the data shown (squares and triangles) are from two experimental runs and the fitted curves represent cumulative Gaussian functions. The vertical dashed lines represent the position of the moving line at the time of the flash presentation that resulted in a perceived spatial alignment of the flash and the moving line. The inverse slopes (±SEM) of the psychometric functions averaged across observers for low and high detectability conditions are 2.30± 0.34 and 2.48 ± 0.68 pixels respectively. Note that in this and all other data plots, the sizes of the symbols are different only to make them legible when overlapping with each other, and slope values are given in pixel units.
lead is about 26 msec per LU change in detectability, which is similar to that obtained in Experiment 1 for the horizontal component of the CLE. However, in comparison to the results of Experiment 1 shown in Fig. 22.5, the data in Fig. 22.7 are shifted downward by approximately 30 msec (F[1,6]= 5.7, p = 0.1). This shift can be interpreted as a longer delay for processing the vertical expansion/contraction compared to the horizontal position of the changing or moving line. As indicated by the example psychometric functions in the inset to Fig. 22.7, there is also a substantial asymmetry in the FME for the line length of expanding and contracting lines. The direction of this asymmetry is consistent with that
Fig. 22.6 Stimulus conditions for Experiment 2. A stationary line (textured rectangle) that either expanded (left panel) or contracted smoothly in length (right panel) was presented 1 deg to the right (from the center of the fixation cross to the horizontal center of the line) of a fixation cross. The bottom of the changing line remained at a fixed position, 1.6 deg below the center of the fixation cross. When the upper edge of the expanding or contracting line was aligned with the center of the fixation cross, a bar (white rectangle) was flashed 1 deg to the left of the fixation cross. The length of the line when the flash occurred was 88 min arc. From trial to trial the length of the flashed bar was varied according to the method of constant stimuli. Because detectability of a flashed object affects the FME (Purushothaman et al. 1998; Patel et al. 2000; ¨O˘gmen et al. 2004), it is important to note that for the range of flash bar lengths used in this experiment, the detectability of the flashed bar changed negligibly (∼0.1 LU). The expanding and contracting line-length conditions were run in separate blocks of trials. The observer’s task was to judge whether the flashed bar was longer or shorter than the line that changed smoothly in length. The perceived length of the line at the time that the flash was perceived was defined as the 50% point on the psychometric function.
found in a recent study of the FLE in depth (Harris et al. 2006). However, in spite of the change in line length that occurred in Experiment 2, the observers did not report a strong perception of motion in depth.
In the third experiment, we measured the perceived misalignment of the horizontal position of the line in the CLE paradigm. If the processing of horizontal motion and vertical length change do not interact, then the perceived horizontal position misalignment of a line that simultaneously moves horizontally and changes length vertically (i.e., a changing line) should be identical to the perceived position misalignment for the moving line obtained in Experiment 1. In other words, the FME should not be affected by what happens to the length of the line. The stimulus used in this experiment is shown in Fig. 22.8, and the data are presented in Fig. 22.9.
Consistent with the results of Experiment 1, the line is perceived to be ahead of its physi-cal position at the instant the flash is perceived, that is, an FME is observed for the horizontal position of the line that simultaneously moves and changes length in the CLE paradigm. The position-lead of the changing line increases with an increase in its detectability (F[1,6] = 36.1, p = 0.007) at a rate of about 25 msec per LU of detectability. This rate of change of position-lead is similar to that observed in the first experiment. However, compared to the results of the first experiment shown in Fig. 22.2, the data in Fig. 22.9 are shifted down significantly, by an amount equal to approximately 60 msec (F(1,6) = 24.4,
−3 2 7 12 −40 −20 0 20 40 60 80 100 120 1 1.5 2 2.5 3 3.5 4
Length Lead of Changing Line - (arc-min)
Temporal Lead of Changing Line - (msec)
Changing Line’s Detectability (LU Above Threshold)
Length of Flash-(pixels) Line’ s L e ngth Lag Re s p on s e s −2 0 2 4 6 8 10 25 30 35 40 45 50 −2 0 2 4 6 8 10 25 30 35 40 45 50
Lo. Det. Hi. Det.
Fig. 22.7 The misperception in length of a line as function of the line’s detectability in Experiment 2. For an expanding (contracting) stimulus, the vertical axis represents the amount by which the perceived length of the line is longer (shorter) than the line length that was presented at the time the flash was presented. The data shown are the average of three observers (one of whom was naive). Inset: The psychometric functions of the naive observer for two detectability conditions. The x-axis represents the length of the flash. The physical length of the line at the time of the flash presentation was forty pixels (88 min arc). The y-axis represents the number of times an observer responded that the length of the line was shorter than that of the flash. Each flash’s length is represented eight times in an experimental run. The black (gray) symbols and curve correspond to the expanding (contracting) line condition. The vertical dashed lines represent the length of the flash that resulted in a perceived length match of the flash and the expanding/contracting line. The inverse slope (±SEM) of the psychometric functions averaged across observers for low and high detectability conditions of expanding (contracting) lines are 1.69± 0.23 (1.62 ± 0.15) and 1.76 ± 0.05 (1.43 ± 0.13) pixels respectively.
p = 0.03). We will discuss this 60 msec shift after we report the results of the fourth
experiment.
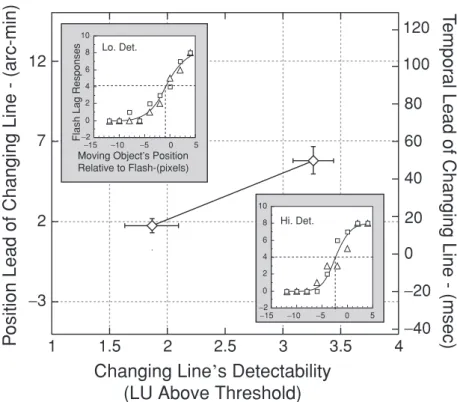
Finally, in our fourth experiment, we measured the CLE using the stimulus shown in Fig. 22.10. The data are shown in Fig. 22.11.
For the lower detectability of the line, its perceived length lags the physical length at the instant the flash is perceived. In other words, the misperception of line length in this condition is consistent with a flash-lead for the vertical component of motion in the CLE. As mentioned above, a flash-lead is encountered also in experiments similar to Experiment 1 when the delay in processing the flash becomes smaller than the delay to process the moving line (Purushothaman et al. 1998; Patel et al. 2000; ¨O˘gmen et al. 2004). Consis-tent with the data from our previous three experiments, the perceived length of the line shifts in the direction of a relative lead as the detectability of the changing line increases
Fig. 22.8 The stimulus configuration for Experiment 3. A line moved horizontally and also expanded in length smoothly above the fixation cross. The direction of motion was chosen randomly for each trial. When the moving/expanding line was in the vicinity of the fixation cross (textured rectangle), a bar was flashed below the fixation cross. The top of the changing line remained at a fixed position, 2.6 deg above the center of the fixation cross. The bottom of the changing line was approximately 1 deg above the fixation cross as in Experiment 1. The dimensions and eccentricity of the flashed bar were identical to those in Experiment 1. The horizontal speed of the moving line was identical to that in Experiment 1, and its rate of expansion was identical to that in Experiment 2. The experimental procedure, observer’s judgment, and data analysis were identical to those in Experiment 1. We only used the expanding-line condition for this experiment.
−3 2 7 12 −40 −20 0 20 40 60 80 100 120 1 1.5 2 2.5 3 3.5 4 P
osition Lead of Changing Line - (arc-min)
Te
mpor
al Lead of Changing Line - (msec)
Changing Line’s Detectability (LU Above Threshold) Moving Object’s Position
Relative to Flash-(pixels)
Flash Lag Respon
se s −2 0 2 4 6 8 10 −15 −10 −5 0 5 −2 0 2 4 6 8 10 −15 −10 −5 0 5 Lo. Det. Hi. Det.
Fig. 22.9 The perceived misalignment in the position of the changing line as a function of its detectability in the CLE paradigm, in Experiment 3. The inverse slope (±SEM) of the psychometric functions averaged across observers (n= 3) for low and high detectability conditions are 3.22 ± 0.31 and 3.27± 0.69 pixels respectively. Inset: The psychometric functions of the naive observer for two detectability conditions. The results are depicted using the same notation as in Experiment 1.
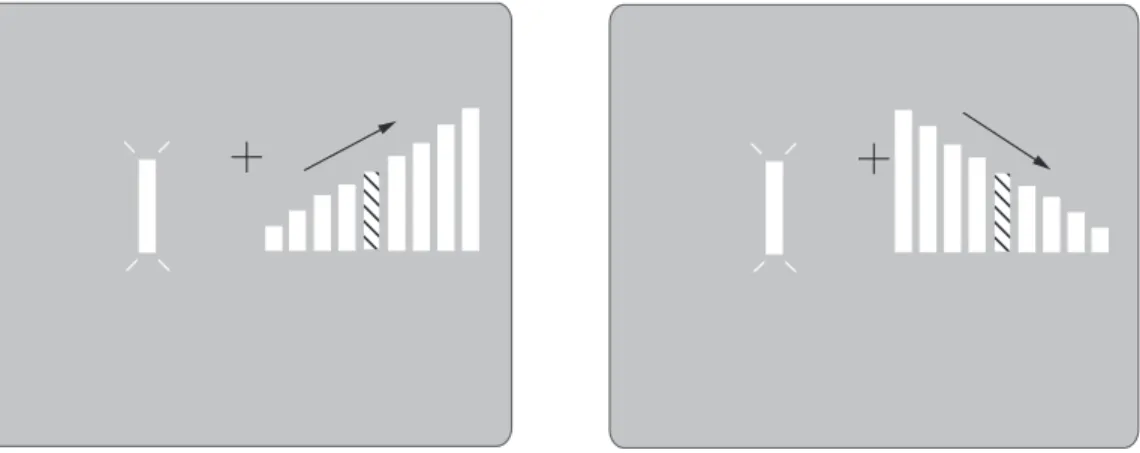
Fig. 22.10 Stimulus conditions in Experiment 4. A rightward moving line that either expanded (left panel) or contracted smoothly in length (right panel) was presented to the right (from the center of the fixation cross to the horizontal center of the line) of a fixation cross. The horizontal speed was identical to that in Experiments 1 and 3. The expansion/contraction rate was identical to that in Experiment 2. When the upper edge of the expanding or contracting line (textured rectangle on the right side of fixation) was approximately aligned with the center of the fixation cross, a bar was flashed 1 deg to the left of the fixation cross. The eccentricity of the flashed bar was identical to that in Experiments 1 through 3. The length of the expanding or contracting line when the flash occurred was 88 min arc. The procedure, observer’s judgment, and data analysis were identical to those in Experiment 2. Expanding and contracting line conditions were run in separate blocks of trials. Because a previous study (Kanai et al. 2004) indicated that there is a significant difference between the flash-lag values of foveo–petal and foveo–fugal conditions, only one direction of motion (foveo–fugal) was used in this experiment.
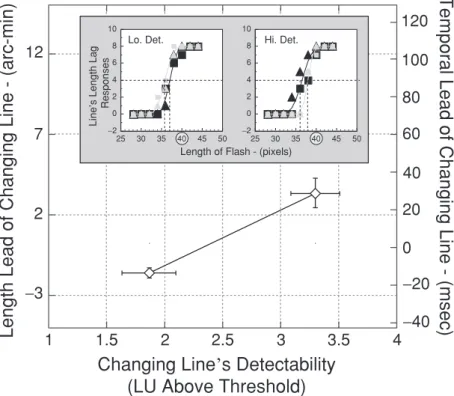
(F[1,6] = 53.8, p = 0.004). The rate of increase in length-lead is about 30 msec per LU change in detectability. This rate of change in length-lead as a function of the line’s detectability in the CLE paradigm is similar to that in Experiment 2. However, the data in Fig. 22.11 are also shifted down relative to those in Fig. 22.7 by approximately 55 msec (F[1,6]= 20.8, p = 0.03). This downward shift in the CLE data can be attributed to an additional delay in processing, presumably because of the simultaneous presence of motion components in the vertical and horizontal directions. A comparison of the results from Experiments 3 and 4 indicates that the additional delay when more than one motion component is present is similar for the perceived length of the vertically expanding or contracting line (∼55 msec) and for its perceived horizontal position (∼60 msec). As indi-cated by the example of psychometric functions in the inset to Fig. 22.11, there is a slight asymmetry in the FME for the expanding and contracting line-length components of the CLE, but it is greatly reduced from that observed in Experiment 2.
Although the effect of changing the detectability of the stimulus is consistent with our previous results and the predictions of the dual-channel differential latency hypothesis, our data indicate a substantial decrease in FME when more than one component of motion is present in the stimulus simultaneously. This outcome indicates that our initial treatment of vertical expansion/contraction and horizontal motion processing as noninteractive was an oversimplification. Within the framework of the dual-channel differential latency hypothe-sis, an additional processing delay is introduced when vertical expansion/contraction and
−3 2 7 12 −40 −20 0 20 40 60 80 100 120 1 1.5 2 2.5 3 3.5 4
Length Lead of Changing Line - (arc-min)
Temporal Lead of Changing Line - (msec)
Changing Line’s Detectability (LU Above Threshold)
Length of Flash - (pixels)
Line’ s Length Lag Responses −2 0 2 4 6 8 10 25 30 35 40 45 50 −2 0 2 4 6 8 10 25 30 35 40 45 50
Lo. Det. Hi. Det.
Fig. 22.11 The misperception of line length in the CLE paradigm as a function of the detectability of the line, in Experiment 4. The inverse slope (±SEM) of the psychometric functions averaged across observers (n= 3) for low and high detectability conditions of expanding (contracting) lines are 2.37± 0.68 (1.69 ± 0.17) and 2.02 ± 0.52 (1.78 ± 0.06) pixels, respectively. Inset: The psychometric functions of the naive observer for two detectability conditions. The results are depicted using the same notation as in Experiment 2.
horizontal motion components are simultaneously present (for a detailed explanation see Fig. 22.12). Moreover, the asymmetry in the magnitude of perceived length for expan-sion and contraction conditions (Figs. 22.7 and 22.11) implies that figural changes such as expansion/contraction coupled with motion may induce additional processes related to form–motion interactions. Previously, Regan and Beverley (1978) showed that distinct, independently adaptable motion mechanisms process looming and zooming stimuli that are perceived to move toward or away from the observer, as compared to stimuli that only translate in a frontoparallel plane. Although a detailed analysis of this additional processing delay is beyond the scope of this chapter, some speculation about mechanisms is never-theless possible. Motion integration is a process whereby local motion signals belonging to an object are combined to determine the global motion characteristics of that object (e.g., Adelson & Movshon 1982; Grzywacz & Yuille 1991; Laurenceau & Shiffrar 1992; Mingolla et al. 1992; Wallach 1995; Pack et al. 2001). In general, local motion components of an object suffer from the “aperture problem,” that is, they only can provide ambiguous information about the object’s movement direction (Fennema & Thompson 1979; Marr & Ullman 1981). But line ends and terminators of the object typically signal the veridical object direction. Thus, in the stimuli shown in Figs. 22.4 and 22.6 as well as in rigidly translating or rotating lines of fixed length, the direction of the line ends unambiguously signal the direction of motion in the scene. But in the CLE stimulus (Fig. 22.8), the line end
1-D Horizontal Motion (Exp. 1)
1-D Vertical Motion (Exp. 2)
2-D Motion Stimulus (Exp. 3)
2-D Motion Stimulus (Exp. 4) Hspace Position Hspace Position Vspace Length Vspace Length time time time time Vh Ph Pl Ph Lh Ll Pl Lh Ll
Dhigh Dlow Vh Dhigh Dlow
Vv Dhigh Dlow
Vv Dhigh Dlow
Fig. 22.12 Qualitative explanation of the results of Experiments 1–4, based on the dual-channel differential latency hypothesis. In all panels, the motion of the stimulus is represented by the oblique gray line. vh and vv represent the speed of the stimulus in the horizontal and vertical directions,
respectively. The trajectories of perceived stimulus position are represented by the thin and thick oblique black lines, which signify low and high levels of stimulus detectability, respectively. The unfilled and filled circles represent the physical and perceived times of the flashed target, respectively.
Pl and Ph represent the perceived horizontal position misalignment for low and high detectability
stimuli, and Ll and Lh represent the misperception of length for low and high detectability stimuli.
signals a diagonal direction different from the horizontal direction in which the bar moves. It is possible that the additional processing delay may be the result of increased complexity in computing the global object direction from the three ambiguous local motion signals while maintaining separate perceptual identities for each component. Our data show that this additional delay is between 55 and 60 msec.
The explanation of the CLE based on the dual-channel differential latency hypothesis demonstrates that the parallel and distributed nature of neural processing may cause spatial features that are defined by motion signals to be misperceived. Although other explanations for CLE are possible, the dual-channel differential latency hypothesis provides a parsi-monious explanation for the flash-lag effect (e.g., Nijhawan 1994), the Hess and Pulfrich effects (Williams & Lit 1983), motion/color asynchrony phenomena (e.g., Moutoussis &
Zeki 1997; Arnold et al. 2001; Nishida & Johnston 2002; Bedell et al. 2003; Arnold 2005; Bedell et al. 2006) as well as the CLE (Cai & Schlag 2001). The results presented here add to the overwhelming evidence for a lack of compensation of temporal asynchronies that arise in various parts of the neuronal pathways leading to perception. Consistent with previous suggestions (Purushothaman et al. 1998; Kerzel & Gegenfurtner 2003), the results presented in this chapter reinforce the need for visually guided behavior to rely less on predictive perceptual processing and more on predictive sensorimotor processing. In terms of the example of catching a moving ball, the brain is likely to compensate for the delay in the visual information by moving the arm to a predicted future spatial location.
Acknowledgments
This work was supported by R01 EY05068, R01 MH49892, and R01 EY12810.
References
Adelson, E. H., & Movshon, J. A. (1982). Phenomenal coherence of moving visual pattern. Nature 300: 523–525.
Arnold, D. (2005). Perceptual pairing of colour and motion. Vision Res 45: 3015–3026. Arnold, D. H., Clifford, C. W., & Wenderoth, P. (2001). Asynchronous processing in
vision: color leads motion. Curr Biol 11: 596–600.
Bedell, H. E., Chung, S. T. L., ¨O˘gmen, H., & Patel, S. S. (2003). Color and motion: which is the tortoise and which is the hare? Vision Res 43: 2403–2412.
Bedell, H. E., Patel, S. S., Chung, S. T. L., & ¨O˘gmen, H. (2006). Perceptual consequences of timing differences within parallel feature-processing systems in human vision. In H. ¨O˘gmen & B. G. Breitmeyer (eds.), The First Half Second: The Microgenesis and
Temporal Dynamics of Unconscious and Conscious Visual Processes (245–258).
Cambridge, MA: MIT Press.
Brenner, E., & Smeets, J. B. J. (2000). Motion extrapolation is not responsible for the flash-lag effect. Vision Res 40: 1645–1648.
Cai, R. H. (2003). The Fr¨ohlich effect is not due to a failure to perceive the beginning portion of motion trajectory J Vis 3: 485a.
Cai, R. H., & Cavanagh, P. (2002). Motion interpolation of a unique feature into stimulus gaps and blind spots. J Vis 2: 30a.
Cai, R. H., & Schlag, J. (2001a). A new form of illusory conjunction between color and shape. J Vis 1: 127a.
Cai, R. H., & Schlag, J. (2001b). Asynchronous feature binding and the flash-lag illusion.
Invest Ophthalmol Vis Sci 42: S711.
Cai, R. H., Schlag-Rey, M., & Schlag, J. (2000). Displacement of the moving bar exists in the flash-lag effect. Society for Neuroscience Abstract 561: 1.
Eagleman, D. M., & Sejnowski, T. J. (2000). Motion integration and postdiction in visual awareness. Science 287: 2036–2038.
Fennema, C. L., & Thompson, W. B. (1979). Velocity determination in scenes containing several moving objects. Computer Graphics and Image Processing 9: 301–315. Grzywacz, N., & Yuille, A. (1991). Theories for the visual perception of local velocity
and coherent motion. In J. Landy & J. Movshon (eds.), Computational Models of
Harris, L. R., Duke, P. A., & Kopinska, A. (2006). Flash lag in depth. Vision Res 46: 2735–2742.
Kanai, R., Sheth, B. R., & Shimojo, S. (2004). Stopping the motion and sleuthing the flash-lag effect: spatial uncertainty is the key to perceptual mislocalization. Vision
Res 44: 2109–2128.
Kerzel, D., & Gegenfurtner, K. R. (2003). Neuronal processing delays are compensated in the sensorimotor branch of the visual system. Curr Biol 13: 1975–1978.
Krekelberg, B., & Lappe, M. (2001). Neuronal latencies and the position of moving objects. Trends Neurosci 24: 335–339.
Laurenceau, J., & Shiffrar, M. (1992). The influence of terminators on motion integration across space. Vision Res 32: 263–273.
Marr, D., & Ullman, S. (1981). Directional selectivity and its use in early visual processing. Proc R Soc Lond B Biol Sci 211: 151–180.
McKee, S. P., & Taylor, D. G. (1984). Discrimination of time: comparison of foveal and peripheral sensitivity. J Opt Soc Am A 1: 620–627.
Mingolla, E., Todd, J. T., & Norman, J. F. (1992). The perception of globally coherent motion. Vision Res 32: 1015–1031.
Moutoussis, K., & Zeki, S. A. (1997). Direct demonstration of perceptual asynchrony in vision. Proc R Soc Lond B Biol Sci 264: 393–399.
Nijhawan, R. (1994). Motion extrapolation in catching. Nature 370: 256–257.
Nijhawan, R. (2002). Neural delays, visual motion and the flash-lag effect. Trends Cogn
Sci 6: 387–393.
¨
O˘gmen, H., Patel, S. S., Bedell, H. E., & Camuz, K. (2004). Differential latencies and the dynamics of the position-computation process for moving targets, assessed with the flash-lag effect. Vision Res 44: 2109–2128.
Pack, C. C., Berezovskii, V. K., & Born, R. T. (2001). Dynamic properties of neurons in cortical area MT in alert and anaesthetized macaque monkeys. Nature 414: 905–908. Patel, S. S., ¨O˘gmen, H., Bedell, H. E., & Sampath, V. (2000). Flash-lag effect: differential
latency, not postdiction. Science 290: 1051a.
Purushothaman, G., Patel, S. S., Bedell, H. E., & ¨O˘gmen, H. (1998). Moving ahead through differential latency. Nature 396: 424.
Regan, D., & Beverley, K. I. (1978). Looming detectors in human visual pathway. Vision
Res 18: 415–421.
Roufs, J. A. (1974). Dynamic properties of vision – V. Vision Res 14: 853–869.
Tyler, C. W. (1985). Analysis of visual modulation sensitivity. II. Peripheral retina and the role of photoreceptor dimensions. J Opt Soc Am A 2: 393–398.
Wallach, H. (1995). ¨Uber Visuell Wahrgenommene Bewegungrichtung. Psychologische
Forschung 20: 325–380.
Whitney, D., Murakami, I., & Cavanagh, P. (2000). Illusory spatial offset of a flash relative to a moving stimulus is caused by differential latencies for moving and flashed stimuli. Vision Res 40: 137–149.
Williams, J. M., & Lit, A. (1983). A luminance-dependent visual latency for the Hess effect, the Pulfrich effect, and simple reaction time. Vision Res 23: 171–179.