Sensitive Surface States and their Passivation Mechanism in CdS
Quantum Dots
Sesha Vempati,*
,†Yelda Ertas,
†,‡and Tamer Uyar*
,†,‡†UNAM-National Nanotechnology Research Center, Bilkent University, Ankara, 06800, Turkey ‡Institute of Materials Science & Nanotechnology, Bilkent University, Ankara, 06800, Turkey
*
S Supporting InformationABSTRACT: We report on phase sensitive surface states of CdS quantum dots (QDs), where it is noticed that a simple phase change from dispersion to solid has shown significant influence on the emission spectrum. As the solvent evaporates from the dispersion, apparently yellow dispersion transforms into a white light emitter because of the conformal changes in the polymer that surrounds the QDs. In turn, these changes catalyze the emission from three specific wavelengths in the blue region of the spectrum, shifting the surface defects closer to the conduction band of CdS. In the phase change from
dispersion to solid, flexible and dangling polymer chains are transformed into rigid moieties that can be treated as a modified chemical environment. Furthermore, to ascertain the origin of the new emission lines, we have studied a dipole interaction-based passivation mechanism between QDs and the polymer. The proposed mechanism may be valuable for designing future QD-based fluorophores and explains the sensitivity of the surface states in the case of CdS.
I. INTRODUCTION
An approaching energy crisis and increasing environmental pollution have motivated researchers to produce green, renewable energy to meet the challenges of the situation. However, making the best use of available energy is equally important; in this context, white-light-emitting diodes are proving to have a great potential in terms of energy consumption and the light output. Various attempts1−10 have been put forward to convert UV light into visible white light, where the UV sources are coated with fluorophores. The optical properties of the materials, e.g., defect bands,9quantum confinement-induced new radiative decay states within the band gap,1,3,4 etc, should be thoroughly explored for such applications. Although notable studies have already appeared, the never ending demand and quest for easier and efficient processing emphasize the real need to develop a new class of materials. Apart from the aforementioned studies and related materials, the binary metal sulfide, CdS, with a direct band gap of∼2.5 eV11has attracted a lot of attention,12−14especially in zero dimensions after Rossetti et al15 in which a dominating quantum confinement effect is noticed. The quantum effect and consequent properties come at the price of surface defects.16−18 This is typical for quantum dots (QDs), which generally establish nonradiative decay channels within the band gap, and is the case with CdS. However, one can minimize the defect density by employing other inorganic (core−shell type)13,14,19 or organic materials. In the context of organic materials, CdS is known for a list of surface passivations such as fatty acids and alkylamines,20,21 thiosalicylic acid,22 poly (vinyl pyrrolidone) (PVP),23block-copolymer,241, 4- dithiothreitol,25etc. On the
other hand, the capping agent that surrounds the QDs influences the optical properties significantly21,26−28and offers tunability.29It should be noted that the binding energy does not control the dynamics of carrier recombination; the key factor is the net charge transfer between the CdS and the organic molecule.21This is the case where alkylamines bind to CdS more strongly than oleic acid. However, the latter has shown profound influence in suppressing nonradiative recombination, giving rise to a better photoluminescence (PL).21 In any case, the principle is to trap the electron or hole on the capping agent, which disables the recombination path.22
Quenching the defect density (trap states) with inorganic materials is trivial, as demonstrated in several works in the literature;20−25 however, converting them into radiative channels with polymeric materials is rather intriguing. We report an important observation regarding this conversion. We noticed significant changes in the emission properties upon the phase change, i.e, when the dispersion has been just transformed to a solid. This is due to a transformation of nonradiative channels into radiative channels. Also, the material under investigation should possess a high density of surface defects, which enables a clear distinction in the emission spectrum. To produce such CdS QDs, we have adopted room-temperature synthesis along with amphipathic natured PVP, which binds through dipole type interactions, making it a wise
Received: August 15, 2013
Revised: September 11, 2013
Published: September 13, 2013
choice as a capping agent. Notably though, until now the polymer shell-based QDs which have been suggested for potential white light emitters are mostly in dispersions rather than in solid phase. This study also highlights the importance of investigating optical properties of polymer shell-based QDs in solution as well as solid format. Despite the various advantages of the inorganic shell,12 we would like to demonstrate an application of organic shell−CdS QDs through a simple synthesis process which has shown to emit near perfect white light under UV illumination.
Here we present an in situ room-temperature synthesis and subsequent characterization of CdS QDs which potentially can be employed readily as a white lightfluorophore. The optical properties, such as photoluminescence (PL) and optical absorption, are studied in the dispersion as well as solid cases. In the context of PL, we have noticed a vital phenomenon in which a transformation of nonradiative channels into radiative channels takes place, contributing to the blue region of the PL spectrum. This observation is interpreted on the basis of solvent/polymer/QD and polymer/ QD-defect state interaction in the dispersion and solid phases, respectively. Essentially, fine-tuning of the QD chemical environment can result in intriguing phenomenon, which can form the basis for designing future generations of QD-based fluorophores.
II. RESULTS AND DISCUSSION
A. Synthesis of CdS Quantum Dots. We would like to point out the following advantages of the present method over other methods.30 This process consists of exchanging metal ions into the ionic polymer, PVP, followed by reaction with Na2S. The present one-pot room-temperature synthesis potentially competes with the other methods in which the reaction temperature is as high as 280°C30or as long as 10 h31 at 90 °C. (See Zhong et. al.30 in which the authors briefly outline various methods for synthesizing CdS QDs.) The advantages offered by the hot injection method are acknowl-edged where various factors influence the nucleation and growth kinetics,32 yielding monodisperse QDs. It should be noted that the size of the QD depends on the metal ion concentration and subsequent thermal treatment (if any). However, if a process can yield a perfect white light coating material without the need for a tight diameter distribution, then such a process obviously improves the applicability. We note in our study that these QDs are stable at room temperature and at 0°C for months might be due to the polymer capping, where the stability is detrimental to optoelectronic applications.
B. Local Crystal Structure. Electron probe imaging, such as transmission electron microscopy (TEM), reveals the local structural details of the QDs. A representative image from TEM is shown in Figure 1. Well-resolved lattice fringes can be seen in the higher-resolution inset of Figure 1. The interplanar distance (d) of 3.39 Å (111) is from cubic phase CdS (d is averaged over 10 planes) and consistent with the literature.22High-resolution images and the corresponding FFT (Supporting Information, Figure S1, left panel) depicted a single-phase structure similar to that reported in an earlier study.21 In Figure S1 of the Supporting Information, the bright spots on the FFT are indicative of the single-phase crystalline nature of the QDs. The average particle diameter is∼3.2 nm (Supporting Information, Figure S1, right panel). As mentioned earlier, we aim to employ a simple and industrially applicable technique to obtain a white light emitter irrespective of the size dispersivity. We will also
see that the present polydispersity does not undermine the present investigation and intent in the context of white light emission.
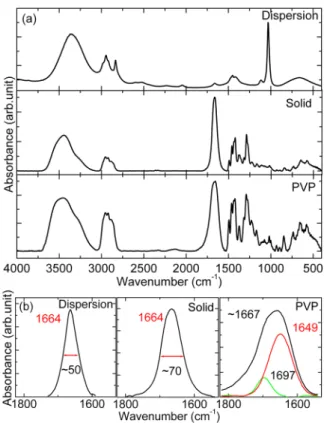
C. Functional Group Interactions. As mentioned in the introduction, the surface states are usually passivated by a capping agent to control the emission wavelengths.29Note that the interaction that took place between the surface of the QDs and the polymer provides a key insight in determining the emission phenomenon. We will establish the nature of the interaction in this section and address it in conjunction with optical properties in latter sections. In a Fourier transform infrared (FTIR) spectrum, evidence of interaction correspond-ing to a functional group is generally observed in terms of a shift of the peak(s) and/or changes in full width at half-maximum (fwhm). We have analyzed the possible species involved in such an interaction and the effect of phase transformation (dispersion to solid) with reference to the pristine polymer. FTIR spectra for three cases (dispersion, solid, and pure PVP) are shown in Figure 2a.
Given the comparatively high electronegativity, negative charge, and exposed oxygen is strongly hydrated, in contrast to the nitrogen which is shielded by the adjacent hydrocarbon chain (Supporting Information, Figure S2).33The electrostatic forces of this zwitterion may influence the intra- and intermolecular interactions between polar groups.34Essentially, in PVP, the most active group is CO, whereas the hydrocarbon chain acts as a hydrophobic part of the polymer. We have deconvoluted the vibrational band (centered at∼1667 cm−1) corresponding to CO for the PVP (Figure 2b) and compared it with that of the other two cases. The deconvolution suggested two peaks centered around 1649 cm−1and 1697 cm−1and are attributed to hydrogen- bonded and non-hydrogen-bonded carbonyl groups,35 respectively, where the former arises because of the hygroscopic nature of PVP. In the case of dispersion, this peak is significantly modified (red-shifted in terms of wavenumber from 1649 to 1664 cm−1with a 50 cm−1fwhm) because of the presence of MeOH. The nature and strength of the hydrogen bond vary between H2O and MeOH, while the water content is infinitesimally smaller than MeOH in the dispersion. Furthermore, a competition between CO/CdS and CO/ MeOH exists; the former interaction was observed earlier.36In
Figure 1.Transmission electron micrograph of the CdS QDs. Inset shows the high-resolution image of the quantum dot with (111) interplanar spacing of∼3.4 Å.
the case of the solid, improved interaction with CdS is expected in the absence of CO/MeOH while the peak shows a difference in only the fwhm (∼70 cm−1). It also tells us that the CO/MeOH interaction slightly dominates CO/CdS. Therefore, the CO peak for the film shows a shift of ∼15 cm−1from pure PVP because of the interaction with CdS.
Instead of the very complex OH stretching bands (3200− 3700 cm−1) due to the hygroscopic nature of PVP and methanol and the OH group in methanol, we investigated the C−O vibrational bands to understand the hydrogen bonding37 in the dispersion state of QDs. We note that this cannot be applied to the solid format of the sample. Nevertheless, this analysis helps in the understanding of the optical properties in the dispersion state. There are various possibilities of hydrogen bonding within methanol;37however, had it been complexed with PVP as solvent, the nature of some of the bands would be found to be significantly influenced. See Figure S3 of the Supporting Information, in which the identified frequencies are
tabulated against the corresponding interaction, from which we can see that hydrogen bonding between MeOH molecules has been blue-shifted while the other possibilities are almost unaffected.
Because of the presence of cationic natured nitrogen, it would be useful to see if there is any interaction between the nitrogen atom and the QDs. We have deconvoluted C−N, CH2
scissors, and CH bend vibrational bands (∼1520−1260 cm−1, Figure S4 of the Supporting Information) and noticed a significant difference between the dispersion and the solid. Interestingly, the latter is rather close to that of pure PVP in some aspects. In the case of the dispersion, because the vibrational frequencies of C−N, CH2scissors, and CH bend are
spectrally close,38they show collective oscillation. The center (Xc=∼1430 cm−1, Figure S4 of the Supporting Information)
for the three vibrational bands is invariant, whereas the low-frequency bands are blue-shifted and high-low-frequency bands are red-shifted, making it very complex to comment any further (Figure S4, Dispersion in the Supporting Information). However, with respect to the CH bend region38 of the film and PVP, in the former case the main band at∼1374 cm−1 shows two branches on either side (∼1385 and ∼1353 cm−1),
in contrast to the latter. Although cationic nitrogen is not evidenced to be interacting directly, on the basis of the modified CH bend region it is clear that cationic charged nitrogen is in the proximity of CdS QDs. The cationic nature of the nitrogen atom of the pyrrolidone unit enables the complexation with a negatively charged ion,33 if present, which is connected to its hydrophilic nature.
To continue the discussion of FTIR spectra, at this stage it is clear that there are two main and certain dangling interactions in the dispersion state, i.e., (i) the dipole interaction between O of CO and CdS and (ii) the hydrogen bond between O of CO and H of MeOH; we call them δ1and H, respectively. In
the context of the solid, when the QDs form an ensemble, it is practical to ignore the presence of MeOH, which thereby collapses the H bonds (and the polymer chains); hence, the interaction is mainly due to case (i), and we call this δ2.
Moreover, for the solid, C−N regional analysis from FTIR spectra suggested the presence of nitrogen close to the QDs, therefore wrapping (W) of alkyl chains is inevitable. Upon considering these interactions, we can see that the carbonyl oxygen is involved with two competing interactions in the solution state, where the order of the interaction strength is H >δ1. On the other hand, in the solid form,δ2and W exist, and we can say thatδ2>δ1.
D. Chemical State of Elements. We have employed XPS to reveal the chemical state of constituting elements and the possible interaction between PVP and QDs. The core level
Figure 2.FTIR spectra from CdS QDs (a) dispersion, solid, and pure PVP and (b) deconvoluted carbonyl group active region (RMS error≈ 0.002), where the spectral location of various peaks is annotated in cm−1.
spectra of Cd 3d, S 2p, and O 1s are shown in Figure 3, and the derived peak values are annotated on the image. Cd 3d5/2and
3d3/2 appear to be well-resolved in the core level spectral
investigation (Figure 3a) and occurred at 404.50 and 411.07 eV, respectively. The peaks at 406.42 and 411.65 eV, corresponding to a slightly oxidized form of Cd, suggest an interacting oxygen species.
Despite the low XPS cross section of sulfur,39 we have recorded a core level spectrum from S 2p (Figure 3b). This spectrum indicated a well-resolved 2p-doublet and a third peak of low, though distinguishable, intensity. Peaks at 160.75 and 161.91 eV correspond to 2p3/2and 2p1/2, respectively, while the
third peak at 168.29 eV corresponds to a more oxidized form of sulfur39that is persistent even in ultrahigh vacuum conditions (see references in ref 39). However, this peak might be from two different origins, i.e., (a) oxygen from the carbonyl group in PVP interacting with sulfur at the surface of CdS and/or (b) oxygen in the environment.
The core level spectrum of O 1s (Figure 3c) can be deconvoluted into two peaks centered at 531.39 and 535.78 eV. The peak with dominating intensity at 531.39 eV arises from the oxygen in the carbonyl group of PVP, while the other minor peak at higher binding energy position (535.78 eV) arises because of the chemisorbed oxygen (OCh). OCh withdraws
electrons from the intrinsic donors in the lattice and forms a charge-transfer bond (ξ). The peak at 531.39 eV is blue-shifted from the standard value (530.74 eV), suggesting an electron-transfer interaction which is consistent with the arguments for Cd 3d core level spectrum. Blue shift in the spectral location of the O 1s peak occurs as a result of decreased electron density around the O atom of the carbonyl group. This confirms an existing interaction between Cd2+ and the O atom of the
carbonyl group40,41 as evidenced in FTIR measurements. Regarding the sulfur core level spectrum (Figure 3b), the reason for the observed peak at 168.29 eV is more likely due to case (a). Because sulfur is very sensitive to the chemical environment,39it is influenced by the presence of CO, which is interacting directly with Cd2+. Furthermore, when we
compare the bulk binding energy values of CdS and the C O group from PVP, the decrease in the binding energy of both bands in CdS with PVP molecules as compared to that of the bulk CdS reveals a charge-transfer interaction between the two.42
E. Optical Absorption. Optical absorption spectra of QDs were obtained from the dispersion and the solid (Figure 4). It is hard to determine unambiguously if there is any shift in the onset of the optical absorption edge upon phase change. This is similar to an earlier observation43in which PVP-capped CdS-QDs are embedded in a poly (vinyl alcohol) matrix. Hence, phase change did not induce any further growth in the QDs, indicating an effective polymer shell around the crystals. The absence of well-resolved peaklike structures at the exciton absorption44 can be attributed to the polydispersity of QD size43 or the weak exciton binding energy due to strong Coulomb screening as observed in the context of PbS embedded in a polymer.45 The blue shift of excitonic absorption from bulk (Figure 4) is due to the quantum confinement effect manifested by size-dependent excitonic absorption while the particle size (∼3.2 nm) is comparable to the Bohr exciton radius (30 Å) of CdS. However, the polydispersity is an issue as observed under TEM, we cannot ignore the effect of polymer and/or solvent. Furthermore, it is known that the band gap of zero-dimensional semiconductors
is a function of size,46as is the case with CdS.44Theoretically, the tight binding approximation (TBA, diameter ≤ 4 nm) or effective mass approximation (EMA, diameter ≥ 4 nm) is able to match with the experiment.47 On the other hand,48 for smaller particles, EMA matches with the experiment if afinite potential well is employed. Using Brus’s46equation, though far from the real potential experienced by excitons, the estimated energy band gap is∼3.02 eV (ca. that of bulk CdS, ∼2.5 eV11). We have used the following material parameters for CdS: me* =
effective mass of electron (0.19me), mh* = effective mass of hole (0.8me), r = radius of the particle (1.6 nm), andε = dielectric
constant (5.7).49A comparison of the effective masses (me* < mh*) suggests that electron energy levels are more influenced
by the confinement effect.50The effect of matrix material, i.e., the confining potential on the band gap of CdS QDs, was shown previously.28
Furthermore, the band gap energy of PVP is∼5.6 eV (graph not shown here) and falls within the range of values studied by Baskoutas et al. (∼5−7 eV).28 The results suggest that the confining potential is equal to 0.08 times the band gap of the matrix, while assuming a similar potential for electron and hole. Hence, in the present case, the height of the confining potential is∼448 meV for the PVP matrix with a theoretically estimated thickness of∼8.5 nm. A close investigation (see inset of Figure 4) of optical absorption from dispersion and film provides further information about the broad absorption bands at lower energy (surface or crystal defects). When the dielectric around the QDs solidifies, we can observe the absorption bands evolved around the 500−650 nm region, in contrast to the flat response from the dispersion. This broad shoulder is attributed to the newly formed absorption bands originating from the altered surface interaction.
F. Surface and Defect States of Quantum Dots. Because there is a list of surface and crystal defects, it would be appropriate to discuss their origin and behavior before we proceed to the emission properties as a whole. In the surface-related trapping states, both electron and hole traps are expected,18especially in the context of quantum dots because of their very high surface-area-to-volume ratio. If we compare the binding nature of the atoms inside the crystal with that of those on the surface, the latter are incompletely bonded, and as a result such atoms protrude“dangling orbitals” away from the crystal; this is the case with most ionic crystals. These orbitals, if
Figure 4.Comparison of optical absorption spectra from dispersion and solid phases of CdS QDs. The band gap (Eg) of bulk CdS (2.5 eV) is taken from ref 11. Inset shows magnified view of a selected spectral region.
unpassivated, tend to form a band structure similar to that of the surface of a bulk crystal.18 Because these orbitals are electronically still active, they can act as traps for charge carriers at the surface, thereby increasing the probability of nonradiative transitions where the trapping reduces the overlap between the electron and hole wave functions. It is acceptable in the present case to assume the presence of different facets of the crystal due to their possible asymmetric shape, where the exposed atoms dangle their orbitals similar to CdSe QDs.51 In ionic crystals such as CdS, anions form a valence band (VB) while cations form a conduction band (CB). Interestingly, each surface ion forms one trap; Cdδ+forms an electron trap (eT; spreads toward
the CB from the mid-band gap, and is not a donor), while Sδ‑ forms a hole trap (hT; spreads toward the VB from the
mid-band gap,16and is not an acceptor), whereδ = 0.5 (as given in refs 18,52) is the effective ionic charge. Spanning or exact location of a particular surface state within the band gap depends on the δ of the atom,53 namely, anion-rich QDs possess more deep hole traps in the mid-band gap where they can span toward the VB,18,51 again depending on the δ. Notably, electrostatic neutrality on the surface plane (trap inversion) is preserved while trapping a considerable quantity of charge. In the context of QDs, because of the band gap broadening, the surface states play a crucial role in the emission process, while they lie relatively closer to the bulk midgap. These states are rather prominent and are less likely to be wiped out by VB and CB broadenings.16,18
We now consider the crystal defects, which can bear some charge. Vacancies and interstitials are denoted by V and I, respectively, with a suffix corresponding to the particular atom, i.e., VCd, VCd−, VCd2‑, VS, VS+, IS−, etc. Ionized sulfur vacancies
such as VS+and VS2+are 0.66 eV54−57and 0.59 eV56−59below
the CB, respectively. By considering the band energy locations of these donor defects, it appears to be the case that VS2+ is
much closer than VS+ to the CB. It should be noted that the
bulk band gap of CdS in both cases is not assumed to be the same, and VS2+ is farther than VS+ from the CB.57 With
reference to Cd vacancies, VCdis 1.24 eV
56
above the VB while VCd− is 1.61 eV56 below the CB; however, the emission
corresponding to these defects falls beyond 750 nm and is therefore out of the scope of the present investigation. It can be seen that the energy location or chemical nature of various defects is still uncertain, and there is a wide discrepancy in determining positions, as was also pointed out by Xu et al.60. However, here we have given logical explanation by considering widely accepted and energetically feasible states for the various emission bands based on the earlier established interaction between QDs and PVP.
Oxygen can be adsorbed on the surface in the form of negative ions, and the negative charge is acquired from either the existing electron donors (e.g., VS+) or the CB. This oxygen
is bound (ξ, Figure 6b,c) more strongly than those in the intrinsic surface traps because of the charge-transfer process. Adsorbed oxygen is found to be deep, relative to the intrinsic surface states, where each oxygen ion satisfies one surface trap. In the case in which the donor state is above the Fermi level, the OCh acts as a trap; otherwise, it acts as a recombination center in a comparatively small quantity.11,61,62
G. Photoluminescence. White Light and Color Coor-dinates. Photo-induced emission properties of CdS QDs are studied in two contexts, i.e., dispersion and solid (Figure 5a). Any shift in the emission spectra with change in the excitation wavelength is not observed (graphs not shown here), which
was reported earlier.63The present emission properties are not only interesting but also in strong contrast with previous similar studies.23,43 When the PVP concentration is increased, the defect-related PL emission is found to quench, which is attributed to decreased surface defects;43 nevertheless, by having higher PVP content during the synthesis, we have observed higher levels of defect-related emission spanning from the blue end to the red end of the spectrum. This could possibly originate from the variation in the synthesis method (here, Cd2+ ions initially interact with PVP, and then S2‑ions join to form CdS QDs). See the digital photographs (inset of Figure 5a) of solid and dispersion under 350 nm illumination, which demonstrate the transformation from yellow to white. The analysis of PL spectrum has revealed the 1976 CIE color coordinates to be nearly (0.21, 0.49) and (0.28, 0.53) forfilm and dispersion, respectively (black dots on the inset of Figure 5a). Although it appears to be trivial that the emission spectrum is influenced by the dielectric environment,21,26−28 here we would like to stress an importantfinding that the emitted light falls into the white region of the 1976 CIE diagram (unlike earlier reports); the coordinates for perfect white are (0.22, 0.48), and we can see how close the present material is to the ideal value. In the following, we would like to establish the origin of various emission bands after the deconvolution (Figure 5b) of the PL spectrum of thefilm and juxtapose it with that of dispersion. It was not practically plausible tofit a peak
Figure 5. Photoluminescence response of CdS QDs (a) dispersion and solid on log scale and (b) deconvoluted luminescence spectrum of solidified quantum dots. Inset of (a) shows CIE 1976 chromaticity diagram with the color coordinates annotated with black dots accompanied by digital photographs under illumination at 350 nm. Letters A−F refer to different emission bands.
around 380 nm (or 392 nm, A) during deconvolution. Hence, the spectral locations of these peaks (forfilm and dispersion) have been assigned manually, while the rest are simulated. The emission mechanism is shown in schematic form with reference to the surface interactions in Figure 6.
Apparently, because of the phase transformation from dispersion to solid, the interband transition has been blue-shifted from ∼392 nm (3.16 eV) to ∼380 nm (3.26 eV) (Figure 5a). If the QDs are unpassivated, the existence of surface states (eTand/or hT) is possible as shown in Figure 6a,
which causes nonradiative transition (dotted arrow), thereby decreasing the probability of band edge recombination. However, the trapped electron may undergo a radiative transition (solid arrow from Cdδ+ state) to the CB giving rise to defect-related emission at higher wavelength side. When the electrons are trapped at the surface states, they will be transferred to acceptors (redox process) through a nonradiative process, which not only reduces the radiative quantum yield but also red-shifts the band edge emission as noticed here. The calculated quantum yield is ∼85% and ∼70% for solid and liquid phases, respectively. When the surface is passivated with donors, they inject electrons into the crystal to occupy the surface trapped states, yielding enhanced band edge emis-sion.64,65 This blue shift of band edge emission is an indirect effect. Under the phase change, surface passivation is improved, during which the earlier dangling orbitals of QDs are passivated (δ2) by the PVP (Figure 6b). On the other hand, OChinduces a positive charged layer which bends the CB and VB upward (Figure 6b). This phenomenon induces a further confinement effect on the QD, resulting in a shift in the band edge emission.66 The fwhm of the exciton emission peak for the dispersion is ∼10 nm. The sharp emission suggests that a majority of particles are uniform in size, and the low intensity is attributed to the typical self-absorption phenomena. However, in the present context, the self-absorption has caused a radiative recombination at higher wavelengths and resulted in a broad and major peak centered at∼565 nm. The ratios of intensities of band edge to the defect emissions (IA/I∼565 nm, a measure of optical quality9) is ∼0.02 and ∼0.03 for dispersions and film, respectively. This not only suggests a dominating defect-related emission but also hints at the improved passivation upon
solidification, which is consistent with the interpretation of the blue shift of∼0.1 eV band edge emission. Interestingly, starting at∼550 nm, the low-energy side of the normalized spectrum from CdS QDs dispersion perfectly retraces that of the film. Higher-wavelength emission can also occur from deep level defects where stoichiometry, being an experimental limitation, indicates the presence of crystal defects in the sample (Surface and Defect States of Quantum Dots). Furthermore, after the surface passivation is improved, more emission bands are evolved. This is discussed below.
The origin of the blue region emission lines (413, 415, and 441 nm with fwhm range of 0.18 to 0.27 eV) are connected to the passivation mechanism. Interestingly, the passivation has created three discrete emission bands. The relatively sharper bands are radiative transitions involving the intrinsic lattice defects. Because of the dominating (or more probable) low-energy recombination from the surface defect level, we did not observe these peaks in the case of dispersion. The process of solidification improves the surface passsivation (δ2 > δ1), injecting electrons and pushing the defect levels further toward the CB.67,25When the surface states are almost energetically in line with VS+ and/or VS2+ states, the probability of
recombination of electrons from lattice defects to the VB is more likely; hence, we can observe the emission lines corresponding to these energy states which match the literature in terms of offsets from the CB (Figure 6c), as was mentioned in the previous section. The upward band-bending caused by the OChis partially compensated by the electrons which were
injected by PVP in the process of solidification, where δ2
becomes a predominant interaction supported by W. Consequently, the bending would have been reduced, which aligns VS+and/or VS2+states with the surface defects, which are
now relatively closer to the CB.
The emission at 413 nm occurs when a radiative transition takes place from VS+to the VB, and the 435 nm emission is due
to a transition from the intermediate state within the surface defects to the VB. The third line at 452 nm is due to a transition from VS2+to the VB. Furthermore, in the background
of the polydispersity of the present sample we have analyzed the size-dependent band gap and the consequent emission wavelengths. These blue emissions cannot be due to size
Figure 6.Suggested mechanism of light emission from CdS QDs: (a) unpassivated, (b) dispersion, and (c) solid. (a) Bulk/surface defects with transitions either radiative or nonradiative shown in dotted arrows, (b) in dispersion (yellow), and (c) embedded in the polymer matrix. Evand Ec are valence and conduction bands, respectively. VS2+and VS+are 0.2 and 0.59 eV below the CB, respectively. eT= electron trap, hT= hole trap; OCh= chemisorbed oxygen. Depending on the crystal plane, Cd2+and S2‑are equidistance from the VB and CB, respectively,18and|δ| ≤ 2.
variance. It is worth noting that the particle size was immaterial (within 2−4.5 nm) when CdS was capped with thioglycerol, for which the defect emission always peaks at 530± 20 nm.67
In the case of dispersion and film, the emission band E is seen to disagree in the spectral location, where the latter occurs at higher energy67 because the improved passivation shifts surface states close to the CB (Figure 6b,c). In both cases it is interesting to note that the fwhm of emitted bands is∼0.85 eV. The surface states, can form a narrow distribution of states18 giving rise to an emission of relatively higher fwhm, which could be the case here. We attribute the band E to a transition from surface defects to the VB (Figure 6b,c).
Red emission (F) is attributed to OChwhere it forms a deep level charged acceptor state, while compensated by a positive space charge region at the surface (Figure 6b,c). Because OCh binds more strongly than surface trapped oxygen, their presence can be expected in both phases of QDs. Arguably, this is consistent with the peak deconvolution for both the dispersion as well as the solid (Figure S6 of the Supporting Information and Figure 5), suggesting spectrally comparable red emission bands.
III. CONCLUSION
We have presented an important observation which is in clear contrast with existing literature in connection to the emission properties of CdS when the surface is passivated with PVP. This study provides new insight into exploiting the unavoidable surface defects on the CdS QDs by transforming them into radiative transitions in which the overall emission can be a potential white light. This transformation occurred when the dispersion of QDs was simply dried. In addition, because there is no other ligand associated in this in situ synthesis, limitations, such as detachment of a ligand from QDs skewing optical properties, are eliminated. The polymer chains act as a terminator and stop further growth of the crystals in the solution phase, and it is very unlikely that any surface state of the CdS QDs is left unpassivated. The sequence of FTIR investigations on dispersion-to-film has given crucial insight into the dynamics of the surface passivation. We have deconvoluted the vibrational band corresponding to CO for the PVP case. Notable differences (e.g., shift of ∼15 cm−1) are highlighted, and CO and CdS interactions are evidenced. The phase trasformation imposed significant changes in the mechanics of the surface passivation; the earlier, weaker dangling bonds became stronger (δ2 > δ1) and transformed
into rigid interactions. FTIR analysis also suggested a possible wrapping (W) of an alkyl chain around the CdS QDs. XPS investigation has corroborated the FTIR investigation in terms of charge-transfer interaction between CdS and CO of PVP. It also suggested the presence of OCh, where it withdrew a free electron from the lattice defect site or CB of CdS QDs. In the context of optical properties, no significant alterations are noticed at the absorption onset for the phases, from which we can infer that there is no further change in the size of the QDs. The PL properties are thoroughly investigated, and we are able to establish the origin of emission bands and the variations fromfilm to the dispersion. During the surface passivation, the binding abilities of the capping agent and consequent charge-transfer properties of the atoms on the bulk substrates (flat) are different from those of quantum dot-like curved surfaces, as the latter are influenced by structural factors18and size-dependent electron configurations.21 In this context, the conformal changes in PVP that have taken place during the phase change
have converted the nonradiative recombination channels into radiative channels in the blue region of the spectrum. On the other hand, if these trapped states are permanently occupied, then direct recombination is expected to be more efficient in a manner similar to the present context, where the QDs are fused in the polymer matrix. Improved passivation has shown new radiative transitions in the blue region of the spectrum, which are rather sharper (fwhm 0.18−0.27 eV) than surface-related recombinations (fwhm 0.85 eV). As the solvent evaporates, it undergoes certain conformal changes in the surrounding of the QDs; its flexibility and ionic interaction are altered. Notably, the interaction between solvent and PVP is subdued, whereas the PVP and CdS QD interaction is enhanced. The present case of surface passivation can also be viewed while correlating it with the gradient alloy structure.19In the gradient alloy case, the wave functions of the VB maximum and CB minimum are collapsed toward the center of the core in a differential manner.19 In the case of the inorganic shell, band bending occurs to equalize the Fermi level in both semiconductors. Here, after the phase transformation, because of the increased level of interaction, it is quite possible that the potential gradient formed on the surface can also become deeper, which is shown as a thicker gray area on the QDs (Figure 6c). The number density of size distribution is considered for size-dependent emission to clarify that the blue emission bands are not because of such a case. Theoretically, the typical distance between the QDs in the solid phase is∼17 nm, which places them far apart and in a noninteractive mode. In the presence of oxygen, CdS QDs are vulnerable to photo-oxidation.12Despite this fact, a significant stability of emission properties are revealed when thefilm is left in ambient conditions for nearly three months. When the CdS QDs are passivated with a polymer, they can perhaps be employed as biological probes.67 We do appreciate the color-rending procedure which employs different sources for various colors; however, if one can obtain near perfect white light without much difficulty, then it will be industrially more suitable than complex core−shell techniques. Furthermore, the suggested mechanism provides crucial insight into the behavior of surface states in terms of light emission in the presence of a surface interaction. When other capping agents are employed, one must carefully consider the effective electron-donating (or withdrawing) nature of the capping agent with respect to the charge at the surface defect rather than the strength of the passivation bond.21
IV. EXPERIMENTAL SECTION
A. Materials. Sodium sulfide (Na2S·9H2O), poly(vinyl
pyrrolidone) (PVP) with molecular weight of 1.3 × 10⁶,
FTIR grade potassium bromide (KBr, 99%), and methanol were purchased from Sigma-Aldrich. Cadmium nitrate (Cd-(NO3)2·4H2O) was obtained from Fluka, and all the chemicals
were used as received.
B. Synthesis of CdS quantum dots (QDs). CdS QDs were prepared based on a traditional method similar to that described in ref 68. For the synthesis, 3.2 mM Cd(NO3)2and
Na2S solutions in methanol were prepared as precursors. In addition, 2 g wt% of PVP solution in MeOH also was prepared and employed as a stabilizer in the synthesis. First, 25 mL of Cd(NO3)2solution was taken into aflask, and 10 mL of PVP
solution in MeOH was slowly added. After the solution was stirred for 20 min at room temperature, 25 mL of Na2S solution
was added dropwise to this mixture with continuous stirring. Finally, a bright yellow solution was obtained, Cd2+ + S2‑ →
CdS(QDs), which was used for further characterization without any size sorting.
C. Characterization of QDs. Optical absorption spectra were recorded on the samples using a Varian Cary 5000 UV− vis−NIR spectrophotometer on QDs in dispersion and solid format (dispersion was dried on quartz substrate). The morphology and size of the QDs were investigated using a transmission electron microscope (FEI-Tecnai G2F 30). FTIR spectra were recorded on a Bruker-VERTEX 70 instrument. The dispersion of QDs was centrifuged, and the precipitate was dried at room temperature under vacuum and pelletized with KBr. The spectra were recorded between 4000 and 400 cm−1at 4 cm−1resolution. Gaussian peakfittings in the FTIR spectra were performed with Opus 6.0, where the number of peaks were chosen based on the vibrational bands for the corresponding functional group and width and the center of the peaks were allowed to vary until convergence. Screenshots were accompanied with the uncertainty in thefitting procedure, characterized by the RMS error. The ionic status of the elements in the QD film was determined by an X-ray photoelectron spectroscopy (XPS, Thermoscientific) operating with Al Kα line (1486.6 eV); the peak fittings were performed with Avantage. Photoluminescence (PL) measurements were performed on the samples at room temperature using Horiba Jyobin Vyon Fluorolog; the samples were illuminated with the 350 nm line from a 450 W Xe lamp. Peak deconvolutions were performed with Origin 6.1. Digital photographs were obtained for the transmission of 350 nm illumination for the solution andfilm.
■
ASSOCIATED CONTENT*
S Supporting InformationAdditional characterization, diameter distribution, and decon-volution of various spectra. This material is available free of charge via the Internet at http://pubs.acs.org.
■
AUTHOR INFORMATIONCorresponding Authors
*S.V.: e-mail, [email protected]; fax,(+90) 312 266 4365; phone, (+90) 312 290 3533.
*T.U.: e-mail, [email protected]; fax, (+90) 312 266 4365; phone, (+90) 312 290 3571.
Notes
The authors declare no competingfinancial interest.
■
ACKNOWLEDGMENTSState Planning Organization (DPT) of Turkey is acknowledged for the support of UNAM-Institute of Materials Science & Nanotechnology. S.V. thanks The Scientific & Technological Research Council of Turkey (TUBITAK) (TUBITAK-BIDEB 2216, Research Fellowship Programme for Foreign Citizens) for postdoctoral fellowship. Y.E. thanks TUBITAK (Grant 110M612) for a PhD scholarship. T.U. acknowledges EU FP7-Marie Curie-IRG for funding NANOWEB (PIRG06-GA-2009-256428). Authors thank M. Guler and E. Kahveci for technical support.
■
REFERENCES(1) Bowers, M. J.; McBride, J. R.; Rosenthal, S. J. White-Light Emission from Magic-Sized Cadmium Selenide Nanocrystals. J. Am. Chem. Soc. 2005, 127, 15378−15379.
(2) Ali, M.; Chattopadhyay, S.; Nag, A.; Kumar, A.; Sapra, S.; Chakraborty, S.; Sarma, D. D. White-Light Emission from a Blend of
CdSeS Nanocrystals of Different Se:S Ratio. Nanotechnology 2007, 18, 075401.
(3) Lu, H. Y.; Chu, S. Y.; Tan, S. S. The Low-Temperature Synthesis and Optical Properties of Near-White Light Emission Nanophosphors Based on Manganese-Doped Zinc Sulfide. Jpn. J. Appl. Phys., Part 1 2005, 44, 5282−5288.
(4) Pradhan, N.; Peng, X. Efficient and Color-Tunable Mn-Doped ZnSe Nanocrystal Emitters: Control of Optical Performance via Greener Synthetic Chemistry. J. Am. Chem. Soc. 2007, 129, 3339− 3347.
(5) Byun, H.-J.; Song, S.-W.; Kim, Y.-S.; Yang, H. Solvothermally Grown Ce3+-Doped Y
3Al5O12 Colloidal Nanocrystals: Spectral Variations and White LED Characteristics. J. Phys. D: Appl. Phys. 2010, 43, 195401.
(6) Luwang, M. N.; Ningthoujam, R. S.; Srivastava, S. K.; Vatsa, R. K. Preparation of White Light Emitting YVO4:Ln3+ and Silica-Coated YVO4:Ln3+ (Ln3+ = Eu3+, Dy3+, Tm3+) Nanoparticles by CTAB/n-Butanol/Hexane/Water Microemulsion Route: Energy Transfer and Site Symmetry Studies. J. Mater. Chem. 2011, 21, 5326−5337.
(7) Ganapathi, M.; Eliseeva, S. V.; Brooks, N. R.; Soccol, D.; Fransaer, J.; Binnemans, K. Electrodeposition of Luminescent Composite Metal Coatings Containing Rare Earth Phosphor Particles. J. Mater. Chem. 2012, 22, 5514−5522.
(8) Sayed, F. N.; Grover, V.; Sudarsan, V.; Pandey, B. N.; Asthana, A.; Vatsa, R. K.; Tyagi, A. K. Multicolored and White-Light Phosphors Based on Doped GdF3 Nanoparticles and Their Potential Bio-Applications. J. Colloid Interface Sci. 2012, 367, 161−170.
(9) Vempati, S.; Mitra, J.; Dawson, P. One-Step Synthesis of ZnO Nanosheets: Bluish-White Fluorophore. Nanoscale Res. Lett. 2012, 7, 470.
(10) Chen, L.-C.; Tien, C.-H.; Liao, W.-C. A Phosphor-Free White Light-Emitting Diode Using In2O3:Tb Transparent Conductive Light Convert. J. Phys. D: Appl. Phys. 2011, 44, 165101.
(11) Williams, R. Surface Photovoltage Measurements on Cadmium Sulfide. J. Phys. Chem. Solids 1962, 23, 1057−1066.
(12) Lim, J.; Bae, W. K.; Kwak, J.; Lee, S.; Lee, C.; Char, K. Perspective on Synthesis, Device Structures, and Printing Processes for Quantum Dot Displays. Opt. Mater. Express 2012, 2 (5), 594−628.
(13) Pilla, V.; de-Lima, S. R.; Andrade, A. A.; Silva, A. C. A.; Dantas, N. O. Fluorescence Quantum Efficiency of CdSe/CdS Magic-Sized Quantum Dots Functionalized with Carboxyl or Hydroxyl Groups. Chem. Phys. Lett. 2013, 580, 130−134.
(14) Silva, A. C. A.; Neto, E. S. F.; da-Silva, S. W.; Morais, P. C.; Dantas, N. O. Modified Phonon Confinement Model and Its Application to CdSe/CdS Core−Shell Magic-Sized Quantum Dots Synthesized in Aqueous Solution by a New Route. J. Phys. Chem. C 2013, 117, 1904−1914.
(15) Rossetti, R.; Nakahara, S.; Brus, L. E. Quantum Size Effects in the Redox Potentials, Resonance Raman Spectra, and Electronic Spectra of CdS Crystallites in Aqueous Solution. J. Chem. Phys. 1983, 79 (2), 1086−1088.
(16) Brus, L. E. Electronic Wave Functions in Semiconductor Clusters: Experiment and Theory. J. Phys. Chem. 1986, 90, 2555− 2560.
(17) Petit, C.; Lixon, P.; Pileni, M. P. Synthesis of Cadmium Sulfide in Situ in Reverse Micelles. 2. Influence of the Interface on the Growth of the Particles. J. Phys. Chem. 1990, 94, 1598−1603.
(18) Levine, J. D.; Mark, P. Theory and Observation of Intrinsic Surface States on Ionic Crystals. Phys. Rev. 1966, 144, 751−763.
(19) Sarma, D. D.; Nag, A.; Santra, P. K.; Kumar, A.; Sapra, S.; Mahadevan, P. Origin of the Enhanced Photoluminescence from Semiconductor CdSeS Nanocrystals. J. Phys. Chem. Lett. 2010, 1, 2149−2153.
(20) Dannhauser, T.; O’Neil, M.; Johansson, K.; Whitten, D.; McLendon, G. Photophysics of Quantized Colloidal Semiconductors Dramatic Luminescence Enhancement by Binding of Simple Amines. J. Phys. Chem. 1986, 90, 6074−6076.
(21) Chou, H. L.; Tseng, C. H.; Pillai, K. C.; Hwang, B. J.; Chen, L. Y. Surface Related Emission in CdS Quantum Dots. DFT Simulation Studies. J. Phys. Chem. C 2011, 115 (43), 20856−20863.
(22) Chowdhury, P. S.; Ghosh, P.; Patra, A. Study of Photophysical Properties of Capped CdS Nanocrystals. J. Lumin. 2007, 124, 327− 332.
(23) Liu, S. H.; Qian, X. F.; Yin, J.; Ma, X. D.; Yuan, J. Y.; Zhu, Z. K. Preparation and Characterization of Polymer-Capped CdS Nanocryst-als. J. Phys. Chem. Solids 2003, 64 (3), 455−458.
(24) Duxin, N.; Liu, F.; Vali, H.; Eiseneberg, A. Cadmium Sulphide Quantum Dots in Morphologically Tunable Triblock Copolymer Aggregates. J. Am. Chem. Soc. 2005, 127, 10063−10069.
(25) Thangadurai, P. B., S.; Manoharan, P. T. Surface Modification of CdS Quantum Dots Using Thiols-Structural and Photophysical Studies. Nanotechnology 2008, 19, 435708.
(26) Tamborra, M.; Striccoli, M.; Comparelli, R.; Curri, M. L.; Petrella, A.; Agostiano, A. Optical Properties of Hybrid Composites Based on Highly Luminescent CdS Nanocrystals in Polymer. Nanotechnology 2004, 15 (4), S240−S244.
(27) Chen, O.; Yang, Y. A.; Wang, T.; Wu, H. M.; Niu, C. G.; Yang, J. H.; Cao, Y. C. Surface-Functionalization-Dependent Optical Proper-ties of II-VI Semiconductor Nanocrystals. J. Am. Chem. Soc. 2011, 133 (43), 17504−17512.
(28) Baskoutas, S.; Terzis, A. F. Size-Dependent Band Gap of Colloidal Quantum Dots. J. Appl. Phys. 2006, 99 (1), 013708−1− 013708−4.
(29) Wang, C.-W.; Moffitt, M. G. Surface-Tunable Photolumines-cence from Block Copolymer-Stabilized Cadmium Sulfide Quantum Dots. Langmuir 2004, 20, 11784−11796.
(30) Zhong, X. H.; Liu, S. H.; Zhang, Z. H.; Li, L.; Wei, Z.; Knoll, W. Synthesis of High-Quality CdS, ZnS, and ZnxCd1−xS Nanocrystals Using Metal Salts and Elemental Sulfur. J. Mater. Chem. 2004, 14 (18), 2790−2794.
(31) Zhang, Q.; Yang, J.; Wang, C. F.; Chen, Q. L.; Chen, S. Facile Fabrication of Fluorescent-Superhydrophobic Bifunctional Ligand-Free Quantum Dots. Colloid Polym. Sci. 2013, 291 (3), 717−723.
(32) Liu, H.; Owen, J. S.; Alivisatos, A. P. Mechanistic Study of Precursor Evolution in Colloidal Group II-VI Semiconductor Nano-crystal Synthesis. J. Am. Chem. Soc. 2007, 129 (2), 305−312.
(33) de-Faria, D. L. A.; Gil, H. A. C.; de-Queiroz, A. A. A. The Interaction between Polyvinylpyrrolidone and I2as Probed by Raman Spectroscopy. J. Mol. Struct. 1999, 478 (1−3), 93−98.
(34) Maruthamuthu, M.; Subramanian, E. Binding of Evans Blue onto Poly (N-vinyl-2-pyrrolidone). Polym. Bull. 1985, 14, 207−212.
(35) Brewer, S. H.; Tang, Y.; Vu, D. M.; Gnanakaran, S.; Raleigh, D. P.; Dyer, R. B. Temperature Dependence of Water Interactions with the Amide Carbonyls ofα-Helices. Biochemistry 2012, 51 (26), 5293− 5299.
(36) Lu, X. F.; Zhao, Y. J.; Wang, C.; Wei, Y. Fabrication of CdS Nanorods in PVP Fiber Matrices by Electrospinning. Macromol. Rapid Commun. 2005, 26 (16), 1325−1329.
(37) Georgiev, G. M.; Vasilev, K.; Gyamchev, K. Hydrogen Bonds in Water-Methanol Mixture. Bulg. J. Phys. 2007, 34, 103−107.
(38) Borodko, Y.; Habas, S. E.; Koebel, M.; Yang, P. D.; Frei, H.; Somorjai, G. A. Probing the Interaction of Poly(vinylpyrrolidone) with Platinum Nanocrystals by UV−Raman and FTIR. J. Phys. Chem. B 2006, 110 (46), 23052−23059.
(39) Colvin, V. L.; Goldstein, A. N.; Alivisatos, A. P. Semiconductor Nanocrystals Covalently Bound to Metal Surfaces with Self-Assembled Monolayers. J. Am. Chem. Soc. 1992, 114, 5221−5230.
(40) Zhou, M.; Wang, B.; Rozynek, Z.; Xie, Z.; Fossum, J. O.; Yu, X.; Raeen, S. Minute Synthesis of Extremely Stable Gold Nanoparticles. Nanotechnology 2009, 20, 505606.
(41) Xian, J.; Hua, Q.; Jiang, J.; Ma, Y.; Huang, W. Size-Dependent Interaction of the PVP Capping Ligand with Pd Nanocrystals. Langmuir 2012, 28, 6736−6741.
(42) Behera, M.; Ram, S. Inquiring the Mechanism of Formation, Encapsulation, and Stabilization of Gold Nanoparticles by Poly(vinyl
pyrrolidone) Molecules in 1-Butanol. Appl. Nanosci. 2013, DOI: 10.1007/s13204-013-0198-9.
(43) Pattabi, M.; Amma, B. S.; Manzoor, K. Photoluminescence Study of PVP Capped CdS Nanoparticles Embedded in PVA Matrix. Mater. Res. Bull. 2007, 42, 828−835.
(44) Nosaka, Y.; Yamaguchi, K.; Miyama, H.; Hayashi, H. Preparation of Size-Controlled CdS Colloids in Water and Their Optical-Properties. Chem. Lett. 1988, No. 4, 605−608.
(45) Wang, Y.; Suna, A.; Mahler, W.; Kasowski, R. PbS in Polymers. From Molecules to Bulk Solids. J. Chem. Phys. 1987, 87 (12), 7315− 7322.
(46) Brus, L. E. A Simple Model for the Ionization Potential, Electron Affinity, and Aqueous Redox Potentials of Small Semi-conductor Crystallites. J. Chem. Phys. 1983, 79 (11), 5566−5571.
(47) Lippens, P. E.; Lannoo, M. Calculation of the Band-Gap for Small CdS and ZnS Crystallites. Phys. Rev. B 1989, 39 (15), 10935− 10942.
(48) Murakoshi, K.; Hosokawa, H.; Saitoh, M.; Wada, Y.; Sakata, T.; Mori, H.; Satoh, M.; Yanagida, S. Preparation of Size-Controlled Hexagonal CdS Nanocrystallites and the Characteristics of Their Surface Structures. J. Chem. Soc., Faraday Trans. 1998, 94, 579−586.
(49) Brus, L. E. Electron−Electron and Electron−Hole Interactions in Small Semiconductor Crystallites: The Size Dependence of the Lowest Excited Electronic State. J. Chem. Phys. 1984, 80 (9), 4403− 4409.
(50) Hasselbarth, A.; Eychmuller, A.; Weller, H. Detection of Shallow Electron Traps in Quantum Sized CdS by Fluorescence Quenching Experiments. Chem. Phys. Lett. 1993, 203, 271−276.
(51) Underwood, D. F.; Kippeny, T.; Rosenthal, S. J. Ultrafast Carrier Dynamics in CdSe Nanocrystals Determined by Femtosecond Fluorescence Upconversion Spectroscopy. J. Phys. Chem. B 2001, 105, 436−443.
(52) Birman, J. L. Electronic Energy Bands in ZnS: Potential in Zincblende and Wurtzite. Phys. Rev. 1958, 109, 810−817.
(53) The surface traps on CdS (1120) are expected to have energy depths in the 0.2−0.4 eV range. If δ is varied from 0.5 to 2 (ideal case), then the depth of the surface trap lies between 0.2 and 0.4 eV.18
(54) Vuylsteke, A. A.; Sihvonen, Y. T. Sulfur Vacancy Mechanism in Pure CdS. Phys. Rev. 1959, 113 (1), 40−42.
(55) Yang, J.; Deng, D.-W.; Yu, J.-S. Transfer from Trap Emission to Band-Edge One in Water-Soluble CdS Nanocrystals. J. Colloid Interface Sci. 2013, 394, 55−62.
(56) Uchida, I. Photoconductivity of Pure Cadmium Sulfide Single Crystal near the Band Edge. J. Phys. Soc. Jpn. 1967, 22 (3), 770−778. (57) Mandelis, A.; Siu, E. K. M. Combined Photoacoustic and Photoconductive Spectroscopic Investigation of Nonradiative Recom-bination and Electronic Transport Phenomena in Crystalline n-Type CdS. I. Experiment. Phys. Rev. B 1986, 34 (10), 7209−7221.
(58) Vigil, O.; Riech, I.; Rocha, M. G.; Angel, O. Z. Characterization of Defect Levels in Chemically Deposited CdS Films in the Cubic-to-Hexagonal Phase Transition. J. Vac. Sci. Technol., A 1997, 15 (4), 2282−2286.
(59) Ji, X.; Li, H. J.; Cheng, S.; Wu, Z. G.; Xie, Y. Z.; Dong, X. C.; Yan, P. X. Growth and Photoluminescence of CdS and CdS:Mn Nanoribbons. Mater. Lett. 2011, 65 (17−18), 2776−2778.
(60) Xu, X.; Zhao, Y.; Sie, E. J.; Lu, Y.; Liu, B.; Ekahana, S. A.; Ju, X.; Jiang, Q.; Wang, J.; Sun, H.; et al. Dynamics of Bound Exciton Complexes in CdS Nanobelts. ACS Nano 2011, 5 (5), 3660−3669.
(61) Jie, J. S.; Zhang, W. J.; Jiang, Y.; Meng, X. M.; Li, Y. Q.; Lee, S. T. Photoconductive Characteristics of Single-Crystal CdS Nanorib-bons. Nano Lett. 2006, 6 (9), 1887−1892.
(62) Mark, P. The Role of Chemisorption in Current Flow in Insulating CdS Crystals. J. Phys. Chem. Solids 1965, 26, 959−972.
(63) Lakowicz, J. R.; Gryczynski, I.; Gryczynski, Z.; Murphy, C. J. Luminescence Spectral Properties of CdS Nanoparticles. J. Phys. Chem. B 1999, 103 (36), 7613−7620.
(64) Wang, Y.; Herron, N.; Mahler, W.; Suna, A. Linear-and Nonlinear-Optical Properties of Semiconductor Clusters. J. Opt. Soc. Am. B 1989, 6, 808−813.
(65) Wang, Y.; Suna, A.; McHugh, J.; Hilinski, E. F.; Lucas, P. A.; Johnson, R. D. Optical Transient Bleaching of Quantum-Confined CdS Clusters: The Effects of Surface-Trapped Electron-Hole Pairs. J. Chem. Phys. 1990, 92, 6927−6939.
(66) Li, D.; Zhang, J.; Xiong, Q. Surface Depletion Induced Quantum Confinement in CdS Nanobelts. ACS Nano 2012, 6 (6), 5283−5290. (67) Sapra, S.; Nanda, J.; Sarma, D. D.; El-Al, F. A.; Hodes, G. Blue Emission from Cysteine Ester Passivated Cadmium Sulfide Nano-clusters. Chem. Commun. 2001, 21, 2188−2189.
(68) Amma, B. S.; Manzoor, K.; Ramakrishna, K.; Pattabi, M. Synthesis and Optical Properties of CdS/ZnS Coreshell Nanoparticles. Mater. Chem. Phys. 2008, 112 (3), 789−792.