IEEE TRANSACTIONS ON ULTRASONICS, FERROELECTRICS, AND FREQUENCY CONTROL, VOL. 41. NO. 5, SEITEMBER 1994 613
Influence of Missing Array Elements on Phase
Aberration Correction for Medical Ultrasound
Mustafa Karaman,
Member, IEEE,Hayrettin Koymen,
Senior Member, IEEE,Abdullah Atalar,
Senior Member, IEEE,and Matthew O’Donnell,
Fellow, IEEEAbstract-The influence of missing array elements on aber- ration correction based on time delay estimation using radio frequency signals of neighboring elements is experimentally inves- tigated. Normalized cross correlation and sum of absolute differ- ences are employed as the cost functions in aberration estimation. Their performance is tested through various measurements using radio frequency data acquired with a 3.3 MHz, 64-element phased array. Variation of cost functions and phase estimation error are obtained for different combinations of number of missing elements, amount of aberration, and noise level. For a particular combination of these parameters, a set of B-scan images is reconstructed and presented to examine the effects of residual phase errors on image quality.
I. INTRODUCTION
P
HASE ERRORS induced by tissue inhomogeneities crit- ically affect the image quality of phased array ultrasound scanners [l], [2]. Various techniques had been developed to estimate and correct phase aberrations [3]-[ll]. Time delay estimation via minimization of cross correlation [5] and sum of absolute difference [ 121 between the sampled radio frequency(RF) echo signals of neighboring elements has been shown to perform well. The accuracy of aberration estimation is seriously degraded, however, by the presence of missing array elements [13], [14]. Such elements arise due to discontinuous acoustic windows into the body, loss of contact between the array and the body wall, and electrical or mechanical defects in the array.
Detection of relative phase differences between missing elements is not possible in aberration correction techniques based on time delay estimation between RF signals on neigh- boring elements. To obtain the complete aberration pattern for proper phasing of the whole aperture, differential delays at missing elements can be interpolated using phase estimates between the nearest active elements. A cost function is used for every correction technique based on a measure of the signal covariance. The accuracy of phase estimation between two RF signals is limited by the level of their covariance. The spatial variation of the cost function, used for time
Manuscript received July 6, 1993; revised March 11, 1994; accepted April 1. 1994.
M. Karaman was with the Department of Electrical and Electronics En- gineering, Bilkent University, Ankara, 06533 Turkey. He is now with the Department of Electrical Engineering and Computer Science, University of
Michigan, Ann Arbor, MI 48109 USA.
H. Koymen and A. Atalar are with the Department of Electrical and Electronics Engineering, Bilkent University, Ankara, 06533 Turkey.
M. O’Donnell is with the Department of Electrical Engineering and Computer Science, University of Michigan, Ann Arbor, MI 48109 USA.
IEEE Log Number 9403346.
delay estimation across the array, is a critical measure of phase estimation between the nearest operable elements. The covariance depends on not only the spatial distance, but is also critically influenced by the aberration level and signal to noise ratio (SNR) of RF signals. Therefore, for aberration correction with inactive elements, variation of the cost function must be measured for different numbers of missing elements with different aberration and noise levels.
Various measurements of the cost function and phase es- timation error have been performed to test the performance of aberration estimation with missing elements. The measure- ments were obtained on experimental RF data acquired from a standard tissue-mimicking phantom. Additionally, a set of B- scan images of the phantom was reconstructed with inactive elements to qualitatively test the performance of correction schemes employing different cost functions in aberration es- timation. In all measurements, phase distortions and inactive elements are simulated by inserting random time shifts and assigning zero valued samples to the corresponding elements, respectively.
Aberration correction based on time delay estimation be- tween neighboring elements is described in the next section. Aberration estimation with missing elements is discussed also in this section. Measurements to test the influence of inactive elements on the cost function and estimation error with different rms aberration and SNR levels are presented in Section 111. B-scan images of the phantom and their qualitative comparison are given in Section IV.
11. ABERRATION CORRECTION
Phased array adaptive beamformers involve estimation of phase aberration profiles across the array, and compensation based on these estimates. Compensation can easily be realized by updating focusing delays using the estimated aberration delays. The aberration profile can be obtained by estimating the time delay between an element signal and a reference. Such a reference signal can be formed by summing the signals of all elements or of a subgroup of array elements [ 131. An alternative way is to measure the relative time shifts between neighboring elements. The final element delays, then, are obtained by unwrapping the measured differential delays [15]. The measurement of relative delay in either case is a typical time delay estimation problem [ 161.
Time delay estimation techniques considered here will be evaluated with missing elements, aberration, and finite SNR. 0885-3010/94$04.00 0 1994 IEEE
613 IEEE TRANSACTIONS ON ULTRASONICS, FERROELECTRICS, AND FREQUENCY CONTROL. VOL. 41, NO. S. SEF'TEMBER 1994
For this purpose, we define cost functions and test their de- pendence on these parameters. Thus, the two sampled signals, SzL and
SE,
used for time delay estimation are defined as:where X,,, and X,, are noise free RF signals, W1 and W 2
are uncorrelated Gaussian random noise signals having the same bandwidth as the RF signals, and c,(a) and c,(a) are coefficients used to obtain different SNR levels. These coefficients are defined as:
where M is the length of the time window and n is the desired SNR level (dB) for both SEl and
SE.
Cross correlation of two such signals is widely used to estimate relative time delay. The normalized cross-correlation function (NCC) for the sampled signals, Szl and
SE.
is expressed in (3) (see below) where S;>:) ,is the ith sample of the signal from 7bth element, and the S, 1s the mean value computed over the corresponding window. The delay U , is theaberration of the 71th element's signal. The best match of two signals is achieved at the maximum correlation value where the maximizing parameter, I;, corresponds to the time delay between S: and
SE,
i.e., I; = U,, - U,. Normalization isused to prevent wrong decisions due to signal fluctuations in different time windows.
The sum of absolute differences (SAD) has been used as a computationally simpler cost function in many minimization problems [ 161, [ 191. For time delay estimation, SAD of the sampled signals S ; and
SE
can be defined as:The best match of
SE,
andSE
results in the minimum SAD value. Thus, the value of k: which minimizes the SAD corresponds to the time delay difference between the signals SFl andSF.
A computationally much simpler cost function is obtained using reduced bit density in the digital representation of signals [ 161, [ 191. As the limiting case, the SAD function can be
computed using signal samples quantized to a single bit (1 -b SAD) [12]:
where xE(i) is the the one bit representation of SE(,i), and @ is the bitwise logic esclusiw-or operation. Note that such a simplification is not possible for NCC (3) because of the normalization.
To obtain the total aberration pattern, time delay estimation outlined above must be repeated for all neighboring element pairs. Following measurement of the relative aberration delays, an estimate of the resultant aberration delay time, rTL, for the 71th element is obtained by phase unwrapping:
where &,.,-l is the differential delay between the j t h and
( j - 1)th elements.
Differential delays cannot be computed between any pair of elements including an inactive element. For example, at- tempts to obtain the complete aberration pattern with a single missing element result in forming two phase patterns over the subapertures on either side of the inactive element. While elements of each subaperture are phased properly, the relative phasing of the two subapertures with respect to each other may not be correct. This can cause significant degradation in image quality. To handle this problem, O'Donnell and Engeler [ 141 have reported a simple technique involving interpolation of the lost differential delays. In this scheme, the relative phase between two nearest operable elements on both sides of inactive elements is estimated using cross correlation, and it is evenly distributed over the missing elements. If the elements between i and i
+
T for 7'>
1 are inactive, then the differentialdelay between the nth and ( n - 1)th elements,
AT,^,,-^,
(i
<
715
,i+
T ) is:As long as the estimation is carried out on neighboring elements, this approach can be directly applicable in aberration estimation independent of the cost function. Our measurements using NCC, SAD, and l-b SAD are based on this approach.
111. MEASUREMENTS
The influence of missing elements on phase aberration has been experimentally tested. In particular. both variation of the cost function and phase estimation error have been
KARAMAN er al.: INFJSJENCE OF MISSING ARRAY ELEMENTS 615
examined with different numbers of missing elements, aberra- tions and noise levels. Measurements used RF data acquired from a standard graphite-gel AIUM resolution phantom with a conventional 3.33 MHz, 64-element, 15 mm phased array transducer
[ 5 ] ,
[ 151. RF A-scans were recorded for every possible combination of transmitter and receiver elements using 10-bit, 17.76 MHz analog to digital conversion. All measurements and image reconstruction were performed by digitally processing the recorded data to emulate a real-time adaptive digital imaging system.To reduce phase quantization effects, the sampling rate was increased by 8 times using digital interpolation resulting in an effective clock frequency of 142 MHz corresponding to a phase accuracy of 2 ~ / 4 3 . For all measurements, a fixed transmit focus at 80 mm and dynamic receive focusing were employed. NCC and SAD computations were carried out on RF signals from diffuse scatterers within a 20 mm axial window located 60 mm away from the aperture. The transmit focus was purposely placed outside the estimation window to simulate typical operating conditions.
A. Variation of Cost Function
Fullword NCC, fullword SAD, and l-b SAD functions were measured for different numbers of missing elements and rms aberration levels. For these measurements, phase distortions were simulated using a random aberration pattern, i.e., electronic aberration is employed. The pattern is band-pass filtered to eliminate high frequency variations which are not practical. The resultant phase profile has a random sinusoidal pattern (see Fig. 6). Different rms aberration levels on the array are achieved by scaling the amplitude of the same aberration pattern.
Equations (3), (4), and (5) were used with the experimental data to compute the cost functions. The signal
X,
used in these expressions represents an actual RF A-scan signalat the nth element. The maximizing parameter
k
is set to zero, and the parameter cy indicating the SNR level is set toinfinity. In other words, the cost functions are computed at zero time lag with SNR the same as that of actual RF data
X,.
Furthermore, computations are carried out on speckle RF signals from different pairs of array elements. The spacing between these elements corresponds to the number of missing elements. The results of different element pairs with equal spacing are averaged. We make the following definitions to clarify these manipulations:-
N - r.
N-7-In addition to this averaging, all measurements are repeated on five different sets of speckle data. Based on these measure-
ments, the rms value and standard deviation of each function, therefore, are defined as:
I _ 5
- -
Fig. l presents C;,
E;,
and0,"
versus interelement distance,T , and the rms aberration,
F,
whereNote that the number of missing elements is identical with the interelement distance, T , with an offset of one-element
distance, i.e., the number of missing elements is equal to r - 1
as long as r
>
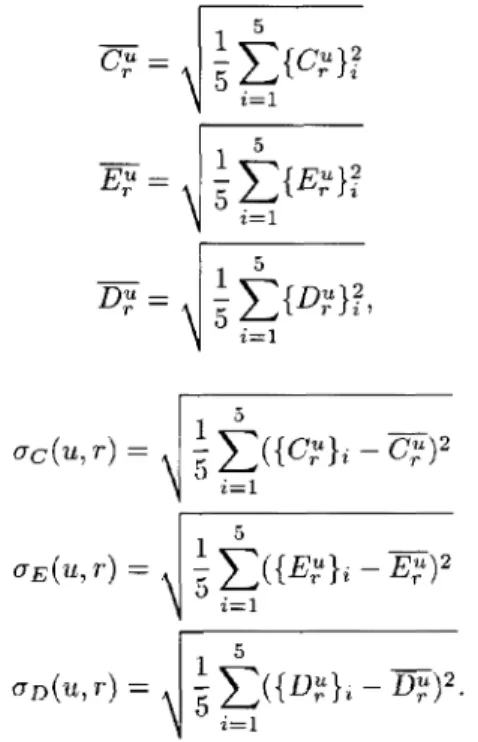
0. In all figures, both the number of missing elements and inter-element distance are explicitly represented. Also note that magnitude distributions of both SAD and l-b SAD functions are normalized by their maximum values for presentation on the same figure together with NCC (Figs. 1 and 3).The NCC function is unity for no missing elements, which corresponds to the autocorrelation of RF signals. The auto- correlation is not affected by inserted phase distortions up to 0.023 A rms aberration (X is the ultrasound wavelength). The correlation function vanes almost linearly with the number of missing elements for zero rms aberration (i.e., the variation on the vertical axis is almost linear). This is in agreement with the van Cittert-Zemike theorem applied to pulsed echo ultrasound [20]. The decrease in magnitude with the number of missing elements shows variable characteristics for different aberration levels, as is evident from the contour distribution in Fig. l. As expected, the decrease in correlation becomes severe with increasing aberration level. Also, the contours show an asymptotic behavior as a function of aberration level for a very small number of missing elements.
Both fullword SAD and l-b SAD functions show very similar characteristics. The SAD values for pairs cannot be
616 IEEE TRANSACTIONS ON ULTRASONICS, FERROELUJTRICS, AND FREQUENCY CONTROL, VOL. 41, NO. 5, SEPTEMBER 1994
1 I
0 0.05 0.1 0.15 0.2
RMS PHASE ABERRATION (FRACTION OF A WAVELENGTH)
Fig. 1. Magnitude distribution o f the cost functions versus the number of missing elements and rms phase aberration.
quantitatively compared to their correlation counterparts. Nev- ertheless, incremental variation of SAD values can be com- pared to correlation trends. It can be observed that incremental changes of the functions are comparable. The dependence of SAD functions on the rms aberration level and number of missing elements is similar to that of the correlation function, considering that the increase in the later corresponds to a decrease in the former two. The decrease in l-b SAD with increase in the number of missing elements is slightly more than that of full word SAD. In general, both SAD functions show similar dependence on the number of missing elements and rms aberration level.
The maximum standard deviation values computed using (10) for NCC, SAD, and l-bit SAD are within 14, 4, and 6%, respectively, of the corresponding magnitude values of the functions. For up to 8 missing elements with rms aberration less than 0.15 X, the standard deviation value of each function is less than 50% of its maximum standard deviation.
B . Phase Estimation Error
To directly compare estimation performance using different cost functions, time delay estimation error versus aberration and missing elements was measured for NCC, SAD, and l-b SAD functions. The measured error is the residual rms phase error between the original and estimated relative aberration delays. Since measurements were performed on different el- ement pairs, the error of each measurement is first averaged over pairs with the same spatial separation:
l
(12) Then, the rms of this averaged error and its standard deviation over five different sets of speckle data are obtained:
0 0
0 0.05 0.1 0.15 0.2
RMS PHASE ABERRATION [FRACTION OF A WAVELENGTH)
.
i -'
I I
0 0.05 0.1 0.15
RMS PHASE ABERRATION (FRACTION OF A WAVELENGTH) 0.2
(b)
Fig. 2. Distribution of the residual differential phase errors versus the number
of missing elements and nns phase aberration. (a) n n s and (b) standard deviation. Contour values are given in fractions of a wavelength. The phase quantization level is 0.023X
I _
5Relative phase differences between element pairs are com- puted by time delay estimation, and then the above error computations are carried out. Measurements are repeated for all element pairs separated by r elements, and for different U values. All computations are repeated for each cost function with CY = m.
Fig. 2(a) depicts A4(u, T ) vs T and 21 for NCC, SAD, and
l-b SAD. The error distribution for each function is almost the same, where the error varies from zero to 2 phase quantization levels for up to 4 missing elements with up to 0.1X rms aberration. (one quantization level is 0.023 X). The standard deviation distributions of phase error measurements for all three functions show similar characteristics to the residual
phase error [see Fig. 2(b)]. All combinations of missing elements and rms aberration levels under the 0.069 contour (3 quantization levels) are stable. Other combinations, however, result in very high standard deviations over different speckle data, and hence are not stable.
KARAMAN et al.: INFLUENCE OF MISSING ARRAY ELEMENTS 15 16 Gi . o s W
3
I I 0 5 10 15 20 25 30 35 40 45 50SIGNAL TO NOISE RATIO (dB)
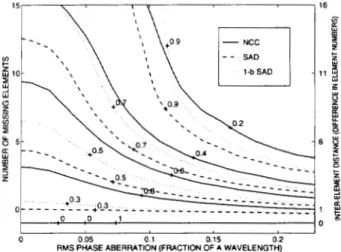
Fig. 3. Magnitude distribution of the cost functions versus the number of missing elements and SNR.
C . Noise Performance
To test noise performance, measurements of magnitude and phase estimation error were performed for different SNR levels and missing elements. Fig. 3 shows the magnitude and residual phase error distributions for NCC, SAD and l-b SAD functions versus SNR and number of missing elements. To obtain these results, the noisy signals,
S$
andS;,
are generated using Eqs. 1 and 2 where scaling factors cm (a) and c,( a )
determine SNR levels. These coefficients are updated for every signal pair used in the computation of the cost function.To obtain measurements for different combinations of miss- ing elements and SNR levels, the cost functions and phase estimation errors should be functions of only r and
a.
Hence, no aberrations were employed, i.e., U* = 0 for everyi.
There- fore, the definitions used in the previous parts of this section are modified so that the aberration dependence is replaced with the SNR dependence. As a result, the expressions given in (8)are modified as:
N - r
m=l
-
N-rThe rms and standard deviation were commutated over five sets of speckle data similar to those in (9) and (10). As a result, the new outputs become: C;,
E;, 0;.
Also note that, the cost functions of ( 2 ) , (3), and (4) are computed with no aberration, i.e., ui = 0, and hence the resulting error is a function of only missing elements and SNR, not aberration. The resultant residual rms error, denoted asAd(cr,
r ) , was also computed on the same data.Fig. 3 depicts the distributions of
C;,
E,",
and0,"
vs the number of missing elements, r , and the SNR level, cr. For each function, the magnitude variation stays almost the same up to 20 dB SNR whereas a sharp change occurs for SNR less than 20 dB. The figure shows that l-b SAD is- - -
- -
K -
l I
0 5 l0 15 20 25 30 35 40 45 50
SIGNAL TO NOISE RATIO (dB)
I I
0 5 10 15 20 25 30 35 40 45 50
SIGNAL TO NOISE RATIO (dB)
(b)
Fig. 4. Distribution of residual differential phase errors vs the number of missing elements and SNR. (a) rms (h) standard deviation. Contour values are given in fractions of a wavelength. The phase quantization level is 0.023X.
much more sensitive for SNR than fullword SAD and fullword NCC. The level of variation in l-b SAD at high SNR values, however, is comparable to the noiseless case, although this is obscured in the figure by large magnitude variations at low SNR. In general, SAD is more sensitive to SNR than NCC. For SNR greater than 10 dB, the standard deviations of NCC, SAD, and l-b SAD are within 10, 3, and S%, respectively, of the corresponding magnitude values whereas the maximum standard deviation at 0 dB SNR equal 35, 6 , and lo%, respectively.
Finally, the residual phase error versus SNR and missing elements is illustrated in Fig. 4(a) for NCC, SAD, and 1- b SAD. Each figure depicts the distribution of & ( a , r ) for each cost function. The functions, in general, show similar performance in phase estimation for different SNR levels. However, as implied by the magnitude measurements, the error of l-b SAD is slightly higher than that of SAD and NCC at low SNR, especially at 0 dB. While the measured standard deviations for each function do not exceed one phase quantization level for SNR higher than IO dB, they are less than two phase quantization levels for SNR less than 10 dB [see Fig. 4(b)]. As a result, standard deviation measurements
618 IEEE TRANSACTIONS ON ULTRASONICS, FERROELECTRICS, AND FREQUENCY CONTROL, VOL. 41, NO. 5, SEPTEMBER 1994
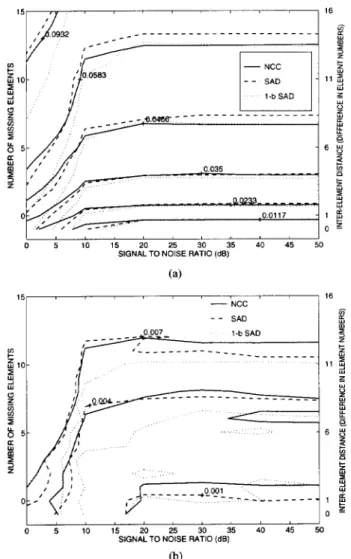
Fig. 5 . B-scan sector images of a section of the phantom. Reconstruction parameters for each image are listed in Table I.
depict the stability of results for speckle data with SNR higher than 10 dB.
IV. B-SCAN IMAGES
To test the performance of different cost functions in time delay estimation, sector images of the phantom were recon- structed with and without missing elements and aberration. Each image of Fig. 5 shows the same section of the phantom representing a 45" sector angle over 48 mm range starting at 32 mm from the transducer. Images are displayed on a logarithmic scale with a 50 dB dynamic range.
For each corrected image, transmit and receive focus delays were updated using the phase aberration pattern estimated
from diffuse scatterers. A 20 mm window length was used for time delay estimation by NCC, SAD, and l-b SAD. Missing elements and phase distortions were applied both on transmit and receive. The original aberration pattern, which has an r m s value of 1.40 radians (see Fig. 6), is applied by simply time shifting signals on channels. Estimated patterns
shown in Fig. 6 were used to compensate phase aberrations on both transmit and receive. Missing elements were realized by zeroing RF signals both in transmit and receive beamforming. Other parameters used in image reconstruction are outlined in Table I.
Comparison of (a), (b). and (c) of Fig. 5 indicates that the degradation in image resolution due to aberration is much more severe than that caused by missing elements. The corrected images. (d), (e), and
(0,
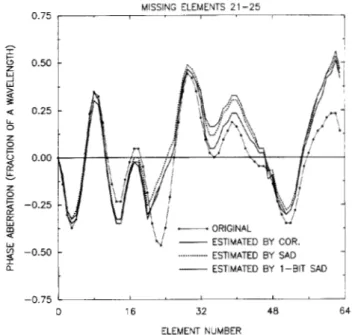
are very similar, as predicted based on the measurements presented in the previous section. Corrected images are slightly degraded because of imperfect phase error compensation. This is due to the small estimation errors in relative phases between active element pairs. Also, estimation error in the relative phase between the 20th and 26th elements, the nearest active elements to the missing elements, produces a bias for phase estimates o n elements 26 to 64.The original aberration pattern shown in Fig. 6 has an rms value of 0.222 X. The number of missing elements is 5, and
0.75 MISSING ELEMENTS 21 -25
,-.
Ig
0.50 Y W3
a 0.25 LL 0 z P 6 0.00 v2
z P5
-0.25 K W 6 W2
-0.50 m 7 ESTIMATED BY COR. ... ... ESTIMATED BY SA0& - ESTIMATED BY l-BIT SAD
-0.75 L 1
0 16 32 48 64
ELEMENT NUMBER
Fig. 6. The original and estimated phase aberration patterns across the array. Elements 21-25 are missing in aberration estimation.
TABLE I
IMAGE RECONSTRUCTION PARAhlETERS
Image a b C d e f Missing Elements - 21-25 21-25 21-25 21-25 21-25 Aberration Aberration Estimation - - - NCC SAD l-b SAD
the correlation coefficient in Fig. 1 corresponding to these parameters is about 0.3. The rms residual diffeer-enfial phase errors of estimates of NCC, SAD, and l-b SAD are 0.102 X 0.102 X, and 0.108 X whereas the corresponding rms residual
unwrapped phase errors are 0.1 15 X, 0.138 X, and 0.138 X, respectively. Although the reduction in overall phase error is only about fifty percent, a dramatic image quality improvement is obtained. This is because the final residual errors are mainly due to the propagation of differential phase errors resulting in a bias on elements 26-64 (see Fig. 6). Since this bias is relatively small compared to the overall phase distortion, its effect on image quality is not significant.
v.
DISCUSSION AND CONCLUSIONIn general, combinations of the number of missing elements, rms aberration and SNR levels resulting in correlation values higher than fifty percent of the autocorrelation value can be used for aberration estimation. The measurements show
K A R A M A N c[ al.: I N F L U E N C E OF MISSING A R R A Y E L E M E N T S
that, for such combinations, NCC, SAD, and l-b SAD show comparable performance.
For aberration correction in the presence of missing ele- ments, inactive elements must be detected before aberration estimation and beamforming. This can be achieved by com- puting the rms signal amplitude at each channel over a set of range windows. In practical applications, the processor performing computation of the cost function can also be used for this purpose [14]. If detection of an inactive element, however, fails, then the corresponding differential delays will be incorrect resulting in significant errors in unwrapped phase estimates.
All phase error measurements, which were performed on differential phase estimates, do not include the propagation of differential phase errors across the array through phase unwrapping. The differential residual phase error is a di- rect measure for comparison of different cost functions in aberration estimation, and the influence of error propagation on aberration correction is identical for each cost function. In general, propagation of differential errors is noticeable if the accumulated error is significant compared to the overall aberration, and becomes a drawback in aberration correction based on neighboring elements.
All SNR analysis in this study assumed that the original data are noiseless. In fact the original data are quite noisy. Additional noise is superimposed on these signals to illustrate trends in estimation error as the SNR is reduced. The SNR quoted here, therefore, should not be considered the absolute SNR expected from array data. In other words, better noise performance of the aberration estimation schemes is expected on real phased array data. This is because experimental data used in this study were obtained through a synthetic aperture approach where only one element was fired at a time, and thus SNR of the RF signal on a channel after transmit beamforming with N-elements is proportional to
m.
However, for a phased array system where N-elements are active in transmit. the SNR of the received RF signal on a channel becomes proportional to N . On the other hand, since measurements for different SNR levels presented here were performed with no aberration, the performance of estimation schemes will be degraded further in the presence of finite aberrations.One can attempt to recover lost differential delays asso- ciated with missing elements using a different interpolation technique. We examined this possibility using a simple scheme based on bilinear interpolation. The lost differential delay is in- terpolated using two terms: one involves the differential delay between nearest operable elements whereas the second term is due to bilinear interpolation using the measured differential delays of active element pairs neighboring to the inactive elements. This scheme, as expected, better recovers the lost delays. Misalignment of the phasing of two subapertures, however, is worse than that of (7). This effect can be reduced by using more complicated interpolation techniques such as a lowpass filtering of a size comparable to the array size, but with increased computational complexity. In fact, the critical issue in aberration estimation with inactive elements is the accurate phase alignment of two subapertures. where the interpolated diflivwzfial delays are used only for this purpose.
619
Hence, the simple scheme of (7) is a good choice both in terms of accuracy and computational efficiency.
While aberration correction based on l-b SAD is com- putationally more efficient compared to fullword SAD and fullword NCC, its accuracy is lower for low SNR levels. This limitation, however, can be relaxed by averaging the estimates over a number of beams [ 121, and/or increasing the estimation window used in l-b SAD computation [ 161.
The correlation function as defined in (3) acts as the reference covariance measure for comparison of the SAD- based aberration estimation measurements. It is defined in its widely used normalized form, and computed accordingly. Normalization is crucial for imaging with wide band signals. It can be eliminated, however. for imaging involving sufficiently narrow band signals, and hence its one bit version can also be used in phase estimation. Use of the correlation function without normalization must be tested for phase estimation using RF signals with different band widths. Furthermore, the computational complexity of such methods must be com- pared to efficient computation techniques based on CORDIC processing [ 141.
REFERENCES
M. O‘Donnell and S. W . Flax, “Phase aberration meahurements in medical ultrasound: human studies,” Ultrasorz. Imaging, vol. 10. pp.
1-1 I. 1988.
G. E. Trahey, P. D. Freiburger, L. F. Nock. and D. C. Sullivan, “In vivo measurements of ultrasonic beam distortion in the breast,” Ultrusotr.
Imaging, vol. 13, pp. 71-90, 1991.
M. Hirama and T. Sato, “Imaging through an inhomogeneous layer by least-mean-square error fitting,” J . Acoust. Soc. Amer., vol. 75, pp. 1142-1 147, Apr. 1984.
S . W. Smith, G. E.Trahey, and 0. T. van Ramm, “Phased array ultrasound imaging through planar tissue layers.” Ulfrusound in Mrd.
and E d . , vol. 12, pp. 229-243, Mar. 1986.
S . W. Flax and M. O’Donnell, “Phase-aberration correction using signals from pomt reflectors and diffuse scatterers: basic princlples,” IEEE
Trans. Ultrason. Ferroriec. Frrq. Contr-., vol. 3 5 , pp. 758-767, Nov. 1988.
D. Rachlin, “Direct estimation of aberrating delays in pulse-echo imag- ing systems,”J. Acoust. Soc. Amer., vol. 88, pp. 191-198. July 1990.
D. Zhao and G. E. Trahey, “Comparisons of image quality factors for
phase aberration correction with diffuse and point targets,” 1EEE Tr-uns.
Ultruson.. Fer-roelec.. Freq. Conrr., vol. 38, pp. 125.132, Mar. 1991.
R. Kanda. Y. Sumino, K. Takamizawa, and H. Sasaki, “An investigation of wavefront distortion correction: correction using averaged phase information and the effect of correction one and two dimensions,” Pro(..
of I991 IEEE Ulrr-ason. Symp., pp. I20 1 - 1206, 199 I .
M. O’Donnell and P. C. Li, “Aberration correction on a two-dimensional anisotropic phased array,” P m c . rf 1991 IEEE Ultr-usori. S y m p , pp. 1189.1193, 1991.
M . Fink, “Time reversal of ultrasonic fields - Part I: basic principles.”
IEEE Truns. Ultrason. Fer-r-oelrc. Frrq Cor7tr.. vol. 39, pp. 555-566,
Sept. 1992.
D.-L. Liu and R. C. Waag, “Time-shift compensation of ultrasonic pulse focus degradation using least-mean-square error estimates of arrival time,” J . Acoust. Soc. Amer-., vol. 95, pp. 542-555, Jan. 1994.
M. Karaman, A . Atalar. H. Koymen, M. O’Donnell. “A phase aberration correction method for ultrasound imaging,” I E E E T r u m Ulrr-usorz ,
Frrroelect.. Freq. Contr-., vol. 40, no. 4, pp. 275-282, J u l y 1993.
G. E. Trahey and P. D. Freiburger, “An evaluation of trnnsducer design and algorithm performance for two dimensional phase aberration correction.” Proc. o f 1 Y Y l IEEE Ultruson. .Yymp., pp. 118I-l 187, 1991.
M. O’Donnell and W. E. Engeler, “Correlation-based aberration cor- rection in the presence of inoperable elements.” l E E E Trans. L‘itj-usor?.. Frrroriec. .. Frey. Corm.. vol. 39, pp. 700-707. Nov. 1992.
M. O’Donnell and S . W Flax, “Phase-aberration correction using signal\ from point reflectors and diffuse scatterers: experimental results.” IEEE
Truns. L‘lfl-uson.. Ferr-orlrt... Fr-rq. Corztr-., vol. 3 5 , pp. 768-774. Nov. 1988
620 IEEE TRANSACTIONS ON ULTRASONICS, FERROELECTRICS. AND FREQUENCY CONTROL, VOL. 41, NO. 5, SEPTEMBER 1994
116) G. Jacovitti and G. Scarano, “Discrete time techniques for time delay estimation,” IEEE Trans. Acousl. Speech, Signal Process., vol. 41, pp. 525-533, Feb. 1993.
[l71 D. I. Barnea and H. F. Silverman, “A class of algorithms for fast digital image registration,” IEEE Trans. Comput., vol. 21, pp. 179-186, Feb.
1972.
[IS] P. Maragos, “Morphological correlation and mean absolute error crite- pp. 1568-1571, 1989.
ria,”Proc. of 1989 I n [ . Conf. on Acoust., Speech, and Signal Process.,
[l91 L. N. Bohs and G. E. Trahey, “A novel method for angle independent ultrasonic imaging of blood flow and tissue motion,” lEEE Trans. Biomed. Eng., vol. 38, pp. 280-286, Mar. 1991.
[20] R. Mallart and M. Fink, “The van Cittert-Zernike theorem in pulse-echo measurements,”J. Acousr. Soc. Amer., vol. 90, pp. 2718-2727, 1991.
Mustafa Karaman (”89) was born in Ballkesir, Turkey, in 1964. He received B.S. degree from Middle East Technical University, Ankara, Turkey in 1986, the M.S. and Ph.D. degrees from Bilkent University, Ankara, in 1988 and 1992, respectively, all in electrical and electronics engineering.
He is currently a post-Doctoral fellow in the Bio- engineering Department of the University of Michi- gan, AM Arbor. His research interests are VLSI
signal processing and medical ultrasound imaging.
Hayrettin Koymen (S’7&M’87-SM’91) was born in Ankara, Turkey in 1952. He received the B.Sc. and M.Sc. degrees from Middle East Technical
University, Ankara, Turkey in 1973 and 1976, resp- sctively, and the Ph.D. degree from the University of Birmingham, England in 1979, all in electrical engineering.
He became a faculty member of Middle East Technical University in 1979. His earlier work in- volved underwater acoustics and oceanographic in- strumentation. In 1990 he joined the faculty of
Bilkent University, Ankara, where he is now a professor with the Department of Electrical and Electronic Engineering. His current interests are medical
imaging, personal computer based biomedical signal acquisition and process- ing, and acoustic miroscopy.
Abdullah Atalar (M’88-SM’90) was born in Gaziantep, Turkey in 1954. He received the B.S. degree from Middle East Technical University,
Ankara, Turkey in 1974 and the M.S. and Ph.D. degrees from Stanford University, CA in 1976 and 1978, respectively, all in electrical engineering. His thesis work was on reflection acoustic microscopy.
From 1978 to 1980 he was a post-Doctoral fellow and then an Engineering Research Associate with Stanford University continuing his work on acoustic microscopy. For eight months he was with Hewlett Packard Labs., Palo Alto, CA, engaged in photoacoustics research. From
1980 to 1986 he was on the faculty of the Middle East Technical University as an Assistant Professor. From 1982 to 1983 he was on leave from the University and was with Emst Leitz Wetzlar, Wetzlar, W. Germany, where he was involved in the development of the commercial acoustic microscope. In 1986, he joined the Bilkent University as the chariman of the Electrical and Electronics Engineering Department and served in the founding of the
Department where he is currently a Professor. His research interests include acoustic imaging, linear acoustics, and computer aided design in electrical engineering.
Dr. Atalar was awarded H. Tugaq Goundation Award of TUBITAK, Turkey for his contributions to acoustic microscopy.
Matthew O’Donnell (M’79-SM’84-F’93), for a photograph and biography,