IDENTIFICATION GENES INVOLVED IN
HEPATOCELLULAR CARCINOMA:
EVALUATION OF hCdc4 and B-Raf GENES
A THESIS SUBMITTED TO
THE DEPARTMENT OF MOLECULAR BIOLOGY AND GENETICS AND
THE INSTITUTE OF ENGINEERING AND SCIENCE OF BILKENT UNIVERSITY
IN PARTIAL FULFILLMENT OF THE REQUIREMENTS FOR THE DEGREE OF MASTER OF SCIENCE
By
BANU SÜRÜCÜ
I certify that I have read this thesis and that in my opinion it is fully adequate, in scope and quality, as a thesis for degree of Master of Science.
Assist. Prof. Dr. Cengiz YAKICIER
I certify that I have read this thesis and that in my opinion it is fully adequate, in scope and quality, as a thesis for degree of Master of Science.
Assoc. Prof. Dr. Necat İMİRZALIOĞLU
I certify that I have read this thesis and that in my opinion it is fully adequate, in scope and quality, as a thesis for degree of Master of Science.
Assist. Prof. Dr. Can AKÇALI
Approved for the Institute of Engineering and Science
Prof. Dr. Mehmet BARAY Director of Institute of Engineering and Science
ABSTRACT
IDENTIFICATION OF GENES INVOLVED IN HEPATOCELLULAR CARCINOMA;
EVALUATION OF hCdc4 and B-Raf GENES Banu SÜRÜCÜ
M.S. in Molecular Biology and Genetics Supervisor: Assist. Prof. Dr. Cengiz YAKICIER
September 2003, 56 pages
Hepatocellular carcinoma (HCC), the major type of primary liver cancer, is one of the most common cancers worldwide. Development and progression of HCC occur as a multistep process, requiring the activation of oncogenes and the inactivation of several tumor suppressor genes. Although, inactivation of tumor suppressor genes, including p53, Axin and activation of oncogene β-catenin, have been shown to be involved in HCC development, the molecular mechanism of hepatocarcinogenesis is still unclear. The identification of additional genes that are involved in hepatocarcinogenesis is, not only, an important task to understand this process, but also for development of novel strategies for prevention or therapy.
The aim of this study was to elucidate a possible function of hCdc4 and B-Raf genes in HCCs.
A gene or genes on chromosome 4q have been implicated in hepatocarcinogenesis by the observation of frequent deletions of this region in HCCs. More recently, hCdc4, a gene in this region has been proposed as a candidate tumor suppressor gene. hCdc4 is an F-box protein which is shown to be involved in ubiquitination of cyclin E, thus targeting it for destruction. Cyclin E overexpression, is reported to be a frequent event in different cancers including HCC suggesting a problem in its destruction. 15 HCC cell lines were analysed for expression and mutation of hCdc4 gene by RT-PCR and direct sequencing of PCR products. No abnormal transcript and mutation observed in HCC cell lines tested. Our findings suggest that alteration of this gene is not a frequent event in hepatocarcinogenesis.
B-Raf, which is one of the human isoforms of RAF, is activated by oncogenic Ras (leading to cooperative effects in cells responding to growth factor signals). B-Raf mutations are found in a wide range of cancers. Eventhough, mutational activation of Ras is not a frequent event in human hepatocarcinogenesis, few Ras mutations were reported in HCC cases. Thus activation of oncogenic MAP kinase pathway by another component of this pathway such as BRAF is worth to analyze. HCC cell lines and tumours were searched for B-Raf mutations. Activating BRAF missense mutations were identified in 2/72 HCCs (3%). Our results suggest that B-Raf may be occasionally involved in hepatocarcinogenesis. Thus MAP kinase pathway might be involved in hepatocarcinogenesis but neither B-Raf nor Ras are the major players of this pathway in this event. For this reason, other members of this pathway should be evaluated for mutations in HCC.
ÖZET
HEPATOSELÜLER KARSİNOMDA ROL ALAN GENLERİN
TANIMLANMASI: hCdc4 VE B-Raf GENLERİNİN DEĞERLENDİRİLMESİ Banu SÜRÜCÜ
Yüksek Lisans Tezi, Moleküler Biyoloji ve Genetik Bölümü Tez Yöneticisi: Yard. Doç. Dr. Cengiz YAKICIER
Eylül 2003, 56 sayfa
Karaciğer kanserinin başlıca türü olan hepatoselüler karsinom (HCC) dünya çapında yaygın kanserlerden biridir. HCC’nin oluşması ve gelişimi çok basamaklı bir süreç olup onkogenlerin aktivasyonunu ve/veya tümör baskılayıcı genlerin inaktivasyonunu gerektirir. Her ne kadar p53, aksin gibi tümör baskılayıcı genlerin inhibisyonu ve β-katenin gibi onkogenlerin aktivasyonu gösterildiyse de hepatoselüler karsinomun moleküler mekanizması belirgin değildir. Bu nedenle, hepatokarsinogenezde rolü olan genlerin tanımlanması sadece bu sürecin anlaşılmasında değil aynı zamanda koruma veya tedavi için yeni stratejiler geliştirilmesinde de önemli bir basamaktır.
Bu çalışmanın amacı hCdc4 ve B-Raf genlerinin HCC’deki olası rollerini değerlendirmektir.
Kromozom 4q üzerinde sık görülen delesyonlar nedeniyle bu bölgede bulunan gen ya da genlerin HCC’de rol alabileceği düşünülmektedir. Yakın zamanda bu bölgede bulunan bir gen olan hCdc4 klonlanmış ve olası bir tümör baskılayıcı gen olarak gösterilmiştir. hCdc4 bir F-box proteini olup siklin E’nin ubikütinlenmesinde dolayısıyla da yıkımında rol aldığı gösterilmiştir.Yıkımındaki bir bozukluk dolayısıyla olabilecek siklin E ekspresyon seviyesindeki artış, HCC’nin de içinde bulunduğu çeşitli kanserlerde sık görülen bir olaydır. 15 HCC hücre hattında hCdc4 geninin ekspresyon ve mutasyon çalışmaları RT-PCR ve bunu takiben PCR ürünlerinin direkt DNA dizi analizi yöntemleri kullanılarak incelenmiştir. Test edilen HCC hücre hatlarında mutasyon veya anormal transkript gözlemlenmemiştir. Bu bulgular hCdc4 genindeki değişimlerin hepatokarsinogenezde sık rastlanan bir olay olmadığına işaret etmektedir.
RAF proteininin insan isoformlarından biri olan B-RAF onkogenik RAS tarafından aktive edilerek hücrelerin büyüme faktörlerine yanıt vermesinde işlev görür.. B-Raf mutasyonları birçok kanser türünde gösterilmiştir. RAS mutasyonları insan hepatokarsinogenezinde sık görülen bir olay olmasa da HCC örneklerinde az sayıda rapor edilmiştir. Bu nedenle onkogenik MAP kinaz yolağının aktivasyonunun B-RAF gibi başka bir bileşeni tarafından aktive edilmesi olasıdır. B-Raf mutasyonları HCC hücre hatları ve tümörlerinde araştırılmıştır ve aktive edici B-Raf mutasyonları HCC’lerin %3’ünde (2/72) tanımlanmıştır. Bu bulgular B-Raf geninin, dolayısıyla bu yolağın hepatokarsinogenezde rol alabileceğini ancak ne B-Raf ne de ras geninin hepatokarsinogenezde rol oynayan başlıca genler olmadığını göstermektedir. Bu nedenle MAP kinaz yolağının diğer üyelerinin HCC’deki mutasyonları değerlendirilmelidir.
ACKNOWLEDGEMENT
First of all, I would like to thank my supervisor Dr. Cengiz Yakıcıer for his friendly attitude, endless support, patience. He always pioneered me to think creatively, and scientifically. And I would like to thank Prof. Mehmet Öztürk who leaded to offer the opportunity of the scientific resarch in the field of molecular biology of cancer in a modern and challenging environment in Turkey. I would like to thank to Prof. Hasan Erten, who made me meet the opportunities of Bilkent University, for his guidance and support.
I would like to thank my lab mate Yeliz Yuva for her friendship and help in sequencing and all the members of the Genetics Lab for the warm and friendly enviroment that we shared.
My special thanks go to Cemo, Hani, Bilhadj, Nuri, Ceyhan and Jale for their valuable friendships. I greatly appreciate their support and wish them happiness and success for the rest of their lives.
Also I would like to thank to ex-members of our lab, Oğuz (for coffee breaks), Doruk (for tango lessons), Aslı U., Tuba, Ebru, Arzu, Berna for their friendship and help. Thanks also to current & ex-members of BilGen; Belma and Esin for their help and guidence during my first days in the lab.
I also would like to thank to all members of the MBG Department; the faculty, the graduate members and Abdullah Ünnü, Bilge Özbayoglu, Tülay Arayıcı, Füsun Elvan and Sevim Baran.
My deepest gratitudes are for my family for always giving their support and help whenever I needed.
Last but certainly not least, my ultimate thanks are for Umut Soydaner for his love and presence in my life, supporting me all the time.
TABLE OF CONTENTS Page SIGNATURE PAGE ABSTRACT ÖZET ACKNOWLEDGEMENTS TABLE OF CONTENTS LIST OF FIGURES LIST OF TABLES ABBREVIATIONS 1. INTRODUCTION 1.1. Hepatocellular carcinoma (HCC) 1.1.1. HCC Biology 1.1.2. HCC Genetics 1.2. hCdc4 /Archipelago / Fbw7 / SEL10: 1.3. B-RAF
1.3.1. B-Raf mutations in human cancer: 2. MATERIALS AND METHODS
2.1. Materials
2.1.1. Chemicals and Enzymes 2.1.2. Equipment and Manufacturers 2.1.3. Plastic Disposables 2.1.4. Solutions 2.2. Methods 2.2.1. Cell lines 2.2.2. Primers 2.2.2.1.Primers for hCdc4: 2.2.2.2. Primers for B-Raf 2.2.3. Polymerase Chain Reaction
2.2.3.1. PCR conditions ii iii v vii viii x xi xii 1 2 4 6 11 13 14 16 17 17 17 18 18 19 19 19 21 21 21 22
2.2.3.2. PCR mix
2.2.4. ARMS (Amplification Refractory Mutation System) 2.2.4.1. ARMS primers for normal allele
2.2.4.2. ARMS primers for the mutated allele 2.2.5. DNA Isolation from cell pellets
2.2.6. RNA Isolation from cell pellets
2.2.7. Determination of RNA concentration by Spectrophotometry
2.2.8. cDNA synthesis
2.2.9. Agarose Gel Electrophoresis of DNA fragments 2.2.10. Gel Extraction of PCR Products
2.2.11. Purification of PCR Products 2.2.12. Automated DNA Sequencing 3. RESULTS
3.1. hCdc4 3.2. B-RAF
3.2.1. Exon 15 and Exon 11 Mutations 3.2.1.1.Exon 15 mutations 3.2.1.2. Exon 11 Mutations 3.2.2. ARMS test
3.2.2.1 ARMS test for HCC cell lines 3.2.1.2. ARMS test for HCC tumours 4. DISCUSSION 4.1. hCdc4 4.2. B-RAF 5. FUTURE PERSPECTIVES 6. REFERENCES 22 23 23 24 24 24 25 25 26 26 27 28 29 30 32 32 32 32 33 33 34 35 36 40 44 46
LIST OF FIGURES
Page Figure 1.1: Worldwide incidences of HCC
Figure 1.2: Etiology of HCC
Figure 1.3: Multistage Hepatocarcinogenesis Figure 1.4: Frequency of LOH in HCC
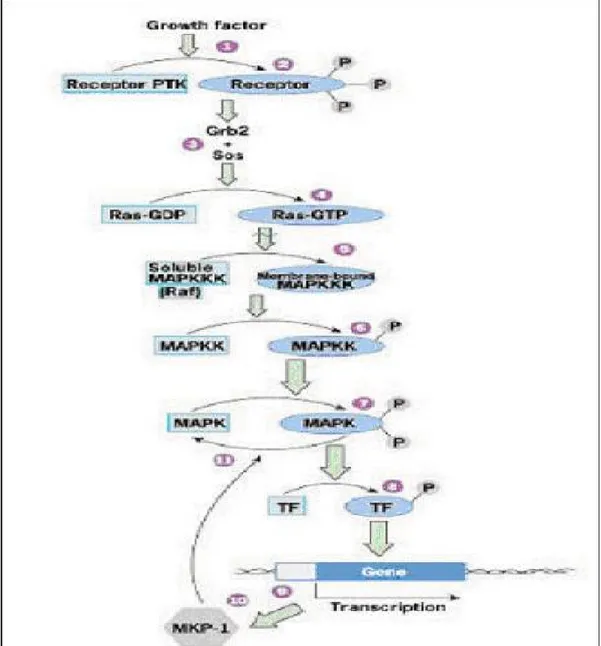
Figure 1.5: Summary of gains and losses detected by CGH Figure 1.6: MAPK pathway
Figure 2.1: Positions of hCdc4 specific primers Figure 3.1: Positions of hCdc4 specific primers
Figure 3.2: RT-PCR analysis of 5’ hCdc4 cDNA using 1F and 3R primers Figure 3.3: RT-PCR analysis of 3’ hCdc4 cDNA using 4F and 7R primers Figure 3.4: The sequenced regions of hCdc4 in 15 HCC cell lines
Figure 3.5: Sequencing result of SK-Hep1
Figure 3.6: B-Raf exon 11 PCR products of HCC cell lines
Figure 3.7: ARMS results of exon 15 T1796A mutation for HCC cell lines (a) Figure 3.8: ARMS results of exon 15 T1796A mutation for HCC cell lines (b) Figure 3.9: ARMS results of exon 15 T1796A mutation for HCC tumours (a) Figure 3.10: ARMS results of exon 15 T1796A mutation for HCC tumours (b) Figure 3.11: Sequencing result with BrafG-R primer for HCC tumour T39 Figure 4.1: hCdc4/Fbwx7 gene locus on chromosome 4q
Figure 4.2: hCdc4 mutations
Figure 4.3: Exons and motifs of B-RAF Figure 4.4: B-RAF protein.
2 4 4 8 10 15 21 30 30 31 31 32 32 33 33 34 34 34 36 38 40 41
LIST OF TABLES
Page Table 1.1: Risk factors for HCC.
Table 1.2: Some genes involved in HCC
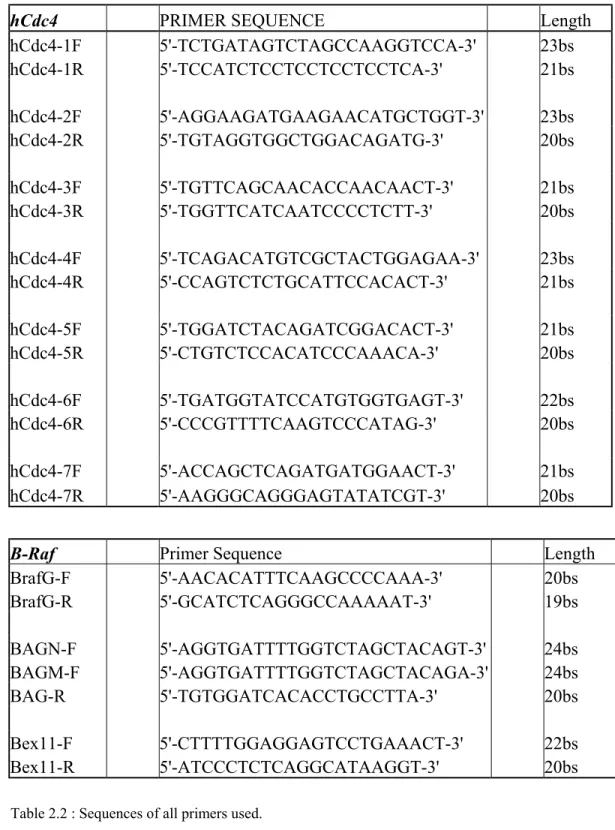
Table 1.3: Cyclin E protein levels in HCC cell lines. Table 2.1: Cell lines used and their mutational status Table 2.2: Sequences of all primers used.
Table 2.3: PCR conditions for hCdc4
Table 2.4: PCR conditions for hCdc4 and B-Raf Table 2.5: PCR Mix 3 7 12 19 20 22 22 22
ABBREVIATIONS
ARMS Amplification Refractory Mutation System
CDK2 Cyclin dependent kinase
cDNA Complementary DNA
CGH Comparative Genomic Hybridization
CRD Cysteine-rich domain
ddNTP Dideoxynucleotidetriphosphate
DNA Deoxyribonucleic acid
ERK-1/2 Extracellular signal regulated kinase
EtBr Ethidium bromide
HBV Hepatitis B Virus
HCC Hepatocellular Carcinoma
HCV Hepatitis C Virus
LOH Loss Of Heterozygosity
MAPK Mitogen-Activated Protein Kinase
MEK MAPK/ERK Kinase
ORF Open Reading Frame
PCR Polymerase Chain Reaction
RBD Ras Binding Domain
RT-PCR Reverse Transcriptase-PCR
SCF Skp-Cullin-F box
TBE Tris-Borate-EDTA
TSG Tumour Suppressor Gene
UV Ultraviolet
1.1. Hepatocellular Carcinoma
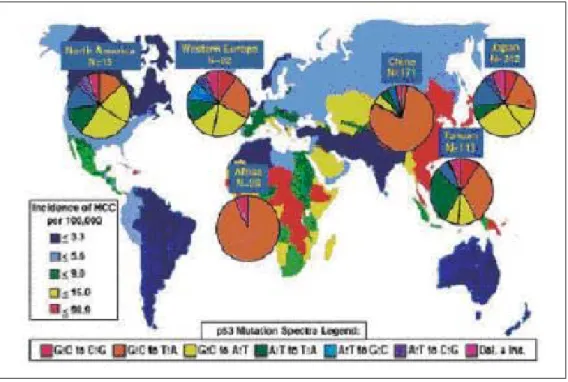
Hepatocellular carcinoma (HCC) is a malignant tumour derived from hepatocytes. HCC is fifth most common malignant disease worldwide with an estimated 564,000 new cases diagnosed annually and fourth in cancer mortality after lung, stomach and colon cancers (Parkin et al., 2001a; Parkin, 2001b). HCC is the predominant cause of cancer mortality in Southern and Sub-Saharan Africa, Taiwan and China. Its incidence is variable and higher in these regions. This geographic pattern overlaps with the distribution of risk factors and probably also reflects genetic characteristics inherited or acquired through oncogenic agents. (Figure 1.1, Table 1.1)
Figure 1.1: Worldwide incidences of HCC. Worldwide incidences of HCC with pie diagrams of
p53mutation patterns for various countries and continents according to the IARC p53 mutation database. (www.iarc.fr/p53/index.html). A high frequency of G:C to T:A mutations is found in high incidence areas of both endemic HBV infection and dietary AFB1 exposure. (Staib et al., 2003)
However, several studies have demonstrated a significant increase in the incidence of HCC in many countries in low incidence areas in the last few decades including areas of previously low incidence such as Northern Europe, Northern America and Japan. This increase reflects the strong impact of environmental factors on the pathogenesis of the
tumor. In areas where Hepatitis C Virus (HCV) infection is frequent, particularly in Japan HCC cases are associated with chronic HCV infection. 80% of HCC cases are associated with chronic HCV infection. In contrast, the prevalence of HBV-associated HCC has been rather stable in most parts of the world; therefore the increase of HCC is linked to increased chronic HCV infection. (Okuda K. 2000) (Figure 1.2)
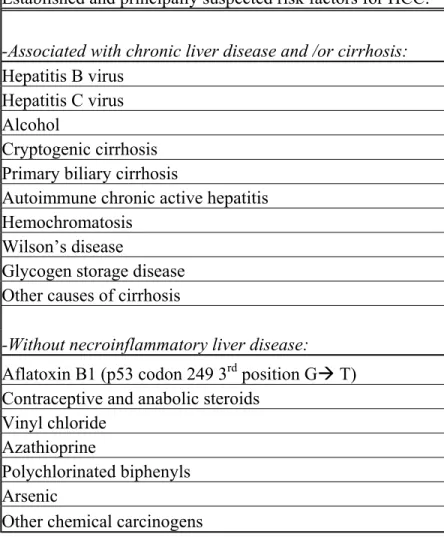
Established and principally suspected risk factors for HCC:
-Associated with chronic liver disease and /or cirrhosis:
Hepatitis B virus Hepatitis C virus Alcohol
Cryptogenic cirrhosis Primary biliary cirrhosis
Autoimmune chronic active hepatitis Hemochromatosis
Wilson’s disease
Glycogen storage disease Other causes of cirrhosis
-Without necroinflammatory liver disease:
Aflatoxin B1 (p53 codon 249 3rd position GÆ T)
Contraceptive and anabolic steroids Vinyl chloride
Azathioprine
Polychlorinated biphenyls Arsenic
Other chemical carcinogens
Figure 1.2: Etiology of HCC. The percentage of worldwide HCC associated with HBV, HCV or other
causes is shown. Data are from GLOBOCAN 2001 and Parkin et al., 2001
1.1.1. HCC Biology
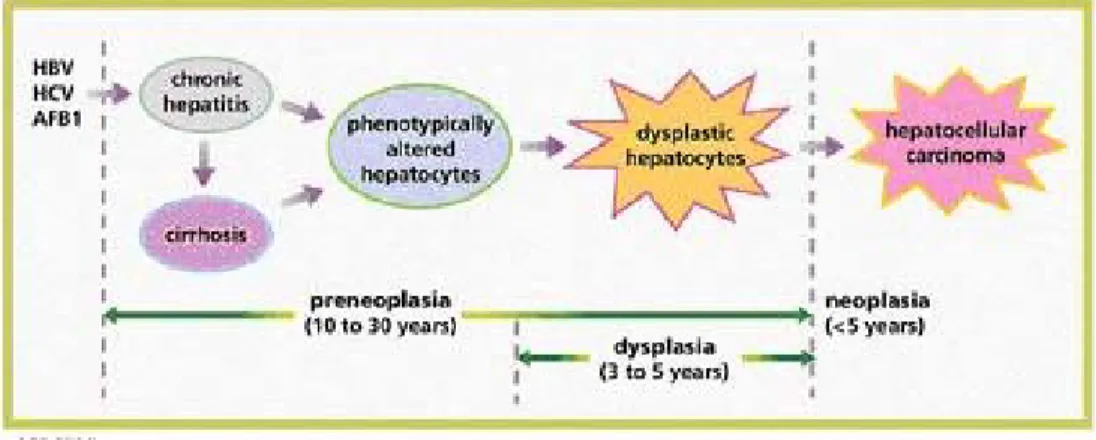
Under normal conditions, adult hepatocytes are non-dividing cells. Only a minor fraction undergoes cell division due to aging or apoptosis. Any type of injury (such as chronic HBV or HCV infection) provokes proliferation of hepatocytes in order to replace defective hepatocytes. (Regeneration). Chronic liver regeneration may itself be a source of spontaneous gene mutations as well as other hepatotoxic factors and lead to genomic instability and progression of liver malignancy. (Cetin-Atalay and Ozturk, 2002)
Figure 1.3: Multistage Hepatocarcinogenesis. (HBV: Hepatitis B Virus; HCV: Hepatitis C Virus;
AFB1: Aflatoxin B1) (Thorgeirsson and Grisham, 2002)
Hepatocarcinogenesis is a multi-step process, which involves genetic alterations that drive the progressive transformation of normal hepatocytes into highly malignant
derivatives. (Figure 1.3) Cancer cells have defects in regulatory circuits that govern normal cell proliferation and homeostasis. Six essential alterations in cell physiology that collectively dictate malignant growth are (Hanahan and Weinberg, 2000):
1) Self-sufficiency in growth signals
Instead of being dependent on exogenous growth factors to stimulate growth and cell proliferation, tumour cells can grow and divide without these exogenous signals. This is often caused by mutations in genes that encode components of the signalling pathways that normally regulate these processes. Such mutations lead to constitutively active growth signalling (eg. mutations in Ras).
2) Insensitivity to growth inhibitory (anti-growth) signals
The growth and proliferation of cells is controlled by the balance of growth promoting signals and growth inhibitory (or anti-growth) signals. The loss of growth inhibitory signals or the loss of the ability to respond to these signals is typical of tumour cells (eg. mutations in Smad4 gene in TGF-beta pathway).
3) Evasion of apoptosis
A critical component of normal tissue homeostasis is apoptosis (programmed cell death). This allows the control of cell number and is also a mechanism for the removal of unwanted cells, for example those with significant damage like genetic damage. Tumour cells have often developed mutations in key genes whose products are involved in apoptosis, causing the blockage of cell death (eg. p53 mutations in HCCs). Another mechanism that can lead to the same functional effect is the over-expression of some genes whose normal function is to encode proteins that suppress cell death (eg. bcl-2).
4) Limitless replicative potential
Normal cells have a restricted replicative potential as a consequence of a number of mechanisms. One important mechanism relates to the progressive shortening of chromosome ends (telomeres) at every cell division. Tumour cells have an unrestricted replicative potential, in part, because they overcome the chromosome shortening by the production of an enzyme called telomerase.
5) Sustained angiogenesis
While tumours grow by the above mechanisms at some point they will stop growing because they will outgrow their blood supply, which provides the necessary nutrients and oxygen. Tumours overcome this problem by the production of various factors that stimulate the formation of new blood vessels (eg. VEGF).
6) Tissue invasion and metastasis
Normal cells resides where they belong and tissue boundaries are normally maintained. Tumours are characterised by invasion into nearby tissues and structures (ie. normal boundaries are not maintained) and may spread to distant sites (metastasis). These properties are the main reason why tumours are such a significant clinical problem.
As mentioned above these characteristics may be gained by accumulation of mutations in the genes that play crucial roles in cellular homeostasis.
1.1.2. HCC Genetics
HCC may be produced by selection of both genomic and epigenetic alterations that compromise more than one regulatory pathway (Thorgeirsson and Grisham, 2002). It has been shown that HCCs display many genetic alterations including polyploidy, allelic imbalance, amplifications, translocations, inverted duplications, deletions, de novo methylation and loss of heterozygosity (LOH). (Cetin-Atalay and Ozturk, 2002; Buendia, 2000; Puig et al., 2001)
There are more than 20 genes involved in at least 4 carcinogenesis pathways that are shown to be altered in HCC. (Buendia et al., 2000). Most of the genes mutated in HCC are tumour suppressor genes and frequent allelic losses (LOH) leading to biallelic inactivation have been described. (Puig et al., 2001) (Table 1.2)
One of them is p53 TSG (tumour suppressor gene) which is frequently mutated in human cancers and its mutations is found in about 30% of HCCs worldwide. The frequency of all p53 mutations varies between 20% (USA) and 67% (Senegal). A
specific mutation in codon 249 of the p53 gene was found in about 50% of HCC in populations exposed to aflatoxin B1 (Mozambique, Senegal, China) and the presence of this hot spot mutation in patients with HCC from Europe, the USA, Japan and Australia is extremely low. (Bressac et al., 1991; Hsu et al., 1991; Oda et al., 1992; Buetow et al., 1992) Activation of the Wnt/wingless pathway can be caused by a stabilizing mutation of β-catenin gene or by an inactivating mutation of the Axin1 gene (Miyoshi et al., 1998; de La Coste et al., 1998; Legoix et al., 1999; Satoh et al., 2000). Somatic mutations of both β-catenin and Axin1 genes have been observed in 20-25% and 5-10% of HCC cases respectively. Less frequently observed in HCC are the inactivating RB1 and p16 mutations. In contrary, inactivation of p16 by homozygous mutation and methylation are shown to be frequent in HCCs. Overexpression of cyclin D1 and increased RB1 degradation by overexpression of gankyrin lead to the alteration of RB1 pathway, this plays a significant role in HCC development. (Zhang et al., 1994; Higashitsuji et al., 2000). Finally, rare IGF2R, SMAD2, and SMAD4 inactivating gene mutations can alter the transforming growth factor β pathway (De Souza et al., 1995; Kawate et al., 1999; Yakicier et al., 1999).
Some genes mutated in Hepatocellular Carcinoma includes:
Frequently mutated genes
P53 (10-50 %)
β-catenin (13-89 %)
Less frequently mutated genes:
M6P/ IGF2R (0-33 %) SMAD2 (0-2 %) SMAD4 (0-6 %) Rb1 (~ 15%) Axin (~ 5%) Cmet (0-30 %) BRCA2 (~5 %) PTEN/MMAC1 (0-5 %) Table1.2: Some genes involved in HCC (modified from Ozturk M., 1999)
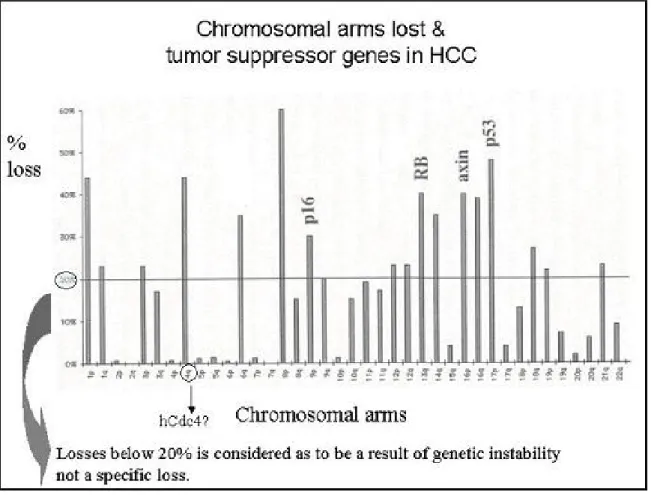
LOH is the most common genetic aberration observed in HCCs. Some chromosomes display frequent losses (more than 20%); which implies that either the development or persistence of these changes is not random. It has been suggested that each frequently effected region may contain one or more genes whose loss or altered function contributes to the development and/or progression of HCC. (Figure 1.4)
Figure 1.4: Frequency of LOH (Loss of Heterozygosity) vs. Chromosomal arms lost in HCC
Although implication of several genes (Table 1.2) have been shown in HCCs, as indicated in figure 1.4 there are still chromosomes that contain unidentified TSGs, In addition, for several chromosomes number of observed mutations or methylations do not correspond to that of LOH. For instance the LOH of several markers on 17p13.3 occurred at a higher frequency than that of p53 locus, which is located on 17p13.1.
These findings suggest the existence of one or more genes involved in HCC on 17p13 in addition to p53 gene. (Zhao et al., 2001)
In addition to LOH studies CGH (Comparative Genomic Hybridization) and microarray studies also reveal that there are still more locus involved in HCCs. In contrast to allelic losses and TSGs, some regions (1p, 6p, 8q, 17q) or genes are consistently amplified or over expressed. (Figure 1.5)
Previously, the amplification and/or overexpression of cyclin D1 and c-Myc have been shown in advanced human HCCs. In addition to the human HCC data, in woodchucks, about 50% of hepatocellular carcinomas arising in animals infected chronically with WHV (woodchuck hepatitis virus). Viral DNA sequences were integrated in or adjacent to c-myc or N-myc genes. On the other hand in a transgenicmice model, overexpression of cyclin D1 issufficient to initiate hepatocellular carcinogenesis. (Nishida et al., 1994; Deane et al., 2001)
All these studies with CGH and microarray data suggest that oncogenic gene activation in addition to TSGs inactivation is important in hepatocarcinogenesis. Thus the β-catenin is not the unique oncogene that is involved in human HCC development.
Altogether, epidemiological, genetic, and biological data suggest there are still genes that participate hepatocarcinogenesis to be identified.
The aim of our study is to identify genes that are involved in HCC development. To achieve this aim we searched the literature for possible candidates that may have role in hepatocarcinogenesis.
Figure 1.5: Summary of gains and losses detected by CGH. Vertical lines on the left of each chromosome ideogram represent loss of chromosomes, whereas
vertical lines on the right correspond to chromosomal gains. Available in http://www.progenetix.de/12048165_P/ideogram.html (Chang et al., 2002)
1.2. hCdc4 /Archipelago / Fbwx7 / SEL10:
Cyclin dependent kinase 2 (cdk2) activated by Cyclin E is involved in the initiation of DNA replication and other S phase events. In parallel with this role, cyclin E protein is accumulated at the G1Æ S phase transition and decreases during early S phase. This increase and decrease is a result of periodic transcription and ubiquitin-mediated proteolysis in control of SCFhcdc4. SCF ubiquitin ligases are composed of a core complex
linked to a variable component, which is called F-box protein that provides substrate specificity. hCdc4 (also designated as Fbwx7 or Ago) is identified as the F-box protein that is involved in the ubiquitin mediated degradation of Cyclin E. Defects in proteolysis of Cyclin E can lead to accelerated entry to S phase leading to genetic instability that may result in tumourigenesis. Indeed, many kinds of HCC tumours show elevated levels of cyclin E protein but not mRNA. (Strohmaier et al. 2001, Moberg et al. 2001, Koepp et al., 2001). It has been found that hCdc4 is mutated in human endometrial tumors (16%), ovarian and breast carcinoma cell lines.
Moberg et al. used Drosophila as model organism to identify the loci that are involved in cellular proliferation. By screening the Drosophila mutants, they identified over 23 loci one of which it was termed as archipelago (ago). Within ago mutant clones, the ommatidial clusters of the retina contained extra cells that seemed to be resulted from extra cell divisions. Therefore, ago-mutant cells were examined for increased level of positive cell cycle regulators and it was found that Cyclin E protein, but no other cyclins or cyclin E mRNA level, is increased. Archipelago protein contained seven WD repeats and an F-box, which is a common signature in SCF complexes that have role in selection of proteins for ubiquitination. Moberg et al. showed that Archipelago could bind to Cyclin E, which may indicate the ability of Archipelago to target Cyclin E for ubiquitination.
Two other groups using yeast as model organism started from the assumption that SCF complex may be involved in turnover of Cyclin E. It was found that levels of Cyclin E
was termed as Fbwx7 (Koepp et al., 2001) or Cdc4 (Strohmaier et al., 2001) was identified. Overexpression of Fbwx7 was shown to decrease the levels of Cyclin E while its inhibition resulted in Cyclin E accumulation (Koepp et al., 2001). Human homologue of yeast Cdc4 (hCdc4) was identified and it was confirmed that this protein is a part of SCF complex and it can ubiquitinate Cyclin E in a phosphorylation dependent manner (Strohmaier et al., 2001). Later, it was shown that this protein is mutated in breast and ovarian carcinoma cell lines. (Schwab and Tyers, 2001; Mitchell A., 2001)
The levels of Cyclin E protein in HCC cell lines that we used in our study are shown in Table 1.3:
Cell lines Cyclin E protein level 1 Huh 7 * 2 BTR * * 3 Focus * * * * 4 MV * * 5 Hep 40 * * * * 6 Hep 3B * * * * 7 Hep G2 * * * * * 8 PLC * * * 9 SK Hep1 * * * 10 Snu 475 * * * * * 11 Snu 449 * * * * * 12 Snu 423 * * * * * 13 Snu 398 * * * * 14 Snu 387 * 15 Snu 182 * *
* very weak band * * weak band * * * band * * * * strong band * * * * * very strong band
1.3. B-Raf
Raf genes were first identified as oncogenes in retroviruses that were causative agents of
tumours in mice and chickens (Rapp et al., 1983; Jansen et al., 1984; Sutrave et al., 1984). Homologues of these genes are found in higher eukaryotes including C. elegans,
D. melanogaster, X. laevis, chicken, mouse, rat and humans. In mammals, three related
genes have been identified, namely A-RAF, B-RAF and RAF1 (also known as C-RAF or C-RAF1). The RAF-1 protein is expressed at high levels in most cell types and tissues. By contrast B-RAF has a highly restricted pattern of expression, mainly expressed in neuronal tissue, testis and spleen (Storm et al., 1990; Luckett et al., 2000; Barnier et al., 1995). However, studies to identify activated versions of raf genes in human cancers showed no consistent correlation. Instead, the motivation for studying Raf proteins with regard to human cancer was the discovery that they are key effectors of Ras proteins (Sutrave et al., 1984), oncogenic mutations of which are detected in a large percentage of human cancers (Bos et al., 1984). Raf proteins play a major role in the conserved Ras/Raf/MEK/ERK pathway, by acting to relay signals from activated Ras proteins via MAPK/ERK kinase 1/2 (MEK1/2) to the p42/p44 MAP kinases or ERK 1/2, the key effectors of this pathway (Marshall et al., 1994; Marais et al., 1996). Raf proteins are activated in a Ras dependent manner. Once activated, they are able to phosphorylate and activate MEK1/2, which in turn phosphorylates and activates ERK1/2. ERKs have many substrates located in different places in the cell including transcription factors, ribosomal proteins, enzymes and cytoskeletal proteins. B-RAF activity in cancer samples has not been studied in detail so far. However, a recent report has now demonstrated the presence of activating mutations of the B-Raf gene in 70% of malignant melanomas and 15% of human colon cancers (Davies et al., 2002). While the B-Raf mutations themselves may not be the actual case of cancers, the high correlation in malignant melanomas suggests that the acquisition of B-Raf mutations are a likely prerequisite for development of these tumours.
Studies on mice with targeted genetic mutations of the raf genes have shown that Raf-1 is dispensable for MEK/ERK activation and that B-RAF appears to be the key MEK/ERK
activator in most tissues and cell types (Wojnowski et al., 2000; Huser et al., 2001; Mikula et al., 2001). In addition, studies on the mechanism of regulation of B-RAF activation have shown that key phosphorylation events take place in B-RAF result to have a higher activity toward MEK than Raf-1 (Mason et al., 1999; Zhang et al., 2000). It seems that B-RAF isotype has different properties that make it stand out from its counterparts, RAF-1 and A-RAF. These properties can explain why this protein is involved in tumour development rather than the other two RAFs.
1.3.1. B-Raf mutations in human cancer:
Missense mutations of the B-Raf gene in approximately 70% of human malignant melanomas and 15% of colorectal cancers were detected by sequencing of 923 cancer samples by Davies et al. (Davies et al., 2002). Mutations were also detected at a low frequency in gliomas, lung cancers, sarcomas, ovarian carcinomas, breast cancers. 89 % of the B-Raf mutations result in amino acid changes within the activation segment, with the V599E (TÆA change at nucleotide 1796) mutation.
Eleven percent of the mutations are found in the glycine residues of the G loop GXGXXG motif in the ATP-binding domain of the kinase domain affecting G463, G465 and G468 (Mercer and Pritchard, 2003).
2. MATERIALS
AND METHODS
2.1 MATERIALS
2.1.1 Chemicals and Enzymes
All enzymes or reagents were purchased from the sources below:
Material Manufacturer
Taq polymerase MBI Fermentas
dNTPs MBI Fermentas
Gene ruler DNA ladder mix MBI Fermentas Mass Ruler DNA ladder mix MBI Fermentas QIAquick Nucleotide Removal Kit Qiagen
QIAEX II Gel Extraction Kit Qiagen
Revert Aid First Strand cDNA Synthesis Kit MBI Fermentas QIAamp RNA Blood Mini Kit Qiagen
NucleoSpin C + T
2.1.2 Equipment and Manufacturers:
Equipment: Manufacturer Micropipettes P10 Gilson P20 Eppendorf P200 Eppendorf P1000 Eppendorf
GeneAmp PCR System 96000 and 24000 Perkin Elmer Gel Tanks
Horizontal Minicell E-C Apparatus Horizontal Midicell E-C Apparatus
Power Supply PAC120 BioRad
UV Transilluminator BioRad Gel Doc 2000 ABI Prism 377 Automated DNA Sequencer Perkin Elmer
2.1.3 Plastic Disposables
The list of plastic disposables used and their manufacturers are listed below:
Disposables Manufacturer
Microcentrifuge Tubes Costar 0.2 ml
1.5 ml 2.0 ml
Test Tubes Costar
15 ml 50 ml
Micropipette Tips Costar
Micropipette Filter Tips Greiner 2.1.4 Solutions
Solutions for Agarose Gel Electrophoresis
EDTA 0.5 M (stock solution), pH 8.0
1X TBE 45 mM Tris-Borate, 1mM EDTA
1X Loading Buffer 0.25 % bromophenol blue, 0.25 % xylene cyanol, 50 % glycerol,
1 mM EDTA
2.2. METHODS
2.2.1 Cell lines
15 HCC cell lines used in the experiments were kindly provided by Mehmet Ozturk’s Group.
Cell Lines Mutational Status 1) Huh 7 P53 mutation 2) Hep3B-TR 3) Focus P53 mutation 4) Mahlavu P53 mutation 5) Hep 40 6) Hep 3B P53 mutation 7) Hep G2 Β-catenin, Ras mutation 8) PLC/PRF/5 P53 mutation 9) SK-Hep1 B-Raf mutation
10) SNU 475 P53 mutation 11) SNU449 P53 mutation 12) SNU423
13) SNU398 Β-catenin, p53 mutation 14) SNU387 P53 mutation 15) SNU182 P53 mutation Table 2.1 :Cell lines used and their mutational status. 2.2.2 Primers
All oligonucleotides were designed by Primer3 program (PCR primer selection tool at Whitehead Institute for Biomedical Research, http://www-genome.wi.mit.edu/cgi-bin/primer/primer3_www.cgi) and were obtained from IONTEK (Istanbul, Turkey).
hCdc4 PRIMER SEQUENCE Length hCdc4-1F 5'-TCTGATAGTCTAGCCAAGGTCCA-3' 23bs hCdc4-1R 5'-TCCATCTCCTCCTCCTCCTCA-3' 21bs hCdc4-2F 5'-AGGAAGATGAAGAACATGCTGGT-3' 23bs hCdc4-2R 5'-TGTAGGTGGCTGGACAGATG-3' 20bs hCdc4-3F 5'-TGTTCAGCAACACCAACAACT-3' 21bs hCdc4-3R 5'-TGGTTCATCAATCCCCTCTT-3' 20bs hCdc4-4F 5'-TCAGACATGTCGCTACTGGAGAA-3' 23bs hCdc4-4R 5'-CCAGTCTCTGCATTCCACACT-3' 21bs hCdc4-5F 5'-TGGATCTACAGATCGGACACT-3' 21bs hCdc4-5R 5'-CTGTCTCCACATCCCAAACA-3' 20bs hCdc4-6F 5'-TGATGGTATCCATGTGGTGAGT-3' 22bs hCdc4-6R 5'-CCCGTTTTCAAGTCCCATAG-3' 20bs hCdc4-7F 5'-ACCAGCTCAGATGATGGAACT-3' 21bs hCdc4-7R 5'-AAGGGCAGGGAGTATATCGT-3' 20bs
B-Raf Primer Sequence Length
BrafG-F 5'-AACACATTTCAAGCCCCAAA-3' 20bs BrafG-R 5'-GCATCTCAGGGCCAAAAAT-3' 19bs BAGN-F 5'-AGGTGATTTTGGTCTAGCTACAGT-3' 24bs BAGM-F 5'-AGGTGATTTTGGTCTAGCTACAGA-3' 24bs BAG-R 5'-TGTGGATCACACCTGCCTTA-3' 20bs Bex11-F 5'-CTTTTGGAGGAGTCCTGAAACT-3' 22bs Bex11-R 5'-ATCCCTCTCAGGCATAAGGT-3' 20bs
2.2.2.1 Primers for hCdc4:
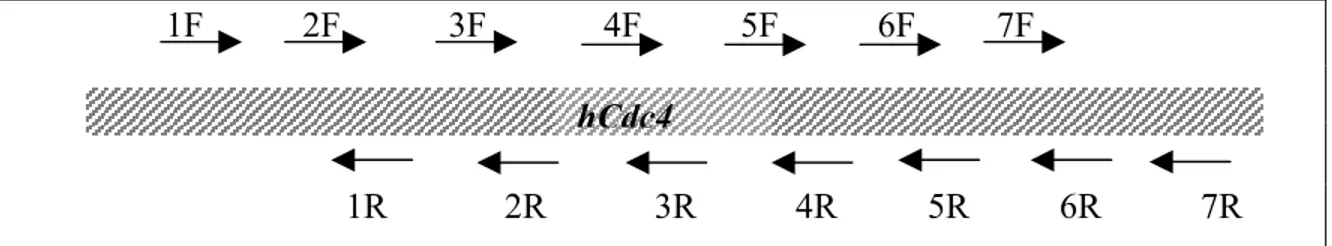
For hCdc4 gene 7 sets of overlapping primers were designed for PCR using cDNA as template. 1F-3R and 4F-7R primer pairs were used for PCR. 15 HCC cell lines were sequenced using primers below (Figure 2.1).
1F 2F 3F 4F 5F 6F 7F
1R 2R 3R 4R 5R 6R 7R Figure 2.1: Positions of hCdc4 specific primers
2.2.2.2 Primers for B-Raf
BrafG-F and BrafG-R primers were used for amplification and sequencing of exon 15 of the B-Raf gene.
Bex11-F and Bex11-R primers were used for amplification and sequencing of exon 11 of
B-Raf gene.
For the ARMS test BAG-M and BAG-R genomic primers were used for the mutated allele of the B-Raf gene and BAG-N and BAG-R primers were used for the normal allele. 2.2.3 Polymerase Chain Reaction
Polymerase Chain Reaction (PCR) is a rapid procedure for in vitro enzymatic amplification of specific desired sequences of DNA. (Mullis and Faloona et al., 1987) There are three distinct events during a PCR cycle:
1) Denaturation of the template: DNA denaturation occurs when the reaction is heated to 92-96 ºC.
2) Primer annealing: After denaturation the oligonucleotide primers hybridize to their complementary single stranded target sequences. The temperature of this
step varies depending on the homology of the primers for the target sequence as well as the base composition of the oligonucleotides.
3) DNA synthesis by the thermostable Polymerase: The last step is the extension of the oligonucleotide primer by the Polymerase. This step of the reaction is carried out at 72 ºC. The larger the template, the longer is the time required for a proper time for the extension. Also, the time for a proper extension time may be increased if the GC content of the template is high.
2.2.3.1 PCR conditions PCR conditions hCdc4 (4F-7R 1264bp) (1F-3R 1047bp) First denaturation 94 ˚C 5' Denaturation 94 ˚C 30'' Annealing 58 ˚C 30'' Extension 72 ˚C 1' 35'' Last Extension 72 ˚C 5' Total Cycles 35 cycles Table 2.3: PCR conditions for hCdc4.
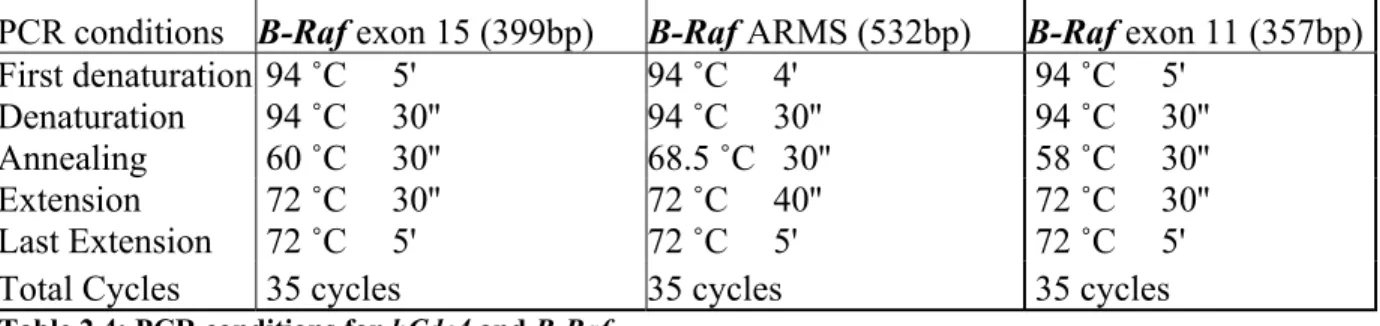
PCR conditions B-Raf exon 15 (399bp) B-Raf ARMS (532bp) B-Raf exon 11 (357bp)
First denaturation 94 ˚C 5' 94 ˚C 4' 94 ˚C 5' Denaturation 94 ˚C 30'' 94 ˚C 30'' 94 ˚C 30'' Annealing 60 ˚C 30'' 68.5 ˚C 30'' 58 ˚C 30'' Extension 72 ˚C 30'' 72 ˚C 40'' 72 ˚C 30'' Last Extension 72 ˚C 5' 72 ˚C 5' 72 ˚C 5' Total Cycles 35 cycles 35 cycles 35 cycles Table 2.4: PCR conditions for hCdc4 and B-Raf.
2.2.3.2 PCR mix
PCR mix: (50µL final volume) 1X PCR buffer (MBI Fermentas) MgCl2 2 mM (MBI Fermentas)
dNTP 0.2 mM (MBI Fermentas) 20 pmol of each primer
2 units Taq Polymerase (MBI Fermentas) 1-2 ng of genomic DNA or 1 µL cDNA
2.2.4 ARMS (Amplification Refractory Mutation System)
ARMS test was performed in order to detect T1796A transversion resulting in V599E aminoacid missense mutation in exon 15 of the B-Raf gene. ARMS is also known as allele-specific PCR (ASPCR) or amplification of specific alleles (PASA). It was first described by Newton et al, 1989. ARMS may be used to detect point mutations and small deletions/insertions. ARMS can generally detect a single copy of the mutant allele in 40 copies of normal allele. This system also leads to fast, reproducible and inexpensive results.
The ARMS primers were designed so that the nucleotide distinguishing between the different alleles was at the 3’ terminal base of the primers (when it is specific to the template it will amplify and when it differs it will not). ARMS PCR consisted of two complementary reactions (two tubes) and utilizing 3 primers. One primer is constant and complementary to the template in both reactions (BAG-R), the other primers (BAGM-F and BAGN-F) differed at their 3’ terminal residues and are specific to either wild type DNA sequence (BAGN-F) or the mutated sequence at a given base. Only one of these allele specific primers was used per tube. If the sample is homozygous wild type amplification only occurred in one of the tubes, if the sample is heterozygous amplification was seen in both of the tubes. The cell lines and HCC tumour samples that are found to be (+) for the mutation were confirmed by sequencing. The tumour samples were kindly provided from Mehmet Ozturk’s group. SK-Hep1 cell line that was found to have the mutation (Davies et al., 2002) was used as (+) control.
2.2.4.1 ARMS primers for normal allele
AAAAATAGGTGATTTTGGTCTAGCTACAGTGAAATCTCGATGGAGTGGGTCCCATCAGTT >>>>>>>>>>>>>>>>>>>>>>>> BAGN-F nnnnnnnnnnnnnnnnnnnnnnnnnnnnnnnnnnnnnnnnnnnnnnnnnnnnnnnnnnn CTGTGTACCCTGTTGAAAAAAAAAACAGGTATGCAATTTAAGGCAGGTGTGATCCACAGC <<<<<<<<<<<<<<<<<<<< BAG-R
2.2.4.2 ARMS primers for the mutated allele AAAAATAGGTGATTTTGGTCTAGCTACAGaGAAATCTCGATGGAGTGGGTCCCATCAGTT >>>>>>>>>>>>>>>>>>>>>>>> BAGM-F nnnnnnnnnnnnnnnnnnnnnnnnnnnnnnnnnnnnnnnnnnnnnnnnnnnnnnnnnnn CTGTGTACCCTGTTGAAAAAAAAAACAGGTATGCAATTTAAGGCAGGTGTGATCCACAGC <<<<<<<<<<<<<<<<<<<< BAG-R
2.2.5 DNA Isolation from cell pellets
DNA isolation from cell lines was performed using NucleoSpin C + T kit (Macherey-Nagel) according to manufacturer’s manual as follows:
~ 25 mg of pellet was placed in 1.5 ml centrifuge tube and 180 µl of buffer T1 was added. 25 µl of proteinase K solution was added and mixed then incubated at 56ºC in shaking water-bath until complete lysis occurs. 200 µl buffer B3 was added to the sample, mixed and incubated at 70 ºC for 10 minutes. 210 µl ethanol was added and vortexed immediately. Then, the sample was applied to Nucleospin cup that was placed in a 2 ml collection tube and centrifuged for 1 minute at 6000 rpm. The filtrate was discarded the spin cup was washed with 500 µl buffer B5 by centrifugation for 2 minutes at 6000 rpm. and flowthrough was discarded. The washing steps were repeated twice. Then the Nucleospin cup placed in the empty collection tube was centrifuged for 2 minutes at 6000 rpm in order to remove buffer B5, which contains ethanol, completely. The Nucleospin cup was placed in a clean 1.5 ml centrifuge tube and DNA was eluted with 100 µl preheated (70ºC) elution buffer BE.
2.2.6 RNA Isolation from cell pellets
RNA isolation from cell lines was performed using QIAamp RNA Blood Mini Kit (Qiagen, catalogue # 52304) according to manufacturer’s manual as follows.
The cell pellet was loosened by flicking the tube and 600 µl buffer RLT (Lysis buffer) was added and pipetted to mix until no cell clumps were visible. The lysate was put into the Qiashredder spin column that was placed in a 2ml collection tube and
centrifuged for 2 minutes at 13000 rpm to homogenize. The column was discarded and 600 µl 70 % ethanol was added to the homogenized lysate then mixed well by pipetting. The sample was pipetted into a QiaAmp spin column placed in a 2ml collection tube and centrifuged for 15 seconds at 10000 rpm. The spin column was transferred into a new collection tube and 700 µl Buffer RW was added into the spin column then centrifuged for 15 seconds at 10000 rpm to wash. Flowthrough was discarded and the column was placed into a new collection tube. 500 µl Buffer RPE was added into the column and centrifuged for 15 seconds at 10000 rpm to wash. 500 µl Buffer RPE was added into the column and centrifuged for 3 minutes at 13000 rpm. The flowthrough was discarded and the column is placed into new collection tube then centrifuged for 1 minute at 13000 rpm to eliminate any chance of possible buffer RPE carryover. To elute, the spin column was placed into a 1.5 ml collection tube and 50 µl of RNase-free water was added directly onto the membrane in the column then centrifuged for 1 minute at 10000 rpm.
2.2.7 Determination of RNA concentration by Spectrophotometry
2 µl of each sample was diluted in 1:500 ratio with sterile ddH2O. Then OD measurement
was done at 260 and 280 nm with the spectrophotometer (Beckman). Concentration of RNA was calculated according to the formula:
[RNA]= OD260 x dilution factor (500) x 40
OD260/ OD280 ratios were calculated in order to check whether there was any protein or
DNA contamination in the RNA samples. The expected ratio was between 1.6-2.0. 2.2.8 cDNA synthesis
cDNA synthesis was performed using RevertAid First Strand cDNA synthesis Kit (MBI Fermentas, #K1622) according to manufacturer’s manual as follows.
5µg of RNA samples were mixed with 1µl of random hexamer primer and ddH2O
in a total volume of 12 µl. After incubation at 70 ºC for 5 minutes, they are directly chilled on ice. After quick spin, 4µl of 5X reaction buffer, 1 µl of Ribonuclease inhibitor and 2µl of 10mM dNTP mix were added and incubated at
25 ºC for 5 minutes. Afterwards, 1 µl of M-MuLV reverse transcriptase was added and incubated first at 25ºC for 10 minutes, then 42 ºC for 60 minutes and finally 70ºC for 10 minutes. Then they were chilled on ice.
2.2.9 Agarose Gel Electrophoresis of DNA fragments
DNA fragments were separated by gel electrophoresis using agarose at concentrations of 1.5 % w/v in 1X TBE. 0.25-0.50 µg of EtBr/ ml of the gel was used to visualize the DNA. DNA samples were loaded into the wells with 1X loading buffer. Electrophoresis was performed by running the gel for about 1 hour at 95 V. PCR products were visualized by UV illuminometer. The length of the DNA fragments was determined by comparing the fragments with molecular weight marker Gene Ruler DNA Ladder mix (MBI Fermentas, Catalogue # SMO333) that had been loaded and run on the same gel. 2.2.10 Gel Extraction of PCR Products
DNA purification of PCR products from agarose gel was performed using QIAEX II Gel Extraction Kit (Qiagen, Catalogue # 20021) according to manufacturer’s manual after running the PCR products on agarose gel and cutting the band from the agarose gel.
1. The DNA bands were excised from the agarose gel with a clean, sharp scalpel by trying to take as little agarose as possible and transferred to a clear microfuge tube.
2. The gel slices were weighed and 3 volumes of Buffer QX1 were added to 1 volume of gel for DNA fragments 100bp-4kb.
3. QIAEX II was resuspended by vortexing for 30 seconds and 20µl QIAEX II was added to the sample.
4. To solubilize the agarose and bind the DNA, the samples were incubated at 50°C for 10 minutes. By vortexing every 2 minutes, QIAEX II was kept in suspension. 5. The sample was centrifuged for 30 seconds and supernatant was carefully
6. To wash the pellet, 500µl of Buffer QX1 was added, to remove residual agarose contaminants. The pellet was resuspended by vortexing then centrifuged for 30sec and all traces of supernatant were removed.
7. The pellet was washed twice with 500µl of Buffer PE (to remove residual salt contaminants). The pellet was resuspended by vortexing then centrifuged for 30sec and all traces of supernatant were removed.
8. The pellet was air-dried for 10-15 minutes or until the pellet becomes white. Over-drying should be avoided, as this may result in decreased elution efficiency.
9. To elute DNA, 20µl of Buffer EB of Qiagen Nucleotide Removal Kit was added and the pellet was resuspended by vortexing then incubated at RT, 5 minutes.
10. After incubation, the samples were centrifuged for 30 seconds then the supernatant containing the DNA was pipetted into a clean tube avoiding to take the Qiaex beads since the beads interferes with enzymatic reactions.
11.
2.2.11 Purification of PCR Products
The amplified DNA fragments were purified with Nucleotide Removal Kit (Qiagen, Catalogue # 28304) to remove excess dNTPs, MgCl2 etc. according to manufacturer’s
manual.
10 volumes of buffer PN (binding buffer) to 1 volume of PCR product were added and mixed by pipetting. The samples were loaded into the spin column placed in the 2 ml collection tube. To bind DNA, the samples were centrifuged for 1 minute at 6000 rpm. The flow-throughs were discarded and the columns were placed back into the same tube. To wash the columns, 750 µl of buffer PE (wash buffer) were added and centrifuged for 1 minute at 6000 rpm. The flow-throughs were discarded and additional 250 µl of buffer PE is added then centrifuged for 1 minute at 6000 rpm. The flow-throughs were discarded and the columns were placed back into the same tube and the empty column were centrifuged for 1 minute at 13000 rpm to remove all residual ethanol which was present in buffer PE. The columns were placed in a clean 1.5 ml tube and 50 µl of Buffer EB (elution buffer) were added into the center of the membrane in the column, let the column stand for 1 minute then centrifuged for 1 min at 13000 rpm.
After purification, concentrations of the PCR products were determined by comparing with Mass Ruler DNA Ladder Mix (MBI Fermentas, Catalogue #SMO403) utilizing agarose gel electrophoresis.
2.2.12 Automated DNA Sequencing
PCR products were sequenced with appropriate primer pairs by ABI Prism 377 DNA Sequencer at Bilkent University, Department of Molecular Biology and Genetics by Tulay Arayici and Yeliz Yuva. For sequencing reactions, DYEnamic ET Terminator Cycle Sequencing Kit (Amersham Biosciences, Catalogue # US81050) was used. Cycle Sequencing utilizes thermostable DNA polymerase and dideoxyncleotides (ddNTPs) are used to create a nested set of DNA fragments with ddNTPs at the 3’ end of each fragment. Since each of the four ddNTPs is labeled with a different color of fluorescent dye, the reaction can be performed in a single tube and the sequence can be determined easily. Electropherograms of each sample were analyzed and the ambiguities in the sequence data were solved by comparing the results of the both forward and reverse primers as well as by comparing with sequences in the NCBI database.
3.1. hCdc4
To screen for alterations in hCdc4 gene, as it contains 13 exons spanning approximately 210 kb of the genome, RT-PCR was performed, followed by direct sequencing on 15 RNAs extracted from HCC cell lines. Two overlapping fragments covering hCdc4 were amplified using 1F-3R and 4F-7R primer pairs. (Figure 3.1)
Figure 3.1: Positions of hCdc4 specific primers. Primers for PCR amplification: 1F-3R and 4F-7R,
Primers for sequencing: 1F to 7R and 1R to 7R.
Analysis of PCR products on agarose gel revealed the expected length of bands for 1F3R and 4F7R, 1047 bp and 1264 bp respectively. (Figure 3.2, Figure 3.3) No smaller and/or extra bands were observed, this suggest that there are no deletions or insertions that can be observed by conventional PCR and gel electrophoresis. Although not quantitative, it can be concluded that there is expression of hCdc4 in all of the cell lines tested since PCR was performed using equal amount cDNA synthesized from equal amount of RNA as template. There was no significant difference in the expression level of both products after 35 cycle of PCR (nested PCR was not performed) under the same PCR conditions between the 15 cell lines tested.
Figure 3.2: RT-PCR analysis of 5’ hCdc4 cDNA using 1F and 3R primers. (1047 bp. product)
Lanes: 1) Huh7 2) Hep3B-TR 3) Focus 4) Mahlavu 5) Hep40 6) Hep3B 7) PLC 8)SK-Hep1 9) Snu475 10) Marker: Gene Ruler DNA Ladder mix
Figure 3.3: RT-PCR analysis of 3’ hCdc4 cDNA using 4F and 7R primers. (1264 bp. product)
Lanes: 1) Marker: Gene Ruler DNA Ladder mix 2) Hep3B 3) HepG2 4) PLC 5) SK-Hep1 6) Snu475 7) Snu449 8)Snu423 9) Snu398 10) Snu387
The PCR products were purified and sequenced using appropriate primers.
Figure 3.4: The sequenced regions of hCdc4 in 15 HCC cell lines. The regions shown in blue correspond
to clear sequence information, the regions shown in gray represents where the sequence information is not clear or missing.
No mutations ( in the F-box, WD domains and previously reported sites where mutations were found in other studies), abnormal transcripts, or no striking change in the transcription level were found among the 15 cell lines tested.
3.2. B-Raf
3.2.1. Exon 15 and Exon 11 Mutations 3.2.1.1. Exon 15 mutations
Genomic DNA from 15 HCC cell lines were analyzed by PCR followed by direct sequencing of PCR products. No sequence alterations were detected except T1796A mutation resulting in V599E change in amino acid sequence of B-Raf in SK-Hep1 cell line, which was previously reported. (Davies et al., 2002)
Figure 3.5: Sequencing result of SK-Hep1 with BrafG-R primer showing the mutation T1796A.
3.2.1.2. Exon 11 Mutations
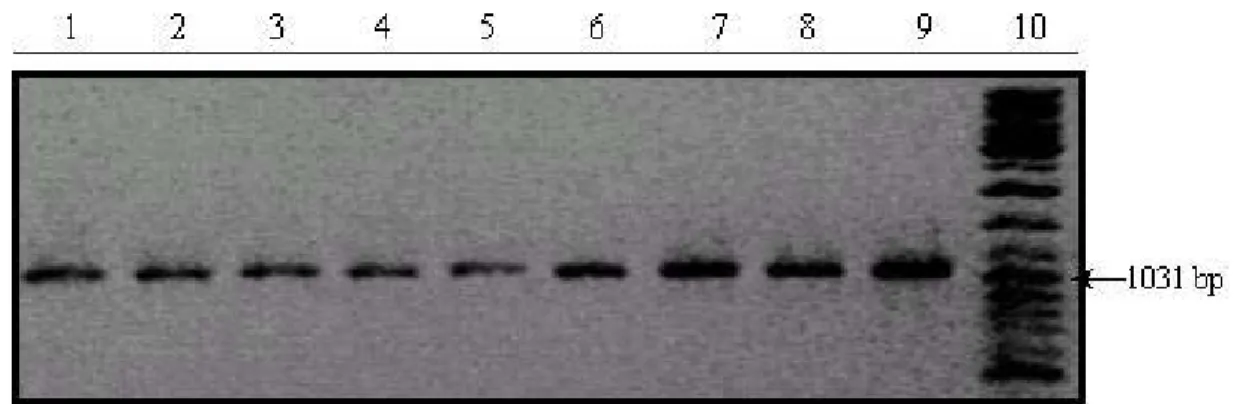
12 HCC cell lines (Huh7, Focus, Mahlavu, HepG2, PLC, SK Hep1, Snu 475, Snu 449, Snu 423, Snu 398, Snu 387, Snu 182) were screened for mutations in exon 11. DNA extracted from 12 HCC cell lines were amplified by PCR (Figure 3.6), purified and sequenced with appropriate primers. No alteration was found in the cell lines in exon 11.
Figure 3.6: B-Raf exon 11 PCR products of HCC cell lines. Lanes: 1) Marker (Gene Ruler DNA Ladder
Mix) 2) SK-Hep1 3) Focus 4) SNU182 5) Huh7 6) Mahlavu 7) HepG2 8) PLC 9) SNU449 10) SNU423 11) SNU398 12) SNU387 13) SNU475 14) Marker (Gene Ruler DNA Ladder Mix)
3.2.2. ARMS
3.2.2.1 ARMS test for HCC cell lines
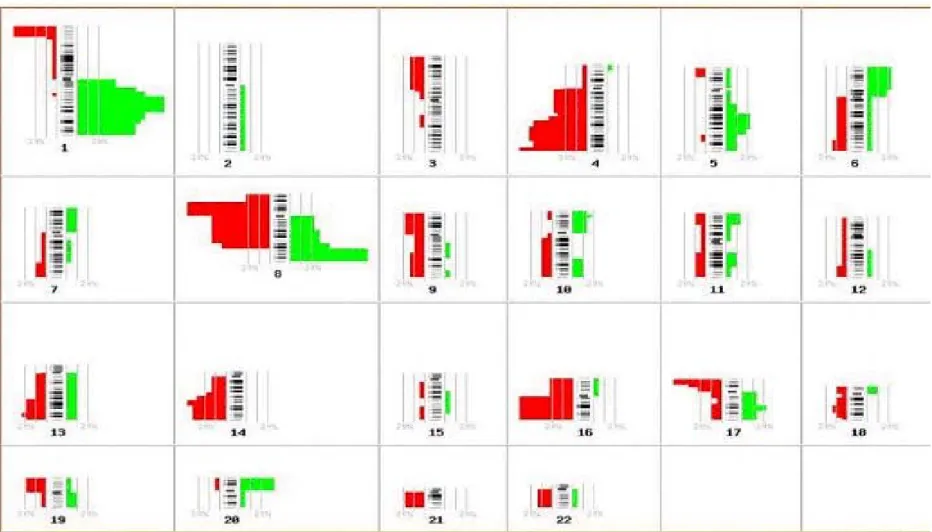
15 HCC cell lines and 58 HCC tumours were screened for exon 15 mutations using ARMS test. (Figure 3.7, 3.8) DNA extracted from cell lines and tumours have been subjected to ARMS test and the positive ones were confirmed via sequencing. V599E mutation in SK-Hep1 cell line (Figure 3.5) was used as (+) control in the experiments.
Figure 3.7: ARMS results of exon15 T1796A mutation for HCC cell lines (a). Lanes: 1) Marker (Gene
Ruler DNA Ladder Mix), 2-3) SK-Hep1, 4-5) Huh7, 6-7) Focus, 8-9) Hep40, 10-11) HepG2, 12-13) PLC, 14-15) SNU398, 16-17) SNU182 18) Marker (Gene Ruler DNA Ladder Mix) N: for the normal allele M: for the mutated allele
Figure 3.8: ARMS results of exon15 T1796A mutation for HCC cell lines (b). Lanes: 1) Marker (Gene
Ruler DNA Ladder Mix), 2-3) SK-Hep1 (+ control) 4-5) SNU387 6-7) Hep3B 8-9) Mahlavu 10-11) SNU475 12-13) SNU423 14-15) SNU449 16-17) SNU182 (- control) 18) Marker (Gene Ruler DNA Ladder Mix)
3.2.2.2. ARMS test for HCC tumours
Figure 3.9: ARMS results of exon 15 T1796A mutation for HCC tumours (a). Lanes: 1) Marker (Gene
Ruler DNA Ladder Mix), 2-3) SK-Hep1 (+ control) 4-5) C14 6-7) T70 8-9) T75 10-11)T78 12) Marker (Gene Ruler DNA Ladder Mix) N: for the normal allele M: for the mutated allele
Figure 3.10: ARMS results of exon 15 T1796A mutation for HCC tumours (b). Lanes: 1) Marker (Gene
Ruler DNA Ladder Mix), 2-3) T39 4-5) N38 (corresponding normal tissue for T39) 6-7) T83 8-9) SNU182 (- control) 10) Marker (Gene Ruler DNA Ladder Mix) N: for the normal allele M: for the mutated allele.
Within 58 tumours tested for V599E mutation, 1 tumour (T39) was found to have the mutation. (Figure 3.10)
In order to confirm the mutation detected in ARMS result, sequencing for sample T39 is performed. Although the mutation couldn’t be seen in the sequencing results, it is obvious in more sensitive ARMS test indicating that proportion of normal cells was high in the sample. (Figure 3.11)
Figure 3.11: Sequencing result with BrafG-R primer for HCC tumour T39. Although mutation cannot
4.1. hCdc4
Several studies have shown that chromosomal deletions at the 4q are associated with human HCCs (76.5% by Shipley et al. and 72.7% by Piao et al.).
Figure 4.1: hCdc4/Fbwx7 gene locus on chromosome 4q
Marker cM AFMB297XA5 141.40 AFMA286XH5 142.00 AFM225XB10 143.80 AFM031XA7 146.40 AFMB336ZA9 146.40 AFM318XG9 146.40 AFM242YE9 146.40 AFM294VH5 152.50 AFM045XC1 153.50 AFM200ZH12 153.60 AFM308ZG5 154.40 AFMA246XD9 155.50 AFMB362XC1 155.70 AFM196XE1 157.90 AFM225ZB2 158.50 AFM290VC5 158.50 AFMA040ZB9 158.50 AFMB337YC1 159.10 AFMA054TD5 160.90 AFM036XG11 161.50
However no TSG involved in liver carcinogenesis has been identified on this chromosome.
On the other hand, there is strong evidence that cyclinE is involved in carcinogenesis. Genetic analyses have revealed that one of the commonlyaltered genes in HCC is the cell cycle regulator cyclin E (Malumbres et al., 2001). Overexpression of cyclinE was found in 70% of HCC patients, which correlated with the poor prognosis of those patients (Jung et al., 2001). In addition, Pascale et al. and Masaki et al. showed that overexpresssion of cyclin E occurred in HCC of chemically induced HCC of Fischer 344 rats and in preneoplastic and neoplastic liver of Long Evans Cinnamon rats (Pascale et al., 2002: Masaki et al., 2000). In fact, overexpression of cyclin E and skp2 (which promotes p27 degradation and thereby activates cyclinE/cdk2) synergistically promote cell cycle progression in cultured hepatocytes in the absence of mitogen or in the presence of growth inhibitors and in vivo; hepatocyte replication and hyperplasia of the liver (Nelsen at al., 2001). These previous data suggest the possibility that cyclin E might play a role in the carcinogenesis or progression of human HCC.
Recently, two research teams have identified a gene mutation that leads to persistently elevated levels of Cyclin E protein and cell proliferation in human tumor cells (Moberg et al, 2001; Strohmaier et al., 2001). Having a role in the regulation of cyclin E expression hCdc4 is proposed to be a TSG and its mutations have been shown in ovarian carcinoma, ALL (acute lymphoblastic leukemia and breast carcinoma cell lines and endometrial tumours. (Moberg et al., 2001; Strohmaier et al. 2001; Spruck et al. 2002). hCdc4 gene mutations were accompanied by loss of heterozygosity and correlated with aggressive disease. The observation of LOH involving 4q in those tumors suggests that hCdc4 gene acts as a tumor suppressor, in keeping with the "two-hit" model. Additional evidence suggests that this newly identified gene, hCdc4, may also be involved in another cancer related pathway, the Notch signaling pathway (Gupta-Rossi et al., 2001).
Interestingly, hCdc4 is located on chromosome 4q where the most frequent LOH observed in HCCs.
Based on these facts; we consider hCdc4 is a good candidate tumour suppressor gene that might be involved in HCC.
The hCdc4 gene is composed of 13 exons spanning approximately 210 kb of the genome. hCdc4 is an F-box protein that involves an F-box and seven WD repeats which is shown to be involved in protein-protein interactions important in substrate recognition for ubiquitination (Bai et al., 1996; Skowyra et al. 1997) of cyclin E, thus targeting it for destruction. F-boxes and WD40 repeats are typically found in proteins that function as the substrate-recognition components of SCF-type ubiquitin ligase (E3) complexes.
1 2 3 4 5 6 7 8 9 10
1) OV 1063 EÆ ter
2) MDAH2774 codon261ter
3) (endometrial tumour) LysÆ Ser, ter codon 376 4) (endometrial tumour) ArgÆter
5) CCRF-CEM RÆC
6) (endometrial tumour) ArgÆHis
7) (endometrial tumour) ArgÆLys, ter codon 476 8) (endometrial tumour) ArgÆGln
9) SK-OV3 RÆL
10) (endometrial tumour) ArgÆter
Figure 4.2: hCdc4 mutations reported previously in cell lines by Moberg et al. (Moberg et al., 2001) and
in endometrial tumours reported previously by Spruck et al. (Spruck et al., 2002)
Observed cancer related mutations were localized on functionally important domains of the protein such as F-box or WD domains (Figure 4.2).
Knudson has proposed that a TSG is inactivated by LOH in one allele and by mutation in the other (Knudson, 1996). Since this hypothesis has developed, homozygous deletions, silencing by methylation were reported for several Tumour Suppressor Genes such as p16, PTEN and SOCS1. (Nagai et al., 2003; Schagdarsurengin et al., 2003; Zhang et al., 2002; Yu et al., 2002)
In this study we performed sequence and expression analysis of hCdc4 gene in 15 HCC cell lines. The transcript levels of hCdc4 were almost the same in all cell lines tested. This suggests that there is no silencing or over expression of hCdc4 in HCC cell lines. Although our RT-PCR method is not quantitative, we would expect to detect drastic change in expression level. We observed expected length of RT-PCR products for all cell lines, which indicate that there was no detectable deletion or insertion of hCdc4 gene in these cell lines. Additionally, our mutation analysis on the hCdc4 using RT-PCR followed by direct sequencing did not reveal any alteration in 15 HCC cell lines. In order to cover all coding region, we sequenced ORF of hCdc4 using primers whose products expected to overlap each other, however we missed some sequencing information for most of the cell lines (see Figure 3.4). But sequencing reads were clear where the most of the mutations described previously (F-box and WD domains). Thus we concluded that there is no mutation on functionally important domains of the protein hCdc4 in HCC cell lines.
Though frequent LOH reported within this region provides the first requirement, in our study no mutation and/or deletion, which may provide the second requirement, or no drastic change in expression level (although our method is not quantitative), which may otherwise indicate silencing by another mechanism, was observed.
The genes that are frequently involved in HCC such as p53, β-catenin and axin are also reported to be frequently mutated in HCC cell lines. (Sayan et al., 2001; Olivier et al., 2002; Satoh et al., 2000; Cagatay and Ozturk, 2002) Since inactivation of hCdc4 due to
homozygous deletions, mutations or methylation was not observed in any HCC cell lines tested, we have not extend this study to the HCC samples.
Altogether these findings suggest that alteration of this gene is not a frequent event in hepatocarcinogenesis. Other genes that may have role in accumulation of cyclin E in HCC should be searched.
4.2. B-RAF
B-Raf gene is located on chromosome 7q34 and encodes a 765 aa. proto-oncogenic
serine-threonine protein involved in transduction of mitogenic signals from the cell membrane to the nucleus via MAP kinase pathway. It belongs to Ser/Thr family of protein kinases.
Figure 4.3: Exons and motifs of B-Raf. Amino acids highlighted in black are identical and those highlighted in gray are similar among A-Raf, Raf-1 and B-Raf. The three conserved regions CR1–3 are highlighted by the black
Figure 4.4: B-Raf protein. CR1, CR2, CR3: conserved domains among Raf-1, A-Raf and B-Raf. CR1
contains two domains that bind to Ras-GTP: Ras binding domain (RBD), Cystein rich domain (CRD), and a putative zinc finger domain. CR2 contains regulatory phosphorylation sites (serine threonine rich residues). CR3 contains the kinase domain (with possible phosphorylation sites indicated).
Raf mutations are found in a wide range of cancers. Missense mutations of the B-RAF gene in approximately 70% of human malignant melanomas and 15% of colorectal cancers were reported (Davies et al., 2002). High prevalence of B-RAF mutations is described in papillary thyroid cancers (Kimura et al., 2003). Mutations were also detected at a low frequency in gliomas, lung cancers, sarcomas, ovarian carcinomas and breast cancers.
It seems that B-RAF activating mutations play an important role in different organ carcinogenesis. Eventhough mutational activation of Ras is not a frequent event in human hepatocarcinogenesis, Ras mutations in few HCC cases were reported. Some animal models treated with carcinogen display also frequent Ras mutations (Boivin-Angele et al., 2000; Barbin A., 2000; Froment et al., 1994) suggesting that RAS-MAP kinase signaling pathway may be important in hepatocarcinogenesis. Recent work by Davies et al. has identified B-Raf mutations in several cancers but no primary HCC samples and only seven HCC cell lines were screened. We therefore decided to determine the incidence of B-Raf mutations in our HCC cell lines and patient population.
Genomic DNA from 15 HCC cell lines is screened for sequence variants using PCR and direct sequencing analysis. Mutation analysis was restricted to exon 11 and 15 of B-RAF gene as all previously reported mutations cluster to these two exons within the G
loop in the ATP binding domain of the kinase domain and the activation segment respectively.
We observed only one V599E mutation in SK-Hep1 cell line that has been reported previously. Since we found V599E mutation in one cell line, we extended our study to additional 58 HCC patient samples restricted to this particular mutation. We used ARMS (allele-specific amplification method) to evaluate the incidence of B-RAF activating mutations in patients with HCC. We found one additional mutation in one HCC sample (T39). In order to confirm the mutation detected in T39 sample we amplified exon 15 with the primers covering this exon and sequenced PCR product directly. We were not able to detect this mutation by direct sequencing. Our result is concordant with those reported previously by Pollock et al. (2002), and explained by higher sensitivity of ARMS method compared to the sequencing. Altogether, we found two tumors displaying BRAF mutations out of 72 samples tested (3%).
Eighty-nine percent of the B-RAF mutations encode amino acid changes within the activation segment, with the V599E (TÆA change at nucleotide 1796) mutation accounting for 92% of these mutations. Other mutations detected within the activation loop at a lower frequency are V599D, L596V, L596R, G595R and F594L. Eleven percent of the mutations are found in the glycine residues of the G loop GXGXXG motif in the ATP-binding domain of the kinase domain affecting G463, G465 and G468. Thus using direct sequencing method on cell lines we would find if one of these mutations were present.
In a very recent report by Tannapfel et al, (2003) neither BRAF nor KRAS mutations were detected in 25 HCC samples. However in our study we found BRAF V599E mutation in 1/58 HCC tumours and 1/15 HCC cell lines giving an overall percentage of 3 %. The difference in the results might be due to etiological factors meaning that differences in the origins of the tumour samples which in our case was African origin. A minor factor might be the cause of the mutation we found and that factor may not be involved in the region from where the tumour samples were taken by the other group.
Our results suggest that B-Raf may be occasionally involved in hepatocarcinogenesis. This is also the case for Ras which is also rarely mutated in human HCCs. Our results together with previously published HCC mutation studies and reports on HCC animal models suggest that MAP kinase pathway might be involved in hepatocarcinogenesis but neither B-Raf nor Ras are the major player of this pathway in this event. Thus, other members of this pathway should be evaluated for mutations in HCC.
5. FUTURE
Given the importance of cyclin E over expression in HCC as well as other cancers, it would not be surprising to see alteration of the cyclin E degradation pathway in these cancers. Our next step will be to find out if the other components of this pathway such as Skp1 and Cul 1 are altered in cancers. It is likely that multiple cyclin E degradation pathways operate in mammals since the Roberts et al. has recently found that another mammalian cullin, Cul3, also influences cyclin E levels in mice and in cell lines (Singer et al., 1999). It would be also interesting to test this gene and identify unknown members of cyclin E degradation pathway.
There is no doubt that Ras/Raf/MEK/ERK signaling pathway is involved in carcinogenesis. However neither B-Raf nor Ras are the major players of this pathway in this event. Thus, other members of this pathway such as RHEB and Rho-GAP will be evaluated for mutations in HCC in the further study.
REFERENCES:
Bai C., Sen P., Hofmann K., Ma L., Goebl M., Harper J.W., Elledge S.J., (1996). SKP1 Connects Cell Cycle Regulators to the Ubiquitin Proteolysis Machinery through a Novel Motif, the F-Box, Cell (86): 263-274
Barbin A. (2000). Etheno-adduct-forming chemicals: from mutagenicity testing to tumor mutation spectra. Mutat. Res. 462(2-3): 55-69. Review.
Barnier J.V., Papin C., Eychene A., Lecoq O., Calothy G., (1995). The mouse B-raf gene encodes multiple protein isoforms with tissue-specific expression. J. Biol. Chem. 270(40): 27023381– 23389.
Boivin-Angele S, Lefrancois L, Froment O, Spiethoff A, Bogdanffy MS, Wegener K, Wesch H, Barbin A, Bancel B, Trepo C, Bartsch H, Swenberg J, Marion MJ. (2000). Ras gene mutations in vinyl chloride-induced liver tumours are carcinogen-specific but vary with cell type and species. Int. J. Cancer. 85(2): 223-7.
Bos J.L. (1989). ras oncogenes in human cancer: a review. Cancer Res. 49(17): 4682–4689. Bressac B, Kew M, Wands J, Ozturk M. (1991). Selective G to T mutations of p53 gene in hepatocellular carcinoma from southern Africa. Nature. 350(6317): 429-31
Brose M.S., Volpe P., Feldman M., Kumar M., Rishi I., Gerrero R., Einhorn E., Herlyn M., Minna J., Nicholson A., Roth J.A., Albelda S.M., Davies H., Cox C., Brignell G., Stephens P., Futreal P.A., Wooster R., Stratton M.R., Weber B.L. (2002). BRAF and RAS mutations in human lung cancer and melanoma. Cancer Res. 62(23): 6997– 7000.
Buendia MA. (2000). Genetics of hepatocellular carcinoma. Semin Cancer Biol. 10(3):185-200. Review.