International Journal of
Intelligent Systems and
Applications in Engineering
Advanced Technology and ScienceISSN:2147-67992147-6799 www.atscience.org/IJISAE Original Research Paper
Surface Roughness Estimation for Turning Operation Based on
Different Regression Models Using Vibration Signals
Suleyman NESELI*
1, Gokhan YALCIN
2, Suleyman YALDIZ
1Accepted : 24/09/2018 Published: 31/12/2018 DOI: 10.1039/b000000x
Abstract: On machined parts, major indication of surface quality is surface roughness and also surface quality is one of the most specified
customer requirements. In the turning process, the importance of machining parameter choice is enhancing, as it controls the required surface quality. To obtain the better surface quality, the most essential control parameters are tool overhang and tool geometry in turning operations. The goal of this study was to develop an empirical multiple regression models for prediction of surface roughness (Ra) from the input variables in finishing turning of 42CrMo4 steel. The main input parameters of this model are tool overhang and tool geometry such as tool nose radius, approaching angle, and rake angle in negative direction. Regression analysis with linear, quadratic and exponential data transformation is applied so as to find the best suitable model. The best results according to comparison of models considering determination coefficient (R2) are achieved with quadratic regression model. In addition, tool nose radius was determined as
the most effective parameter on turning by variance analysis (ANOVA). Cutting experiments and statistical analysis demonstrate that the model developed in this work produces smaller errors than those from some of the existing models and have a satisfactory goodness in all three models construction and verification.
Keywords: Cutting tool geometry, Regression analysis, Surface roughness, Tool-holder overhang, Turning
1. INTRODUCTION
In many manufacturing applications, especially in the aerospace industry, the need for long tool-holder is unavoidable. Such tools are frequently required for the production of parts with deep holes. The determination of optimal tool-holder overhang and cutting tool geometry for specified surface roughness and accuracy of product are the key factors in the selection of machining process. To provide the quality of the process, machining processes are producing methods, usually in relatively short periods and at low cost. In recent years, considerable progress is made so as to investigate the effect of tool overhang and cutting tool geometry parameters on the resultant surface quality during single point diamond turning [1, 2].
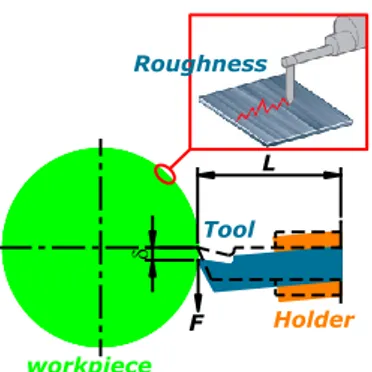
In recent years, due to the need to improve the quality of parts, there has been a push toward decreasing the cutting tool holder deflection in turning. These deflections derive from the machine tool system and the machining process. The errors of the machining process generated in turning originate from a number of sources, however the tool system because of cutting force is one of the major problems for precision machining [3]. Because the tool holder is subject to bending depend on effect point of the
tangential cutting force (F), cutting tool displaced (). This
situation has negative effects on the surface quality as shown in Fig.1.
Based on applications and theoretical approaches, it is known that cutting tools must be clamped as short as possible so as to achieve the desired surface quality of the work piece. For the internal turning method in particular, the cutting tool should be attached with the proper length, not with the shortest distance. This situation may also be the case for external turning processes, depending on the work piece geometry [4].
L F Tool workpiece Holder Roughness
Fig. 1. Deflection of cutting tool and tool-holder, δ due to the tangential force, F.
Kumar et al. [5] displayed the problems because of tool overhang during boring operation. They performed particle damping based on experiments to decrease the vibrations because of the tool overhang and used different metal particles to fill the boring bar for the purpose of damping. The effects of particle based damping on surface roughness are explored. Kassab and Khoshnaw [6] have determined the surface roughness of the work piece by selecting tool overhangs at 25, 30, 35, and 40 mm at different cutting speeds, different depth of cuts, and different feed rates. They studied this during the turning of workpieces made of carbon steel materials to determine the relevance between the tool vibration and the surface roughness. The results showed that the feed rate had the greatest effect on surface roughness and that both surface roughness and vibration increased in parallel with the tool overhang. As the tool overhang shows an increase, so does the tendency of the system to vibrate. In all experiments, the surface roughness increased as the tool overhang increased. Batey and Hamidzadeh [7] fulfilled machining experiments by varying the tool feed rate, spindle speed and tool length to measure the vibration signature for various combinations. They transformed these signatures into the _______________________________________________________________________________________________________________________________________________________________________________________________________________________________________________________________________________________________________________________________
1 Mechanical Engg, Selcuk University, Konya-42002, TURKEY
2 Mechanical Drawing, Konya Teknik University, Konya-42002, TURKEY * Corresponding Author: Email: [email protected]
frequency domain. A natural frequency of lathe components is also calculated. Based on this study, they developed a method so as to determine the source of vibration and for its control. According to their results, an increase in tool length should result in higher flexibility and lower natural frequencies. Kiyak et al. [4] studied the effects of cutting tool overhang on the surface quality and the cutting tool wear in external turning processes. They developed two analytical models to find the deflection of tool at different overhangs. The effects of tool overhang on surface roughness and tool wear were found to be significant. Sardar et al. [8] developed a finite element model to understand the dynamics of tool shank overhang. They performed finite element analyses in order to calculate the frequency at different tool overhang positions, followed by experimental measurement of frequencies at these tool overhang positions. It was concluded that higher tool overhang causes more vibration in the machining system. Amin et al. [9] have performed studies aiming to determine chip form instability in the turning process experimentally. They used a CNMG120408 type insert and three workpiece materials (austenitic stainless steel and AISI 1020 and AISI 1040 carbon steels). To determine the impact of tool overhang, overhang lengths of 40, 50, and 60 mm were selected and no significant chip form instability was observed when the tool overhang length was 40 mm. This situation has been referred to as the rigidity of the tool. Haddadi et al. [10] examined the impact of worn tools and brand new tools on vibration frequency in the turning process experimentally. They examined the effects of rake angle and tool overhang under orthogonal and oblique cutting conditions. In experiments, they used a workpiece made of low carbon steel and high-speed steel tools. The tool overhangs were 20, 30, and 50 mm. In the experimental studies that they conducted using different depth of cuts, the effect of the tool overhang was found to be clearly dependent on the selected experimental parameters. Abouelatta and Mádl [11] established a relationship between the tool life, surface roughness and the tool vibrations. Tool overhang was selected as a variable parameter for experiments along with the cutting speed, tool feed rate, depth of cut, tool nose radius, approach angle, length and diameters of the work piece. They measured the acceleration in both radial and feed directions and the analysis of vibration was carried out by means of Fast Fourier Transforms. Based on their experimental data, suitable regression models were developed. Kassab and Khoshnaw [6] have determined the surface roughness of the workpiece by selecting tool overhangs at 25, 30, 35, and 40 mm at different cutting speeds, different depth of cuts, and different feed rates. They studied this during the turning of workpieces made of carbon steel materials to determine the relevance between the tool vibration and the surface roughness. The results showed that the feed rate had the greatest effect on surface roughness and that both surface roughness and vibration increased in parallel with the tool overhang. As the tool overhang enhances, so does the tendency of the system to vibrate. In all tests, the surface roughness increased as the tool overhang increased.
Tool overhang effects on the quality of surface as a machining parameter, especially during the turning process, has not been reviewed in detail. However, few researchers have reported its importance as one of the cutting tool geometry.
In this study, we investigate the effects of cutting tool overhang and tool geometry on the quality of surface in external turning processes. Three different regression models namely Linear, quadratic and exponential have been used for evaluating their ability to offer reasonable surface roughness prediction model and their results are compared.
2. EXPERIMENTAL DESIGN and SETUP
2.1. Experimental setup
In the present investigation workpieces of 42CrMo4 steel, 40 mm in diameter and 0.250 m in length, were machined using a 2.2 kW Harrison M300 lathe. Under dry unlubricated cases, the
workpieces were machined at cutting speeds of 150 m.min-1, a feed
rate of 0.15 mm.rev-1, a depth of cut of 1.5 mm and with tool
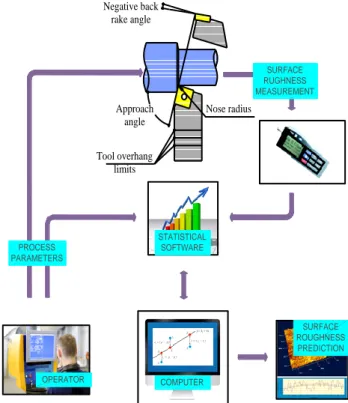
overhangs of 30, 40 and 50 mm. The cutting tools used here are proper for the machining of low carbon steel with ISO P25 quality, which is equal to LC215K code. The inserts were produced by Böhler Inc., with the ISO designation of CNMG 120404-BF, CNMG 120408-BF, CNMG 120412-BF (80° Rhombic inserts). The inserts were mounted rigidly on three different right hand style tool holders designated by ISO as PCLNR/L 2020 K12 AA9, PCLNR/L 2020 K12 AA6, and PCLNR/L 2020 K12 AA3 thus giving back rake angle of -9°, -6° and -3°, respectively. In all instances, the side rake angle is 6°. The experimental set up is shown schematically in Fig. 2. After the experiments, Mahr Perthometer M1 was used to measure the surface roughness and the mean roughness values obtained from three different points of machined surface were calculated.
Negative back rake angle Approach angle Nose radius Tool overhang limits COMPUTER SURFACE ROUGHNESS PREDICTION PROCESS PARAMETERS SURFACE RUGHNESS MEASUREMENT OPERATOR STATISTICAL SOFTWARE
Fig. 2. Schematic diagram for the experimental setup
2.2. Design of experiment
In the past, various methods were used to quantify the impact of machining parameters on part finish quality. Although the processes that previous researchers have utilized are similar in nature, they all vary slightly in their execution. All of the relevant literature includes some kind of design of experiments which allow for a systematic approach to quantify the effects of a finite number of parameters [12]. Most famous statistical tools contain: Taguchi method, variance analysis, regression modelling and response surface methodology, etc. Many researchers [13-15] used these statistical tools to optimize parameters for different machining processes. In the current study, for machining experiments, maximum possible tool overhang length is divided into three different tool overhang positions as per machine tool-holder
logistics. As input parameters, the total four parameters, viz: tool overhang, tool nose radius, approach angle and rake angle are selected accordingly, while the surface roughness is regarded as the broad output parameter. Three different levels for each input parameter (tool overhang, tool nose radius, approach angle and rake angle) are selected for the machining experiments. The parameters and their levels are summarized in Table 1.
Table 1. Process input parameters and their levels
Symbol Factor Unit Level 1 Level 2 Level 3
r Nose Radius mm 0.4 0.8 1.2
κ Approach angle Degree (°) 60 75 90
γ Rake Angle Degree (°) 9 6 3
L Tool overhang mm 30 40 50
With three tool overhang positions and three levels each of tool nose radius, approach angle and rake angle, 81 machining cuts in total are carried out. During each cut, the chip extraction and the environmental conditions are kept similar. The surface roughness was measured with a Mahr Perthometer M1, by using a trace length of 2.5 mm, a cut-off length of 0.8 mm. For the metrology of each machined surface, three linear scans (at 120° to each other) are taken and their average is considered as the representative surface roughness. Special attention is given to tool edge condition and sufficient, special attention is given.
Variation of surface roughness-tool overhang is clear from Fig. 3. The optimum tool overhang for machining is shown in this figure. However, it is not giving any information about optimum tool geometry parameters in which the tool overhang value is required
to be fixed high and very low. In such cases, the other tool geometry parameters need to be optimized in terms of tool overhang. This study is intended to optimize the tool geometry parameters with respect to a fixed tool overhang position depending on surface roughness. Hence, instead of optimizing parameters for each tool overhang, it is decided to perform line wise optimization. The flow chart of experiment design is shown in Fig. 2.
Fig. 3. Effect of tool overhang on surface roughness (Ra) at tool nose Radius 0.4 mm, approach angle 60° and rake angle -3°.
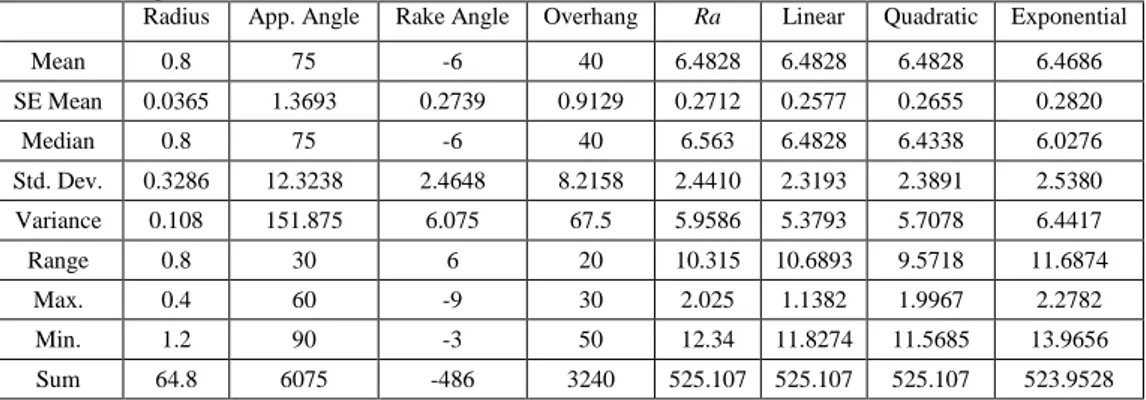
The descriptive statistics of input parameters and output parameters (surface roughness) using in experiments and calculated roughness values with regression analysis can be seen in Table 2. In a data set, a smaller standard deviation indicates less variability in ratings. Ratings with the smallest standard deviation from the mean identified the most reliable of the three sensory method treatments among linear quadratic, and exponential.
Table 2. Descriptive statistics of measurements
Radius App. Angle Rake Angle Overhang Ra Linear Quadratic Exponential
Mean 0.8 75 -6 40 6.4828 6.4828 6.4828 6.4686 SE Mean 0.0365 1.3693 0.2739 0.9129 0.2712 0.2577 0.2655 0.2820 Median 0.8 75 -6 40 6.563 6.4828 6.4338 6.0276 Std. Dev. 0.3286 12.3238 2.4648 8.2158 2.4410 2.3193 2.3891 2.5380 Variance 0.108 151.875 6.075 67.5 5.9586 5.3793 5.7078 6.4417 Range 0.8 30 6 20 10.315 10.6893 9.5718 11.6874 Max. 0.4 60 -9 30 2.025 1.1382 1.9967 2.2782 Min. 1.2 90 -3 50 12.34 11.8274 11.5685 13.9656 Sum 64.8 6075 -486 3240 525.107 525.107 525.107 523.9528 2.3. Methodology
To study the behaviours involved in the process, modelling is defined as a scientific way. Regression method is one of the most widely used statistical techniques. Multiple regression analysis is a multivariate statistical technique used to examine the relationship between a single dependent variable and a set of independent variables. The objective of the multiple regression analysis is to use independent variables whose values are known to predict the single dependent variable. On the basis of the obtained analysis results of the effects of process parameters on the dependent variable and the interaction among the independent variables, regression analysis was next carried out to estimate Ra. In turning, there are many factors which affect the surface roughness like tool variables, workpiece variables, and cutting conditions. Tool variables include tool material, nose radius, rake angle, cutting edge geometry, tool vibration, tool point angle, etc., while workpiece variables comprise material, hardness, and other
mechanical properties. Furthermore, cutting conditions include cutting speed, feed rate, and depth of cut. Since the turning process contains many parameters, it is complex and hard to select the appropriate cutting conditions and tool geometry to achieve the required surface quality [16]. Therefore, some scientific approaches are needed to represent the process. It seems clearly that the proper model selection for the surface roughness is essential for the machining of materials. Modelling of machining processes is important to provide the basis mathematical model for the formulation of the objective function. A model developed for machining process is the relationship between two variables which are decision variable and response variable in terms of mathematical equations. Therefore, the minimization of the Ra must be formulated in the standard mathematical model [17]. In order to accurately model the surface roughness in turning, one needs to first understand why current models fail.
0 1 2 3 4 30 40 50 S u rf ace R o u g h n es s (µm )
Fig. 4. Roughness profile characteristics.
The surface roughness average Ra is generally described on the basis of the ISO 4287 norm, which is the arithmetical mean of the
deviations of the roughness profile from the central line (lm) along
the measurement (see Fig. 4). Average roughness (Ra) of the surface is calculated from the following equation [18].
0 1 ( , ) a R Z x y dxdy S
(1)where Z(X, Y) is the elevation for a given point, and S0 is the
projected area of the given area. A basic theoretical model for surface roughness, that is, the difference between the actual surface area and the geometrical surface area, was also calculated from the following model: 2 32e f Ra r (2)
where f is feed rate and re is the tool nose radius. According to this
model, one needs only a decrease the feed rate or an increase the tool nose radius to develop desired surface roughness. However, there are several problems with this model. Firstly, it does not take into account any imperfections in the process, such as tool vibration or chip adhesion. Secondly, there are practical limitations to this model, since certain tools (such as CBN) require specific geometries to improve tool life [12, 19]. Many researchers have studied the impact of cutting factors on surface roughness using regression analysis. However, the effects of insert edge geometry are not included in those models. There are three main effects leading to the degradation of surface roughness: tool nose Radius, approach angle and rake angle.
In planning and conducting the experiment, DoE 3k full factorial
were used. Selected factors of experiment have changed in 3 levels of value. This method allows investigating the wider interval of parameters and the predicted mathematical model is more reliable [20]. The next step was to estimate the model.
3. RESULTS and DISCUSSION
3.1. Development of Regression Model
In this section, linear, quadric and exponential regression equations are introduced for Ra values and model factor effects are provided. Optimum regression model was detected according to coefficient
of determination (R2), is a number that indicates how well data fit
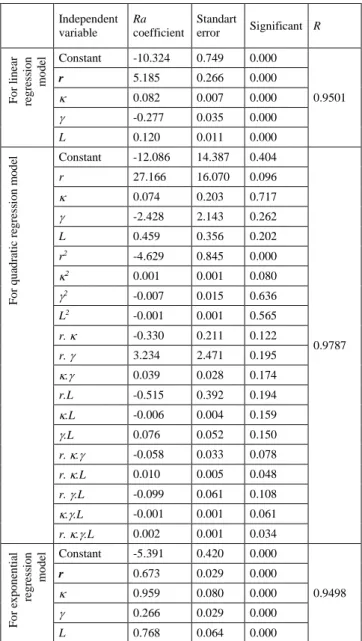
a statistical model. Ra is dependent variables while r, κ, γ and L are independent variables in regression models. Linear, quadratic and exponential regression modelling and analysis of variance (ANOVA) for Ra values are developed using Statistica software. The correlation coefficients (R) value of modelled independent variable Ra is given in Tables 3, respectively.
In the next step, Ra estimation procedures were performed by creating mathematical (linear, quadratic and exponential) equations. When Table 3 is examined, it can be seen that the highest correlation of R=0.9787 was obtained for Ra. Moreover,
Ra was estimated through the second degree interaction regression
equation which includes all input parameters and the determination
coefficient of R2=0.9579 was statistically significant and consistent
(Fig. 5b).
By transferring the coefficients value of independent variables (Tables 1) into Table 4, the regression model and the determination
coefficient (R2) for Ra values can be written in the Table 4.
Table 3. Regression coefficients values for Ra Independent variable Ra coefficient Standart error Significant R F o r li n ea r re g re ss io n mo d el Constant -10.324 0.749 0.000 0.9501 r 5.185 0.266 0.000 0.082 0.007 0.000 -0.277 0.035 0.000 L 0.120 0.011 0.000 F o r q u ad ra ti c re g re ss io n m o d el Constant -12.086 14.387 0.404 0.9787 r 27.166 16.070 0.096 0.074 0.203 0.717 -2.428 2.143 0.262 L 0.459 0.356 0.202 r2 -4.629 0.845 0.000 2 0.001 0.001 0.080 2 -0.007 0.015 0.636 L2 -0.001 0.001 0.565 r. -0.330 0.211 0.122 r. 3.234 2.471 0.195 . 0.039 0.028 0.174 r.L -0.515 0.392 0.194 .L -0.006 0.004 0.159 .L 0.076 0.052 0.150 r. . -0.058 0.033 0.078 r. .L 0.010 0.005 0.048 r. .L -0.099 0.061 0.108 ..L -0.001 0.001 0.061 r. ..L 0.002 0.001 0.034 F o r ex p o n en ti al re g re ss io n mo d el Constant -5.391 0.420 0.000 0.9498 r 0.673 0.029 0.000 0.959 0.080 0.000 0.266 0.029 0.000 L 0.768 0.064 0.000
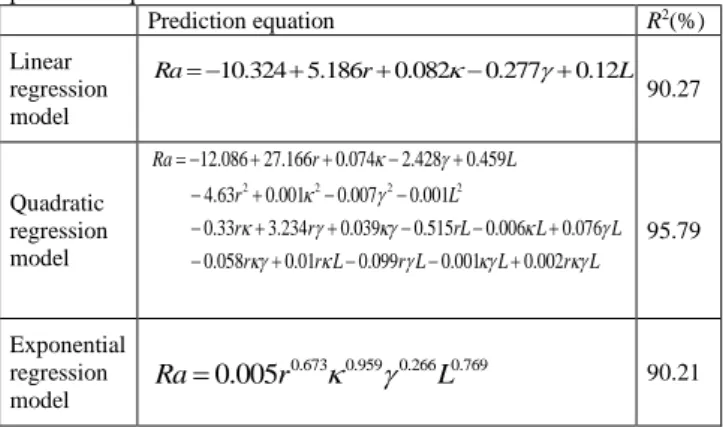
Table 4. Linear, quadratic and Exponential effects of manually taken Ra prediction equations. Prediction equation R2(%) Linear regression model 10.324 5.186 0.082 0.277 0.12 Ra r L 90.27 Quadratic regression model 2 2 2 2 12.086 27.166 0.074 2.428 0.459 4.63 0.001 0.007 0.001 0.33 3.234 0.039 0.515 0.006 0.076 0.058 0.01 0.099 0.001 0.002 Ra r L r L r r rL L L r r L r L L r L 95.79 Exponential regression model 0.673 0.959 0.266 0.769 0.005 Ra r
L 90.21Equations in Table 4 are used to calculate the predicted Ra values. The line pattern data of Ra values of the experimental data vs. predicted Ra values of regression model are compared in Fig. 5.
a) Comparison of the linear regression predictions and experimental alues for Ra
b) Comparison of the quadratic regression predictions and experimental values for Ra.
c) Comparison of the exponential regression predictions and experimental values for Ra
In this study, experimental measured and obtained Ra values were evaluated by using regression models that developed Statistica software. When the Ra values are examined together, quadratic equation gives closer results to experimental values than the other regression models. This means that quadratic equation estimates the surface roughness better when compared to other regression models. By using the all values, the correlation coefficients result in 0.9787, 0.9501 and 0.9498 for experiment- quadratic, linear and exponential models, respectively. As the correlation coefficients get closer to 1, estimation accuracy increases. In the case presented in this study, the correlation coefficients obtained are very close to 1, which indicates a perfect match between regression models estimation values and experimental measurement values (Fig. 6).
Fig. 6. The relationship between manual measurements and the values of regression for Ra
3.2. ANOVA Analysis
For machining process ANOVA can be useful on the one hand to determine the influence of given input parameters from a series of experimental results by design of experiments and on the other hand it can be used to interpret experimental data. The ANOVA tables consist of sum of squares and degrees of freedom (DoF). The mean-square is the ratio of sum of squares to degrees of freedom and F ratio is the ratio of mean square to the mean square of experimental error. In robust design F ratio can be used for qualitative understanding of the relative factor effects. A large
value of F means that the effect of a given factor is large compared to the error variance so, the larger value of F, the more important the given factor influencing the process response.
Table 5 gives the result of the ANOVA with the surface roughness
Ra. This was performed for significance level of =0.05, i.e. for a confidence level of 95%. A low P-value shows a statistical significance for the source on the corresponding response [16]. The last column of the tables shows the percentage of contribution (PC%) of each parameter on the total variation. The greater the percentage contribution, the greater the influence a parameter has on the result.
Table 5. Analysis of variance for all regression models DoF Seq SS AdjMS F-value PC%
F o r li n ea r m o d el Intercept 1 115.88 115.88 190.04 24.31 r 1 232.31 232.31 380.99 48.73 1 82.58 82.58 135.44 17.32 1 37.22 37.22 61.04 7.81 L 1 78.23 78.23 128.30 16.41 Error 76 46.34 0.61 Total 80 476.68 F o r q u ad ra ti c m o d el Intercept 1 0.23 0.23 0.71 0.05 r 1 0.94 0.94 2.86 0.20 1 0.04 0.04 0.13 0.01 1 0.42 0.42 1.28 0.09 L 1 0.55 0.55 1.66 0.11 r2 1 9.88 9.88 30.03 2.07 2 1 1.04 1.04 3.16 0.22 2 1 0.07 0.07 0.23 0.02 L2 1 0.11 0.11 0.33 0.02 r. 1 0.81 0.81 2.45 0.17 r. 1 0.56 0.56 1.71 0.12 . 1 0.62 0.62 1.89 0.13 r.L 1 0.57 0.57 1.73 0.12 .L 1 0.67 0.67 2.04 0.14 .L 1 0.70 0.70 2.12 0.15 r. . 1 1.06 1.06 3.21 0.22 r. .L 1 1.34 1.34 4.08 0.28 r. .L 1 0.87 0.87 2.66 0.18 ..L 1 1.20 1.20 3.65 0.25 r. ..L 1 1.54 1.54 4.68 0.32 Error 61 20.06 0.33 Total 80 476.68 F o r ex p o n en ti al m o d el Intercept 1 2.36 2.36 164.52 16.92 r 1 7.55 7.55 526.01 54.08 1 2.05 2.05 142.56 14.66 1 1.18 1.18 82.31 8.46 L 1 2.09 2.09 145.71 14.98 Error 76 1.09 0.01 Total 80 13.96
From the analysis in Table 5, the most significance factor for F-value is the linear and quadratic effect of tool nose radius with 380.99, 30.03, 526.01 F ratio for linear, quadratic and exponential regression models, respectively. Also there isn’t a strong relation
between independent variables and dependent variable because of low determination coefficient value of linear and exponential regression models comparing with quadratic model determination coefficient value. This is a good agreement with the previous researcher’s works [21, 22]. Here are the cutting parameters which mainly control the final result and especially the roughness of the machined surface. This is the technical result that is usually searched.
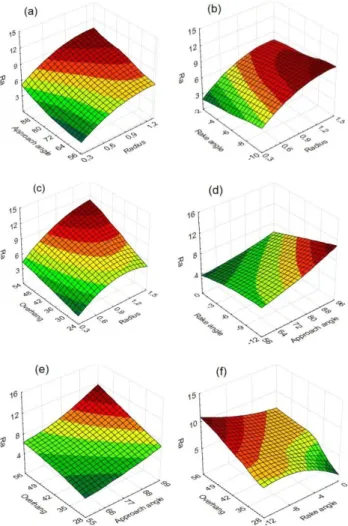
3.3. Graphical Analysis
The response surface is plotted (Fig. 7a–f) so as to search the effect of process variables on the end of surface. The response surface plots represent the regression equations which are used to describe the relationship between the response and experimental levels of each parameter. From Fig. 7a, c, e, the surface roughness Ra has an increasing trend with the increase of radius, overhang and approach angle. From Fig. 7b, d, f it is seen that, Ra decreases with the decreases of depth of nose radius. It can be noted that from Fig. 7, tool nose radius has the most effect on surface roughness and its variation is very high when compared to other parameters. The best surface roughness was achieved at the lowest radius, approach angle and overhang and highest rake angle combination as expected. This is an established fact that more vibrations are resulted from high value of tool overhang and nose radius. Similarly, with the increasing approach angle, the cutting force increases as well. Thus, at this time vibration is born.
Fig. 7. 3D Response surface plots for Ra vs. input factors
4. CONCLUSION
In this study, the behaviour of tool overhang and cutting tool geometry in single turning point and its influence on the quality of
surface through a series of its interaction with the other machining parameters (viz: tool nose radius, approach angle and rake angle) are investigated. A series of machining operations are performed in the sequential combinations of tool overhang, tool nose radius, approach angle and rake angle. The surface quality is analysed in terms of linear, quadratic and exponential regression analysis and ANOVA. The regression analyses are used to predict the surface roughness by means of suitable modelling operations. The followings are the conclusions based on the study above:
In single point turning, the tool overhang influences the quality
of surface significantly. Extreme values of tool overhang result in poor surface quality. From the experiments carried out on the machining parameters, it was observed that the surface roughness of work piece increases as the tool overhang increases. The optimum range of tool overhang is 30 mm. Using the same tool overhang, the surface roughness of the work piece shows an increase as the tool nose radius and approach angle increases. In the measurements performed after the experiments were complete, it was seen that the cutting tool deflection values increased together with the tool overhang.
Also, strong interaction among all input process parameters is
observed and validated. Thus, the selection of the other machining parameters are affected by the tool overhang as well considerably.
Rake angle parameter adversely affects surface finish.
Equations which were derived by multi-regression modelling
techniques can be used for surface roughness modelling of turning process that can’t be computed by theoretically.
Surface roughness value can be predicted with an acceptable
accuracy with the usage of linear, quadratic and exponential regression models. The result of comparison between these
models and coefficient of correlations (R2) for predicted
surface roughness shows that prediction performance of the quadratic model is slightly better than the others.
In the future, real time monitoring, optimization, model
referenced adaptive control of the process can be studied while different parameters would be added.
References
[1] Mishra, V., Khan, G.S., Chattopadhyay, K.D., Nand, K., and Sarepaka, R.G.V., “Effects of tool overhang on selection of machining parameters and surface finish during diamond turning”, Measurement 55, 353-361, (2014).
[2] Kotkar, D.R., Wakchaure, V.D., “Vibration control of newly designed Tool and Tool-Holder for internal treading of Hydraulic Steering Gear Nut”, International Journal Of Modern Engineering Research 4(6), 46-57, (2014).
[3] Hadi, Y., “Dynamic Deflection of Periodic Cutting Tool Holder Based on Passive Model”, International Journal of Mechanical & Mechatronics Engineering 11 No: 06, (2011). [4] Kiyak, M., Kaner, B., Sahin, I., Aldemir, B., and Cakir, O.,
“The Dependence of Tool Overhang on Surface Quality and Tool Wear in the Turning Process”, International Advanced Manufacturing Technology 51(5), 431-438, (2010).
[5] Sathishkumar, B., Mohanasundaram, K.M. and Senthilkumar, M., “Experimental studies on impact of particle damping on surface roughness of machined components in boring operation”, European Journal of Scientific Research 71(3), 327-337, (2012).
[6] Kassab, S.Y., and Khoshnaw, Y.K., “The effect of cutting tool vibration on surface roughness of workpiece in dry turning operation”, International Journal of Engineering Science and Technology 25(7), 879-889, (2007).
[7] Batey, M.C., and Hamidzadeh, H.R., “Turning process using vibration signature analysis”, Journal of Vibration and Control 13(5), 527-536, (2007).
[8] Sardar, N., Bhaumik, A., Mandal, N.K., “Modal analysis and experimental determination of optimum tool shank overhang
of a lathe machine”, Sensors & Transducers Journal 99(12), 53-65, (2008).
[9] Amin, A.K.M.N., Nashron, F.R. and Zubaire, W.W.D., “Role of the frequency of secondary serrated teeth in chatter formation during turning of carbon steel AISI 1040 and stainless steel”, Proceeding 1st International Conference & 7th AUN/SEED-Net, Field-wise Seminar on Manufacturing and Material Processing, 181-186, (2006).
[10] Haddadi, E., Shabghard, M.R. and Ettefagh, M.M., “Effect of different tool edge conditions on wear detection by vibration spectrum analysis in turning operation”, Journal of Applied Sciences 8(21), 3879-3886, (2008).
[11] Abouelatta, O.B. and Mádl, J., “Surface roughness prediction based on cutting parameters and tool vibrations in turning operations”, Journal of Materials Processing Technology 118, 269-277, (2001).
[12] Özel, T. and Karpat, Y., “Predictive modeling of surface roughness and tool wear in hard turning using regression and neural networks”, International Journal of Machine Tools & Manufacture 45, 467-479, (2005).
[13] Adalarasan, R., Santhanakumar, M. and Rajmohan, M.,
“Optimization of laser cutting parameters for
Al6061/SiCp/Al2O3 composite using grey based response surface methodology (GRSM)”, Measurement, 73, 596-606, (2015).
[14] Debnath, S., Reddy, M.M. and Yi, Q.S., “Influence of cutting fluid conditions and cutting parameters on surface roughness and tool wear in turning process using Taguchi method”, Measurement, 78, 111-119, (2016).
[15] Asiltürk, İ., Neşeli, S. and İnce, M.A., “Optimisation of parameters affecting surface roughness of Co28Cr6Mo medical material during CNC lathe machining by using the Taguchi and RSM methods”, Measurement, 78, 120-128, (2016).
[16] Singh, D. and Rao, P.W., “A Surface roughness prediction model for hard turning process”, International Journal of Advanced Manufacturing Technology, 32(11–12), 1115– 1124, (2007).
[17] Zain, A.M., Haron, H., Qasem, S.N. and Sharif, S., “Regression and ANN models for estimating minimum value of machining performance”, Applied Mathematical Modelling, 36, 1477-1492, (2012).
[18] Arbizu, P.I. and Pérez, C.J.L., “Surface roughness prediction by factorial design of experiments in turning processes”, Journal of Materials Processing Technology, 143–144, 390-396, (2003).
[19] Thiele, J.D., Melkote, S.N., Peascoe, R.A. and Watkins, T.R., “Effect of cutting-edge geometry and workpiece hardness on surface residual stresses in finish hard turning of AISI 52100 steel”, ASME Journal of Manufacturing Science and Engineering, 122, 642-649, (2000).
[20] Montgomerty, D.C., “Design and Analysis of Experiments”, eighth ed., John Willey&Sons Inc., New York, (2013). [21] Asilturk, I., Celik, L., Canlı, E., and Onal, G., “Regression
Modeling of Surface Roughness in Grinding”, Advanced Materials Research, 271(273), 34-39, (2011).
[22] Tasdemir, S., Urkmez, A., and Inal, S., “Determination of body measurements on the Holstein cows using digital image analysis and estimation of live weight with regression analysis”, Computers and Electronics in Agriculture, 76, 189-197, (2011).