cis-Bis(imidazole)bis(picolinato)copper(II) Dihydrate
[Cu(pic)
2(im)
2] ·2H
2O
Zerrin Herena, Cem Kesera, C. C¨uneyt Ersanlıb, O. Zafer Yes¸ilelc, and Orhan B¨uy¨ukg¨ung¨orb
aOndokuz Mayis University, Faculty of Arts and Sciences, Department of Chemistry, TR-55139, Kurupelit, Samsun, Turkey
bOndokuz Mayis University, Faculty of Arts and Sciences, Department of Physics, TR-55139, Kurupelit, Samsun, Turkey
cEskis¸ehir Osmangazi University, Faculty of Arts and Sciences, Department of Chemistry, TR-26480, Eskis¸ehir, Turkey
Reprint requests to Dr. Z. Heren. E-mail: [email protected] Z. Naturforsch. 61b, 1072 – 1078 (2006); received February 1, 2006
The mixed-ligand picolinato (pic) complex of Cu(II) with imidazole (im), [Cu(pic)2(im)2]·2H2O, was synthesized and characterized by elemental analysis, magnetic susceptibility, spectral methods (UV/vis and FT-IR), simultaneous TG, DTA techniques, mass spectroscopy, and X-ray diffraction. The complex crystallizes in the monoclinic space group Cc with the following unit cell parameters: a= 16.381(1), b = 9.556(1), c = 5.177(1) ˚A,β = 119.074(5)◦, Z= 4. In the octahedral complex, the picolinato ligands are coordinated to the copper(II) ion as bidentate N,O-donors forming chelate rings. The imidazole ligands are N-coordinated at cis positions. The thermal decomposition pathway of the complex has been studied by the help of thermal analyses data (TG and DTA) and of the mass spectroscopic fragmentation pattern. The volatile products observed in the thermal decomposition process were also observed in the mass spectrometer ionisation process, except for the molecular peak, and it was concluded that the ionisation and thermal decomposition pathways of the complex resemble each other.
Key words: Picolinic Acid, Imidazole, Copper(II) Complex, Thermal Decomposition
Introduction
Pyridinecarboxylic acids and their derivatives are present in many natural products. They are also of special interest to medicinal chemists because of the wide variety of physiological properties displayed by the natural and also many synthetic derivatives [1]. For example, picolinic acid is one of the metabolites of tryptophan [2]. Zinc(II) pyridine 2-carboxylate has healing effects against Herpes Simplex virus [3]. The picolinic acid (pyridine 2-carboxylic acid, pic) is the body’s prime natural chelator. The picolinato ligand is able to chelate with metal ions and can display widely varying coordination behaviour function as a multiden-tate ligand. It is the most efficient chelator for metal cations such as chromium, zinc, manganese, copper, iron and molybdenum when they are in the body. One of the ways to understand chemistry and properties of the picolinic acid is to study the structures of its metal complexes [4 – 7]. Imidazole is a very important model
0932–0776 / 06 / 0900–1072 $ 06.00 © 2006 Verlag der Zeitschrift f ¨ur Naturforschung, T ¨ubingen· http://znaturforsch.com molecule since the imidazole ring occurs in a series of biological molecules such as in histidine, in Vita-min B12 and biotin as well as in many chemotherapic agents [8].
In this paper, we report the preparation, charac-terization by FT-IR and UV/vis measurements, ther-mal analyses data (TG and DTA), mass spectro-scopic fragmentation pattern, and crystal structure of the cis-bis(imidazole)bis(picolinato)copper(II) di-hydrate complex.
Results and Discussion
IR spectra
In the IR spectrum of the complex the broad band at 3435 cm−1 corresponds to the vibration of water molecules. The bands that appear at 3108 and 2992 cm−1 are due the absorption bands of the NH moiety of imidazole. In the IR spectrum of the
Z. Heren et al.· cis – Bis(imidazole)bis(picolinato)copper(II) Dihydrate 1073 free picolinic acid there is a strong absorption band
at 1730 cm−1 for the COOH group. In the IR spec-trum of the Cu(II) complex this absorption band is ab-sent and the band due to the asymmetric stretchυasym (COO−) and symmetric stretchυsym (COO−) are ob-served at 1643 and 1353 cm−1, respectively. The dif-ferenceυasym (COO−) and υsym (COO−) being 290 can be taken as a proof of unidentate coordination of the carboxylate group to the central atom [9]. This is in good agreement with the results obtained from X-ray diffraction measurements. In the complex, the band at 1595 cm−1 can be attributed to the (–C=N–) stretching vibration. The M–O stretching vibration of the complex was observed at 455 cm−1.
UV/vis spectra and magnetic susceptibility
The electronic spectrum of the [Cu(pic)2 -(im)2]·2H2O in water exhibit a broad absorption band at 642 nm (ε = 41.0 Lmol−1cm−1) due to the d-d transition and a shoulder at 590 nm (ε = 25.0 Lmol−1cm−1) assigned to the Jahn-Teller effect. Thisλmaxvalue was assigned to the2Eg→2T2g transition. The∆o value for the complex was calcu-lated as 15,576 cm−1, since there is only one transition for d9 complexes [10]. The absorption bands below 300 nm are due to intra-ligand transitions.
The magnetic susceptibility value of the complex is 1.67 BM corresponding to one unpaired electron. Thermal analysis
Thermal analyses curves of the complex (TG and DTA) are given in Fig. 1. The thermal behaviour of the complex was followed up to 600◦C in a static air atmosphere. The first stage of the thermal
decompo-Fig. 1. The TG and DTA curves of the [Cu(pic)2 -(im)2]·2H2O complex.
sition starts at 65 ◦C with the release of two crystal water molecules associated with an endothermic effect (DTAmax78◦C; found 7.52%; calcd. 7.50%). The sec-ond stage in the 135 – 302◦C temperature range corre-sponds to the exothermic elimination of two moles of imidazole ligands (DTAmax161◦C). The experimental mass loss of 27.79% agrees well with the calculated mass loss of 28.37%. The decomposition of the two pi-colinato ligands occurs in the third stage between 305 and 460◦C with one violently exothermic DTA peak at 347 ◦C. The final decomposition product CuO, was identified by IR spectroscopy (found 81.67%; calcd. 83.43%).
Analysis of the mass spectrum
The mass spectrum of any substance mainly re-veals the most delicate and fragile points present in the structure of a molecule. It was assumed that the thermal process somewhat resembles the ionisation process [11, 12]. For this purposes, the mass spec-trum of [Cu(pic)2(im)2]·2H2O complex was recorded to establish a relation between the thermal and ionisa-tion process to formulate more appropriately the ther-mal decomposition pathway. The mass spectrum was recorded by the FAB technique. It is not very compli-cated and only a few major peaks appeared in signifi-cant quantities. No molecular ion peak was observed. Absence of the molecular peak may indicate that al-most all of the molecular ion is decomposed in the ion-ization process. The peak observed at m/z = 445 pos-sibly corresponds to the [Cu(pic)2(im)2] molecule pro-duced by the loss of two moles of water molecules in the ionisation process. The peaks observed at m/z = 375 and 307 values may correspond to the species [Cu(pic)2(im)] and [Cu(pic)2], respectively. Formation of these fragments in the thermal process may also be proved by the thermal analysis data, since [Cu(pic)2] was observed after the loss of water molecules at 65 – 128◦C (found 7.52%; calcd. 7.50%) and of two moles of imidazole ligands at 135 – 302 ◦C (found 27.79%; calcd. 28.37%). An intermediate compound is formed from [Cu(pic)2(im)] by the release of one mole CO2 as observed in the mass spectrum at m/z = 331. This may confirm that a picolinato ligand is thermally decomposed by the release of CO2. The observed ionisation products resemble the products predicted by the thermal analysis results. The decomposition products observed in the ionisation process are given in Fig. 2.
Z. Heren et al.· cis – Bis(imidazole)bis(picolinato)copper(II) Dihydrate 1075 Table 1. Crystal data and structure refinement parameters for
[Cu(pic)2(im)2]·2H2O. Formula C18H20N6O6Cu Colour blue Molecular weight 479.94 Temperature (K) 296 Wavelength ( ˚A) 0.71073 Mo-Kα Crystal system monoclinic
Space group Cc
Unit cell dimensions
a ( ˚A) 16.381(1) b ( ˚A) 9.556(1) c ( ˚A) 15.177(1) β(◦) 119.074 (5) Volume ( ˚A3) 2076.3 (3) Z 4 Dcalc(Mgm−3) 1.535 µ(mm−1) 1.100 Crystal size (mm−3) 0.42× 0.31× 0.22
ΘRange for data collection 1.5 – 26.9◦ Flack’s x parameter [21] 0.02(2) Index ranges h −21 → 21 k −12 → 12 l −19 → 17 Reflections collected 6614
Independent reflections 2454 (Rint= 0.002)
Reflections observed (> 2σ) 4249 Absorption correction integration Max. and min. Transmission 0.767 and 0.875 Refinement method F2
w 1/[2σ(Fo2) + (0.1041P)2]
where P= (F2
o + 2Fc2)/3
Goodness-of-fit on F2 0.91
Final R indices [F2> 2σ(F2)] R1= 0.057, R1(all data) = 0.092
wR(F2) wR
2= 0.133, wR2(all data) = 0.168
Largest difference peak −0.76 to 0.91 and hole (e ˚A−3)
CCDC deposition no. CCDC 286619
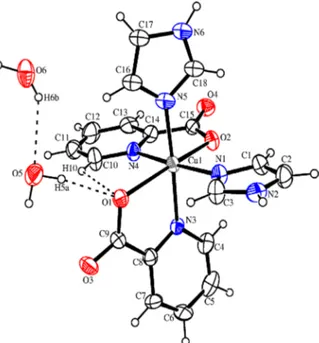
Table 2. Selected bond lengths ( ˚A) and bond angles (◦) for [Cu(pic)2(im)2]·2H2O. Cu(1)–N(1) 2.022(4) Cu(1)–O(1) 2.320(4) Cu(1)–N(3) 1.988(6) Cu(1)–O(2) 2.257(4) Cu(1)–N(4) 2.095(4) C(9)–O(1) 1.279(9) Cu(1)–N(5) 1.999(9) C(9)–O(3) 1.241(7) C(15)–O(2) 1.234(7) C(15)–O(4) 1.248(7) N(1)–Cu(1)–N(4) 172.5(2) N(5)–Cu(1)–N(4) 88.9(3) N(3)–Cu(1)–N(1) 88.7(3) N(3)–Cu(1)–O(2) 93.8(2) N(3)–Cu(1)–N(4) 91.2(3) N(5)–Cu(1)–O(2) 89.7(3) N(3)–Cu(1)–N(5) 176.3(3) N(4)–Cu(1)–O(2) 76.4(2) N(5)–Cu(1)–N(1) 91.7(3) N(4)–Cu(1)–O(1) 91.5(2) Crystallography
The structure of the title complex, [Cu(pic)2 -(im)2]·2H2O, is shown in Fig. 3 and the
crystallo-Table 3. Hydrogen bonding geometry ( ˚A,◦).
D–H··· A D–H H··· A D···A D–H··· A O5–H5A··· O1 0.920(10) 1.984(14) 2.876(7) 163.1(6) O6–H6B··· O5 0.91(5) 2.41(5) 2.972(12) 119(5) C10–H10··· O1 0.93 2.60 3.197(8) 122.9 N2–H2N··· O6i 0.86 1.99 2.833(8) 164.9 O5–H5B··· N6ii 0.923(10) 2.27(5) 2.797(9) 116(4) O6–H6A··· O4iii 0.915(10) 2.106(16) 2.792(6) 130.9(15) N6–H6N··· O5iv 0.86 1.98 2.797(9) 158.1 C3–H3··· O4v 0.93 2.49 3.200(8) 133.3 Symmetry codes:i 1/2+ x, y −1/2, z; ii x−1/2,1/2− y, z −1/2; iiix−1/2, y−1/2, z; iv 1/2+ x,1/2− y,1/2+ z; vx, y− 1, z.
Fig. 3. A view of the copper coordination, with the atom labeling scheme. Displacement ellipsoids are drawn at the 50% probability level.
graphic data are summarized in Table 1. Tables 2 and 3 list bond lengths and angles and hydrogen-bonding ge-ometries. The Cu(II) ion has a slightly distorted oc-tahedral coordination geometry comprised of the two atoms N3 and N4, two carboxylate O atoms from de-protonated bidentate picolinate ligands, and two ter-tiary N atoms from imidazole molecules. Atoms N3 and O1 and N4 and O2 are bonded to Cu1 to form two five-membered chelate ring [N3-Cu1= 1.988(6) and O1-Cu1= 2.320(4) ˚A; N4-Cu1 = 2.095(4) and O2-Cu1 = 2.257(4) ˚A]. The imidazole atom N1 [Cu1-N1= 2.022(4) ˚A] is in an equatorial position and the imidazole atom N5 [Cu1-N5= 1.999(9) ˚A] in an apical position of the Cu(II) coordination octa-hedron.
Fig. 4. The packing of the [Cu(pic)2(im)2]·2H2O complex with the unit cell.
The C-O bond lengths are in the range 1.234(7) – 1.279(9) ˚A, which is comparable with those in simi-lar Cu(II) complexes [13]. However, in the Co(II) [13], Ni(II) [14] and Mg(II) [15] complexes, the carboxy-late group is asymmetric [C-O = 1.223(3) – 1.278(2), 1.248(2) – 1.253(2) and 1.243(2) – 1.262(2) ˚A, respec-tively].
As shown in Table 1, the lengths of the Cu-N bonds [1.988(6) – 2.095(4) ˚A] are normal, and these dis-tances are similar to other values reported in the lit-erature [16]. The coordination of copper(II) clearly shows the geometrical pattern typical for the Jahn-Teller effect. The Cu1-N3 and Cu1-N4 distances are shorter than the Cu1-O1 and Cu1-O2 distances, and this results in the formation of an octahedral geometry elongated along the N atoms. The Jahn-Teller effect is also observed in the electronic spec-tra. This effect is common for analogous metal complexes, such as [17] [Cu1-N3= 2.007(3) and Cu1-O1= 2.383(3) ˚A] and [18] [Cu1-N2 = 2.006(2) and Cu1-O3= 2.390(2) ˚A].
The title compound contains two pyridine rings and two imidazole rings. For simplicity, the four rings will be called A, B, C and D, corresponding to N3/C4-C8, N4/C10-C14, N1/N2/C1-C3 and N5/N6/C16-C18, re-spectively. The dihedral angles between the planes of the rings are A/C = 85.36(31), A/D = 23.99(44),
Fig. 5. The C–H···π interactions of the molecules.
B/C = 2.96(40) and B/D = 89.17(36)◦. The two im-idazole rings are individually planar, with r.m.s. de-viations of 0.0095 and 0.0004 ˚A, and the maximum deviations from these planes are −0.0086(62) ˚A for atom C3 and 0.0005(5) ˚A for atom C18. These planes are approximately perpendicular, with a dihedral angle of 86.46(41)◦, in agreement with those previously re-ported for other imidazole and picolinate ligands con-taining Cu(II) complexes [19, 20]. The crystal pack-ing of the title complex is formed by intermolecular N-H. . . O, O-H. . . O, O-H. . . N, and C-H. . . O hydro-gen bondings (Table 3, Fig. 4) andπ-ring interaction (Fig. 5). For the C2-H2. . . CgA (CgA with symme-try code: x+ 1/2, 1/2 − y, 1/2 + z is the centroid of N3/C4-C8)π-ring contact, the distance between atom H2 and the centre of ring A (CgA) is 2.92 ˚A, and the C2-H2. . . CgA angle is 132.7◦.
Experimental Section
Materials and measurements
All chemicals used were analytical reagent grade prod-ucts. Imidazole was obtained from Merck. Picolinic acid was purchased from ACROS Organics.
The magnetic susceptibility measurement at r. t. was per-formed using a Sherwood Scientific MXI model Gouy mag-netic balance. The UV/vis spectrum was obtained for the aqueous solution of the complex (10−3 M) with a Uni-cam UV2 spectrometer in the range 900 – 190 nm. The IR
Z. Heren et al.· cis – Bis(imidazole)bis(picolinato)copper(II) Dihydrate 1077 spectrum was recorded in the 4000 – 400 cm−1region with
a Mattson 1000 FT-IR spectrometer using KBr pellets. A TG8110 thermal analyzer was used to record simultaneous TG and DTA curves in static air atmosphere at a heating rate of 10 Kmin−1in the temperature range 20 – 1000◦C using platinum crucibles. Highly sinteredα–Al2O3 was used as a reference and the DTG sensitivity was 0.05 mg s−1. The elemental and mass spectroscopic analysis was carried out at the T ¨UB˙ITAK Marmara Research Centre. Mass spectro-scopic analysis was performed on a AGILENT 1100 MSD mass spectrometer.
X-ray structure determination
Data collection was performed on a STOE IPDS-II im-age plate detector using Mo-Kαradiation (λ = 0.71073 ˚A). Intensity data were collected in the θ range 1.5 – 26.9◦ at 296 K. Details of crystal structures are given in Table 1. Data collection and cell refinement: STOE X-AREA [22]. Data reduction: STOE X-RED32 [22]. The structure was solved by direct methods using SHELXS-97 [23]. Anisotropic displacement parameters were applied to non-hydrogen atoms in a full-matrix least-squares refinement based on F2 using SHELXL-97 [23]. All hydrogen atoms except those bound to O5 and O6 were placed in calculated positions and refined using a riding model, with C-H dis-tances of 0.93 (aromatic), N-H disdis-tances of 0.86 ˚A and with Uiso(H) = 1.2Ueq(C, N). Molecular drawings were obtained using ORTEP-III [24]. Software used to prepare material for publication: WinGX [25].
Preparation of the [Cu(pic)2(im)2]·2H2O
The [Cu(pic)2]·2H2O complex was prepared by the method reported earlier [26]. A solution of im (0.27 g, 4 mmol) in ethanol (10 ml) was added dropwise with stir-ring to a solution of [Cu(pic)2]·2H2O (0.69 g, 2 mmol) in distilled water (20 ml). The solution was heated to 60◦C in a temperature-controlled bath and stirred for 6 h. The reaction mixture was then cooled to r. t. The blue crystals formed were filtered and washed with 10 ml of cold dis-tilled water and ethanol and dried in air. UV/vis (H2O):
λmax(lgε) = 642 nm (3.71). – IR (KBr): ˜ν = 3435 cm−1 (OH), 1643, 1353, 1595, 455. – MS (ES, 35 eV): m/z(%) = 445 [Cu(pic)2(im)2]+, 375 (68) [Cu(pic)2(im)2-(im)]+. – C18H20N6O6Cu (479.9): calcd. C 45.05, H 4.17, N 17.52; found C 45.01, H 4.22, N 17.28.
Supplementary Data
Crystallographic data (excluding structure factors) have been deposited with the Cambridge Crystallographic Data Centre as the supplementary publication No. CCDC 286619. Copies of the data can be obtained, free of charge, on appli-cation to CCDC, 12 Union Road, Cambridge CB2 1EZ, UK (fax: +44-1223-336033 or e-mail: [email protected]). Acknowledgements
The authors wish to acknowledge the Faculty of Arts and Sciences, Ondokuz Mayis University, Turkey, for the use of the STOE IPDS-II diffractometer (purchased under grant F.279 of the University Research Fund).
[1] K. A. Idriss, M. S. Saleh, H. Sedaira, M. M. Sleim, E. Y. Hashem, Monatsh. Chem. 122, 507 (1991).
[2] R. Song, K. M. Kim, Y. S. Sohn, Inorg. Chim. Acta 292, 238 (1999).
[3] T. L. Varadinova, P. R. Bontehev, C. K. Nachev, S. A. Shiskov, J. Chemother. 5, 3 (1993).
[4] N. E. Chakov, R. A. Collins, J. B. Vincent, Polyhedron 22, 2891 (1999).
[5] R. March, W. Clegg, R. A. Coxall, L. Cucurull-S´anchez, L. Lezama, T. Rojo, P. Gonz´alez-Duarte, In-org. Chim. Acta 353, 129 (2003).
[6] S. L. Jain, P. Bhattacharya, H. L. Milton, A. M. Z. Slawin, J. D. Woollins, Inorg. Chem. Comm. 7, 423 (2004).
[7] S. Basu, S.-M. Peng, G.-H. Lee, S. Bhattacharya, Poly-hedron 24, 157 (2005).
[8] R. M. Achelson, Introduction to the Chemistry of Het-erocyclic Compounds, Wiley, New York (1986). [9] K. Nakamato, Infrared and Raman Spectra of Inorganic
and Coordination Compounds, p. 232, Wiley & Sons, New York (1986).
[10] D. Sutton, Electrostatic Energy Level Diagrams and the
Spectra of Octahedral Complexes. In Electronic spec-tra of Transition Metal Complexes, p. 115, McGraw-Hill, London (1968).
[11] M. Rehakova, K. Jesenak, S. Nagyova, R. Kubinec, S. Cuvanova, V. S. Fajnor, J. Therm. Anal. Cal. 76, 139 (2004).
[12] D. Czakis-Sulikowska, A. Czylkowska, J. Therm. Anal. Cal. 76, 543 (2004).
[13] H. Icbudak, H. ¨Olmez, O. Z. Yesilel, F. Arslan, P. Nau-mov, G. Jovanovski, A. R. Ibrahim, A. Usman, H. K. Fun, S. Chantrapromma, S. W. Ng, J. Mol. Struct. 657, 255 (2003).
[14] I. Ucar, A. Bulut, O. Z. Yesilel, H. ¨Olmez, O. B¨uy¨uk-g¨ung¨or, Acta Crystallogr. C60, m563 (2004).
[15] I. Mutikainen, R. Hamalatainen, M. Klinga, O. Orama, U. Turpeinen, Acta Crystallogr. C52, 2480 (1996). [16] H.-Y. Wang, S.-J. Liu, R.-J. Wang, C.-C. Su, Acta
Crystallogr. C59, m512 (2003).
[17] C.-S. Gu, S. Gao, L.-H. Huo, H. Zhao, J.-G. Zhao, Acta Crystallogr. E60, m1852 (2004).
[18] M. Bhar, M. Chaudhury, E. R. T. Tiekink, Acta Crys-tallogr. E57, m305 (2001).
[19] J. G. D´ıaz, J. Koˇz´ıˇsek, M. Fronc, A. Gatial, I. Svoboda, V. Langer, Acta Crystallogr. C61, m180 (2005). [20] L. Wang, D.-H. Zhou, J.-P. Zhang, Acta Crystallogr.
E61, m958 (2005).
[21] H. D. Flack, Acta Crystallogr. A39, 876 (1983). [22] Stoe & Cie, X-AREA (version 1.18) and X-RED32
(version 1.04). Stoe & Cie, Darmstadt, Germany (2002).
[23] G. M. Sheldrick, SHELXS-97 and SHELXL-97. Pro-gram for Crystal Structure Refinement, University of G¨ottingen, Germany (1997).
[24] M. N. Burnett, C. K. Johnson, ORTEP-III. Report ORNL-6895. OAK Ridge National Laboratory, Ten-nessee, U.S.A. (1996).
[25] L. J. Farrugia, WinGX Suite for Single Crystal Small Molecule Crystallography, J. Appl. Crystallogr. 32, 837 (1999).
[26] R. Faure, H. Loiseleur, G. Thomas-David, Acta Crys-tallogr. B29, 1890 (1973).
![Fig. 1. The TG and DTA curves of the [Cu(pic) 2 - -(im) 2 ] ·2H 2 O complex.](https://thumb-eu.123doks.com/thumbv2/9libnet/4018254.55447/2.892.100.424.764.968/fig-tg-dta-curves-cu-pic-im-complex.webp)
![Fig. 2. Mass spectral fragmentation pattern of the [Cu(pic) 2 (im) 2 ] ·2H 2 O complex.](https://thumb-eu.123doks.com/thumbv2/9libnet/4018254.55447/3.892.130.745.124.955/fig-mass-spectral-fragmentation-pattern-cu-pic-complex.webp)
![Fig. 4. The packing of the [Cu(pic) 2 (im) 2 ] ·2H 2 O complex with the unit cell.](https://thumb-eu.123doks.com/thumbv2/9libnet/4018254.55447/5.892.364.754.121.478/fig-packing-cu-pic-im-complex-unit-cell.webp)
