459
Pakistan Veterinary Journal
ISSN: 0253-8318 (PRINT), 2074-7764 (ONLINE)Accessible at: www.pvj.com.pk
Detection of Aflatoxin, Zearalenone and Deoxynivalenol in Some Feed and Feedstuffs in
Turkey
Tanay Bilal1*, Didem Hilkat Aksakal2, Selim Sünnetci2, Onur Keser1 and Hüseyin Eseceli3
1Department of Animal Nutrition and Nutritional Diseases, Faculty of Veterinary Medicine, Istanbul University, 34320 Avcilar, Istanbul, Turkey; 2Republic of Turkey Ministry of Agriculture and Rural Affairs, Directorate of Istanbul Province Control Laboratory, Senlikkoy, Istanbul, Turkey; 3Vocational School of Bandirma, Balikesir University, 10200 Bandirma, Balikesir, Turkey
*Corresponding author: [email protected] ARTICLE HISTORY (13-271) A B S T R A C T Received: Revised: Accepted: July 13, 2013 January 31, 2014 April 20, 2014
The aim of this study was to determine aflatoxin, zearalenone (ZON) and deoxynivalenol (DON) in some feed and feedstuff samples obtained from several farms and animal feed manufacturers in Turkey. A total of 106 samples (76 feedstuffs and 30 feeds) were analyzed by HPLC method. In samples of feedstuffs, ZON occurred at a high incident rate, however, AFG1 and G2 had a lower incident rate. In feed samples, although AFB2 and G2 occurred at a low incident rate, ZON had a higher incident rate. The data obtained in this study showed that toxin levels in feed and feedstuff samples were lower than maximal allowed levels.
©2014 PVJ. All rights reserved Key words: Aflatoxin Deoxynivalenol Feed Feedstuff Zearalenone
To Cite This Article: Bilal T, DH Aksakal, S Sünnetci, O Keser and H Eseceli, 2014. Detection of aflatoxin, zearalenone and deoxynivalenol in some feed and feedstuffs in Turkey. Pak Vet J, 34(4): 459-463.
INTRODUCTION
In animal production, feed costs comprise about 70% of total cost of production. Besides potential hazards for human and animal health, molds may cause important economic losses by their toxic metabolites. Mycotoxins produced molds are found in food and feed supply chain and the infection of cereal plants with fungi triggers the risk of grain contamination with secondary metabolites, i.e., mycotoxins, and their subsequent transfer to food and feed (Gahukar, 2014; Waśkiewicz et al., 2014).
Aflatoxins (AF) are produced by three species of Aspergillus (A. flavus, A. parasiticus and A. nominus) which contaminate plants and plant products. A. flavus produces only B aflatoxins, while the other two species produce both B and G aflatoxins (Creppy, 2002; Jubeen et al., 2012). All cereals, especially wheat and its by-products, and feeds are considered as the most hazardous materials with regard to AF. In a comparative study on the production of AF in wheat, corn, rice and groundnuts reported the highest level of AF in wheat (Demet et al., 1995). Zearalenone is a fusariotoxin produced by some species of genus Fusarium and leads to a number of diseases in animals resulting in considerable losses of production and a high rate of mortality (Valcheva and Valchev, 2007). Zearalenone is a non-steroidal estrogen and its major metabolites α-zearalenol and β-zearalenol elicit significant estrogenic activity in animals,
corresponding to their binding affinities for hepatic, uterine, mammary and hypothalamic estrogen receptors (Fink-Gremmels and Malekinejad, 2007). Deoxynivalenol (DON) is one of the toxins mainly produced by Fusarium graminearum. This water-soluble toxin, also known as vomitoxin, responsible for emesis and feed refusal in non-ruminant animals (Forsyth et al., 1997). DON appears predominantly in wheat, corn, rye, rice and barley. Studies in the USA, Germany, the Netherlands, Bulgaria, Hungary, Russia, China, Korea and Argentina have shown that 60-100% of samples tested had DON contamination (Cahill et al., 1999). Previous studies on the occurrence of mycotoxins in feeds and feedstuffs shown that the concentration of AF, ZON and DON varied. Sonal and Oruç (2000) reported that average total AF, AFB1 and ZON were 6.94, 0.86, 78.64 µg/kg and incidence were 100, 65.38 and 100% respectively in 27 poultry feeds that were collected from chicken farms during June 2000 in Bursa province of Turkey. In a study carried out by Yildiz (2009) in Turkey, 145 roughage samples were examined for AF and 70 samples for ZON contamination. Ninety samples were AF-positive (62.07%, 2.00-214.80 µg/kg) and 21 samples were ZON-positive (30%, 50.00-442.60 µg/kg). It was also reported that AF contamination in Aegean and Mediterranean and ZON contamination in Mediterranean and Black Sea region was at higher level than the other regions in Turkey. Chilaka et al. (2012) analyzed 40 maize samples from Kwazulu Natal in South Africa and reported RESEARCH ARTICLE
that contamination level of mycotoxins, as determined by an HPLC method, ranged from 762 ppb for AFB and 0-135 ppb for ZON. Data obtained by TLC (thin layer chromatography) method showed that the prevalence were 33% for AFB and 30% for ZON. Binder et al. (2007) analyzed 1507 samples from European and Mediterranean markets and 1291 samples from Asian-Pacific region to investigate the occurrence of mycotoxins in commodities, feeds and feed ingredients. They found that more than half of materials sampled in Europe were contaminated by AF, ZON and DON at levels above the limit and Asian-Pacific sourced samples were also positive. However, Aydin and Oğuz (2012) reported that AFB1 and ZON contamination were not detected in any of the sample in 260 corn silage samples which were the crops of the year 2007 collected from dairy cattle and sheep enterprises in several provinces of Anatolia- Turkey.
Although there are many methods for the determination of mycotoxin contamination, high-performance liquid chromatography (HPLC) is most useful in terms of specificity and sensitivity, especially with an immunoaffinity column clean-up step to concentrate and purify mycotoxins (Pirestan et al., 2011; Khan et al., 2013). The aim of this study was to investigate the occurrence of AF (B1, B2, G1, G2), ZON and DON in some feed and feedstuffs obtained from different farm and enterprises in Turkey by HPLC.
MATERIALS AND METHODS
Samples: A total of 106 samples (76 feedstuffs and 30 feeds) of feeds and feedstuffs were obtained between April and June 2011 from several farms and animal feed manufacturers in Marmara, Aegean and Mediterranean Region in Turkey. As mentioned by Sokolovic and Simpraga (2006), primary large samples of approximately 10 kg were composed of several samples collected from different part of storage lots. The primary samples were homogenized and quartered to obtain a 1 kg of laboratory sample. All samples were stored at 4°C for further analysis. Standards, chemicals and instrument: Aflatoxin, ZON and deoxynivalenol standards were purchased from R-Biopharm AG (Darmstadt, Germany). High performance liquid chromatography (HPLC) solvents and other chemicals were purchased from Merck (Darmstadt, Germany). HPLC system (model 1100, Agilent, USA) equipped with 2 (5 µm, 4.6 mm x 250 mm) and ODS-EP (5 µm, 4.6 mm x 150 mm) columns (Hicrom Ltd., UK) and FLD-Fluorescent detector (Thermo Fisher Scientific Inc., Waltham, MA, USA) and DAD-Diode array detector (model 1100, Agilent, USA) was used for measurements. Immunoaffinity columns (EASI-EXTRACT® AFLATOXIN, EASI-EXTRACT® ZEARALENONE, DONPREP) were purchased from R-Biopharm AG (Darmstadt, Germany).
Preparation of calibrant solutions for HPLC and calibration: For preparation of aflatoxin mix stock solution, 1 ml of main stock solution was diluted with 10 ml toluene/acetonitrile (98:2 v/v) and grade II stock standard was prepared. AF B1-G1 and AF B2-G2 concentrations of grade II stock standard were 1000 and
200 ng/ml, respectively. Grade II stock standard was pipetted into a volumetric flask and completed to 10 ml with toluene/acetonitrile (98:2 v/v) and shaked again. After shaking, the concentrations of this mix (grade III stock standard) were 0.1 ng/ml for AF B1-G1 and 0.02 ng/ml for AF B2-G2. For post-column derivatization, 10, 30, 50, 70 and 90 µl of grade III stock standard solutions were pipetted into vials, then toluene/acetonitrile solution was evaporated just to dryness under a stream of nitrogen at room temperature. Then, 1 ml of HPLC-grade methanol was added to each vial and shaked to dissolve aflatoxins, and mixes were completed up to 2.5 ml with ultra pure water. These prepared standards were analyzed six times in HPLC for calibration.
For zearalenone, main stock solution was diluted with acetonitrile and concentration of grade II stock solution was 5 µg/ml. After pipetting of 20, 40, 80, 200, 400, 800 and 2000 µl of grade II solution into vials, acetonitrile solutions were evaporated under a stream of nitrogen at room temperature. Then, 2 ml acetonitrile/water (3:7 v/v) was added to each vial and shaked. To prepare a calibration table, first three and last four solutions were injected to HPLC five and four times respectively.
For DON, main stock solution was diluted with acetonitrile and concentration of grade II stock solution was 20 µg/ml. 500 µl of grade II solution was pipetted into a vial and evaporated under a stream of nitrogen at room temperature. Grade III calibrant solution (2 µg/ml) was prepared by dilution of residue in the vial with 5 ml of mobile phase. After pipetting of 62.5, 125, 250, 500, 1000 and 2000 µl of grade III solution into vials, each vial was completed up to 2 ml with ultra-pure water/acetonitrile/methanol (94:3:3 v/v/v) and shaked. Each of these calibrants was injected to HPLC five times for calibration table. Values of calibration accuracy at the point of 0.999 from each treatment were accepted.
Extraction procedures and HPLC method for detection of mycotoxins: For extraction of aflatoxin (Anonymous, 2005), 25 g of each sample, 5 g NaCI and 125 ml of methanol/water (70:30 v/v) were added into a blender. The mixture was homogenized for 2 min in 22000 rpm and then filtered through common filter paper. After that, 15 ml of filtrate was pipetted into a beaker and mixed with 30 ml of pure water. This dilution was completely filtered through glass microfiber filter paper (Watman, pore size 1.6 µm). After filtration, 15 ml of filtrate was passed through EASI-EXTRACT® AFLATOXIN immuno-affinity column at a flow rate of 1-2 drops/sec. The column was then washed with 10 ml of ultra pure water. After washing, 1 ml HPLC-grade methanol was passed (1 drop/sec.) through column to elute bounded aflatoxins into a vial and diluted with 1 ml ultra pure water. The mobile phase, water/acetonitrile/methanol (6:2:3 v/v/v) was run at a flow rate of 1 ml/min. Detection of aflatoxins were done at excitation and emission wavelengths of 360 and 430 nm, respectively, on a FLD-fluorescence detector coupled with a coring cell (COBrA cell) for derivatization.
For extraction of zearalenone (Fazekas and Tar, 2001), 50 g of each sample, 2 g NaCI and 100 ml of methanol/water (8:2 v/v) were added into a flask and shaked for 60 min. in 22000 rpm. Extract was filtered and 25 ml of filtrate was mixed with 75 ml of ultra pure water.
Diluted extract was filtered through glass microfiber filter paper. 50 ml of filtrate was passed through EASI-EXTRACT® ZEARALENONE immunoaffinity column at a flow rate of 1-2 drops/sec. After that, the column was washed with 10 ml of ultra pure water at a flow rate of 1-2 drops/sec. Bounded zearalenone eluted slowly with 2 ml HPLC-grade acetonitrile at a flow rate of 1-2 drop/sec into a vial. The mobile phase, water/acetonitrile (50:50 v/v) was run at a flow rate of 1 ml/min. Detection of zearalenone was done at excitation and emission wavelengths of 232 and 440 nm, respectively, on a FLD-fluorescence detector.
For extraction of DON (R-Biopharm Ref no: A4.P50.V1, 2003), 25 g of each sample homogenized with 200 ml ultra pure water for 120 min. in 22000 rpm. Extract was filtered through filter paper (Watman no. 4). 2 ml of filtrate was passed through DONPREP immuno-affinity column at a flow rate of 1-2 drops/sec. and then the column was washed with 5 ml of ultra pure water. After washing, bounded DON eluted with 1.5 ml HPLC-grade methanol into a vial at a flow rate of 1-2 drops/sec. The eluate was evaporated to dryness at 60˚C with a stream of nitrogen gas and vortexed with 1 ml of mobile phase. The mobile phase, water/acetonitrile/ methanol (94:3:3 v/v/v) was run at a flow rate of 1 ml/min. Detection of DON was done at wavelengths of 218 nm on a DAD-Diode array detector.
RESULTS
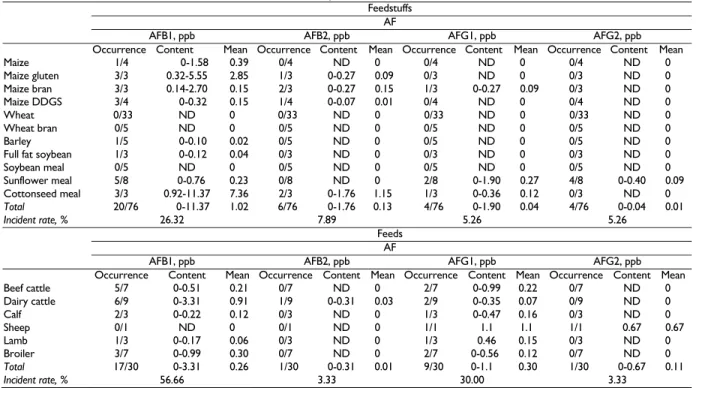
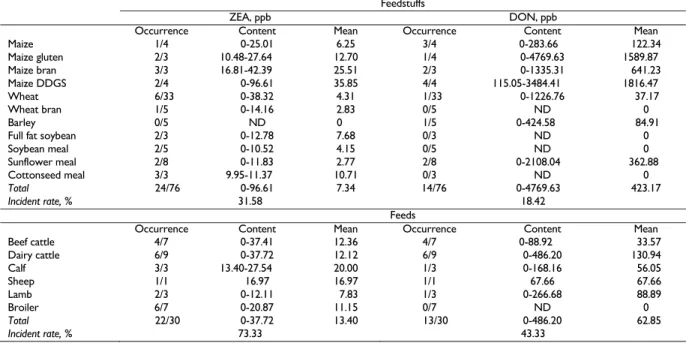
A total of 76 feedstuffs and 30 feeds were analyzed for mycotoxin and data obtained on HPLC analysis demonstrated the occurrence of AFB1, AFB2, AFG1, AFG2, ZON and DON as summarized in Tables 1 and 2. In feedstuff samples, results showed that incident rates were 26.32, 7.89, 5.26, 5.26, 31.58 and 18.42 percent for AFB1, AFB2, AFG1, AFG2, ZON and DON, respectively. ZON occurred at a high incident rate with a range of 0-96.61 ppb. However, AFG1 and G2 had a lower incident rate ranged
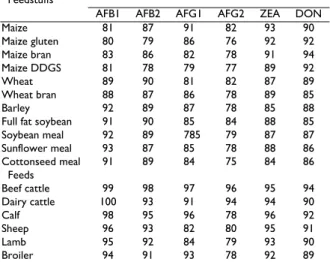
0-1.90 and 0-0.04 ppb, respectively. According to the data from the analysis of beef and dairy cattle, calf, sheep, lamb and broiler feeds, incident rates were 56.66, 3.33, 30.00, 3.33, 73.33 and 43.33 percent for AFB1, AFB2, AFG1, AFG2, ZON DON, respectively. Although ZON had a higher incident rate with a range of 0-37.72 ppb rather than the other toxins, AFB2 and G2 occurred at a low incident rate ranged 0-0.31 and 0-0.67 ppb, respectively. Limits of quantification and recoveries levels have been presented in Tables 3 and 4, respectively.
DISCUSSION
The present study revealed that AF levels of feedstuffs and feeds were low and none of samples exceeded the maximum permitted level by EU and Turkey. According to a recent study carried out by Oruc et al. (2012), the incidence of AFB1, DON and ZON in feed and feedstuff samples was 100, 75 and 33%, respectively, and these levels were lower than the mycotoxin limits of the EU and Turkey. Oguz et al. (2011) reported that none of 210 wheat flour samples were found positive for AF contamination and AF levels in 150 mixed feed samples were found below the maximum permissible level as determined by Ministry of Agricultural and Rural Affairs of Turkey. Sonal and Oruc (2000) carried out an study on mycotoxin levels in 27 mixed feed samples taken from poultry farms in Bursa Province of Turkey and the mean total AF and AFB1 concentrations were 6.94 and 0.86 ppb whereas the incidence of total AF and AFB1 were 100 and 65.38%, respectively. They also reported that these levels of AF could not be considered a risk to poultry health and productivity. Binder et al. (2007) reported that there were no evidence of aflatoxin contamination in the 98 wheat samples tested and his result agreed with data obtained from 33 wheat samples in present study. In comparison with the previous studies the AF concentrations in feed
Table 1: Aflatoxin contamination and incidence in feedstuff and feed samples
Feedstuffs AF
AFB1, ppb AFB2, ppb AFG1, ppb AFG2, ppb
Occurrence Content Mean Occurrence Content Mean Occurrence Content Mean Occurrence Content Mean
Maize 1/4 0-1.58 0.39 0/4 ND 0 0/4 ND 0 0/4 ND 0 Maize gluten 3/3 0.32-5.55 2.85 1/3 0-0.27 0.09 0/3 ND 0 0/3 ND 0 Maize bran 3/3 0.14-2.70 0.15 2/3 0-0.27 0.15 1/3 0-0.27 0.09 0/3 ND 0 Maize DDGS 3/4 0-0.32 0.15 1/4 0-0.07 0.01 0/4 ND 0 0/4 ND 0 Wheat 0/33 ND 0 0/33 ND 0 0/33 ND 0 0/33 ND 0 Wheat bran 0/5 ND 0 0/5 ND 0 0/5 ND 0 0/5 ND 0 Barley 1/5 0-0.10 0.02 0/5 ND 0 0/5 ND 0 0/5 ND 0
Full fat soybean 1/3 0-0.12 0.04 0/3 ND 0 0/3 ND 0 0/3 ND 0
Soybean meal 0/5 ND 0 0/5 ND 0 0/5 ND 0 0/5 ND 0 Sunflower meal 5/8 0-0.76 0.23 0/8 ND 0 2/8 0-1.90 0.27 4/8 0-0.40 0.09 Cottonseed meal 3/3 0.92-11.37 7.36 2/3 0-1.76 1.15 1/3 0-0.36 0.12 0/3 ND 0 Total 20/76 0-11.37 1.02 6/76 0-1.76 0.13 4/76 0-1.90 0.04 4/76 0-0.04 0.01 Incident rate, % 26.32 7.89 5.26 5.26 Feeds AF
AFB1, ppb AFB2, ppb AFG1, ppb AFG2, ppb
Occurrence Content Mean Occurrence Content Mean Occurrence Content Mean Occurrence Content Mean
Beef cattle 5/7 0-0.51 0.21 0/7 ND 0 2/7 0-0.99 0.22 0/7 ND 0 Dairy cattle 6/9 0-3.31 0.91 1/9 0-0.31 0.03 2/9 0-0.35 0.07 0/9 ND 0 Calf 2/3 0-0.22 0.12 0/3 ND 0 1/3 0-0.47 0.16 0/3 ND 0 Sheep 0/1 ND 0 0/1 ND 0 1/1 1.1 1.1 1/1 0.67 0.67 Lamb 1/3 0-0.17 0.06 0/3 ND 0 1/3 0.46 0.15 0/3 ND 0 Broiler 3/7 0-0.99 0.30 0/7 ND 0 2/7 0-0.56 0.12 0/7 ND 0 Total 17/30 0-3.31 0.26 1/30 0-0.31 0.01 9/30 0-1.1 0.30 1/30 0-0.67 0.11 Incident rate, % 56.66 3.33 30.00 3.33
Table 2: Zearalenone and deoxynivalenol contamination and incidence in feedstuff and feed samples Feedstuffs
ZEA, ppb DON, ppb
Occurrence Content Mean Occurrence Content Mean
Maize 1/4 0-25.01 6.25 3/4 0-283.66 122.34 Maize gluten 2/3 10.48-27.64 12.70 1/4 0-4769.63 1589.87 Maize bran 3/3 16.81-42.39 25.51 2/3 0-1335.31 641.23 Maize DDGS 2/4 0-96.61 35.85 4/4 115.05-3484.41 1816.47 Wheat 6/33 0-38.32 4.31 1/33 0-1226.76 37.17 Wheat bran 1/5 0-14.16 2.83 0/5 ND 0 Barley 0/5 ND 0 1/5 0-424.58 84.91
Full fat soybean 2/3 0-12.78 7.68 0/3 ND 0
Soybean meal 2/5 0-10.52 4.15 0/5 ND 0 Sunflower meal 2/8 0-11.83 2.77 2/8 0-2108.04 362.88 Cottonseed meal 3/3 9.95-11.37 10.71 0/3 ND 0 Total 24/76 0-96.61 7.34 14/76 0-4769.63 423.17 Incident rate, % 31.58 18.42 Feeds
Occurrence Content Mean Occurrence Content Mean
Beef cattle 4/7 0-37.41 12.36 4/7 0-88.92 33.57 Dairy cattle 6/9 0-37.72 12.12 6/9 0-486.20 130.94 Calf 3/3 13.40-27.54 20.00 1/3 0-168.16 56.05 Sheep 1/1 16.97 16.97 1/1 67.66 67.66 Lamb 2/3 0-12.11 7.83 1/3 0-266.68 88.89 Broiler 6/7 0-20.87 11.15 0/7 ND 0 Total 22/30 0-37.72 13.40 13/30 0-486.20 62.85 Incident rate, % 73.33 43.33
Table 3: Limits of quantification (ppb) of method applied in feedstuffs and feed samples
Feedstuffs AFB1 AFB2 AFG1 AFG2 ZEA DON
Maize 0.2 0.1 0.3 0.5 15 250 Maize gluten 0.2 0.1 0.3 0.5 15 250 Maize bran 0.2 0.1 0.3 0.5 15 250 Maize DDGS 0.2 0.1 0.3 0.5 15 250 Wheat 0.2 0.1 0.3 0.5 15 250 Wheat bran 0.2 0.1 0.3 0.5 15 250 Barley 0.2 0.1 0.3 0.5 15 250
Full fat soybean 0.2 0.1 0.3 0.5 15 250
Soybean meal 0.2 0.1 0.3 0.5 15 250 Sunflower meal 0.2 0.1 0.3 0.5 15 250 Cottonseed meal 0.2 0.1 0.3 0.5 15 250 Feeds Beef cattle 0.6 0.4 0.8 0.8 15 200 Dairy cattle 0.6 0.4 0.8 0.8 15 200 Calf 0.6 0.4 0.8 0.8 15 200 Sheep 0.6 0.4 0.8 0.8 15 200 Lamb 0.6 0.4 0.8 0.8 15 200 Broiler 0.6 0.4 0.8 0.8 15 200
and feedstuff samples were below legal limits as in our study. In comparison of feedstuffs and feeds for AF incidence, it was observed that feeds had higher incidence rate rather than feedstuffs. Similarly, in a study carried out in Poland with 625 mixed feed and 1120 feedstuff samples, it was reported that feeds had more AF contamination than those of feedstuff samples (Juszkiewicz et al., 1992).
The frequent contamination of grain with the Fusarium toxins, DON and ZON is an important issue in animal and human nutrition (Goyarts et al., 2007). The Fusarium fungi are the most prevalent toxin-producing fungi of northern temperate regions and are commonly found on cereals grown in the temperate regions of America, Europe and Asia (Creppy, 2002). It was reported that ZON could play an indicator role in the contamination of other Fusarium toxins (Kutay, 2003). Therefore, it would be meaningful to discuss ZON together with DON. Although many studies have focused on aflatoxicosis in Turkey, few have examined the impact of Fusarium toxins (Ozpinar et al., 2001). In this study, 24 and 14 samples of feedstuffs and 22 and 13 samples of feeds had ZON and DON contamination,
respectively. Incidence rates of ZON and DON were 31.58 and 18.42% in feedstuffs and 73.33 and 43.33% in feed samples, respectively. In 40 maize samples, Chilaka et al. (2012) reported that the contamination level of ZON as determined by HPLC were 0-135 ppb and occurred at a high incidence rate of 90%. Pleadin et al. (2013) investigated ZON and DON levels in 63 maize, 51 wheat, 34 barley and 34 oats samples and percentage of positive samples were 78, 69, 9 and 6 for ZON, 71, 65, 53 and 21 for DON, respectively. Minimum and maximum levels for ZON were 10-611 (mean 187), 7-107 (mean 56), 5-68 (mean 32) and 4-43 ppb (mean 44 ppb), and for DON were 215-2942 (mean 1565), 115-278 (mean 223), 74-228 (mean 342) and 34-201 ppb (mean 145 ppb), respectively. They also reported that maize was the most contaminated cereal and the mean concentrations of ZON and DON found maize were significantly higher than those found in other samples. In contrary, the range of ZON and DON concentration in maize samples were 0-25.01 (mean 6.25) and 0-283.66 ppb (mean 122.34 ppb), respectively in our study. Furthermore, maize products (gluten, bran and DDGS) had higher mean ZON and DON concentrations rather than the other feedstuffs in our study. In a survey study on 1507 samples sourced from European and Mediterranean markets, Binder et al. (2007) reported that mean and maximum levels of ZON were 180 and 970 ppb for Northern Europe, 273 and 1392 ppb for Central Europe, 174 and 2348 ppb for Southern Europe + Mediterranean samples. For DON, mean and maximum levels were 559 and 5510 ppb for Northern Europe, 571 and 8020 ppb for Central Europe, 304 and 3036 ppb for Southern Europe + Mediterranean samples. In Croatia, a total of 465 grains and animal feed samples were tested and the overall incidence of DON was 41.2% and the percentage of samples positive for DON varied up to 71.4% (Sokolovic and Simpraga, 2006). Kutay (2003) reported that DON concentrations of 91 feedstuff samples of wheat, maize, barley, oat, soybean meal, sunflower meal and 30 feed samples were analyzed and all samples, except oat and sunflower meal, had DON contamination in range of 200-6200 ppb. In our study,
Table 4: Recoveries (ppb) of method applied in feedstuffs and feed samples
Feedstuffs
AFB1 AFB2 AFG1 AFG2 ZEA DON
Maize 81 87 91 82 93 90 Maize gluten 80 79 86 76 92 92 Maize bran 83 86 82 78 91 94 Maize DDGS 81 78 79 77 89 92 Wheat 89 90 81 82 87 89 Wheat bran 88 87 86 78 89 85 Barley 92 89 87 78 85 88
Full fat soybean 91 90 85 84 88 85
Soybean meal 92 89 785 79 87 87 Sunflower meal 93 87 85 78 88 86 Cottonseed meal 91 89 84 75 84 86 Feeds Beef cattle 99 98 97 96 95 94 Dairy cattle 100 93 91 94 94 90 Calf 98 95 96 78 96 92 Sheep 96 93 82 80 95 91 Lamb 95 92 84 79 93 90 Broiler 94 91 93 78 92 89
DON were not detected in wheat bran, barley, full fat soybean, soybean meal, cottonseed meal and broiler feed samples and these results disagreed with that of Kutay (2003). Yildiz et al. (2005) reported that ZON levels were higher than 60 ppb in 29 of 128 feed samples and ZON incidence rates in poultry and ruminant feeds were 28.13 and 31.34 %, respectively. Similarly Sonal and Oruc (2000) reported that mean ZON levels and incidence rate were 78.64 ppb and 100% in 27 poultry feed samples. It was reported that the legal tolerable level of ZON in Germany was 250 ppb for pre-ruminants and beef cattle and 500 ppb for calves and dairy cows (Yildiz, 2009). In present study, none of the samples exceeded these levels and ZON and DON levels of all samples were below from the permissible levels in Turkey and Europe.
Conclusion: The data obtained in this study showed that feedstuffs and feeds available in Turkey were contaminated with varied levels of AF, ZON and DON and that these levels lesser than the tolerable limits. However, it must be considered that mycotoxin contamination and concentrations in feedstuffs and feeds can be vary according to regional climate, annual rainfall regime, harvesting methods, storing conditions etc. The contriving of comprehensive and detailed studies regularly with the greater number of samples in several countries will be effective and beneficial in the detection of mycotoxin profile.
REFERENCES
Anonymous, 2005. AOAC Official Method 991.31. Aflatoxins in corn, raw peanuts, and peanut butter: immunoaffinity column (aflatest) method. AOAC International, pp: 49.2.18.
Aydin H and H Oguz, 2012. Analyzes of aflatoxin B1 and zearalenone in corn silage by high performance thin layer chromatography (HPTLC)-fluorodensitometric method. Kafkas Univ J Fac Vet Med, 18: 151-156.
Binder EM, LM Tan, LJ Chin, J Handl and J Richard, 2007. Worldwide occurrence of mycotoxins in commodities, feeds and fed ingredients. Anim Feed Sci Technol, 137: 265-282.
Cahill LM, SC Kruger, BT McAlice, CS Ramsey, R Prioli and B Kohn, 1999. Quantification of deoxynivalenol in wheat using an immunoaffinity column and liquid chromatography. J Chromatogr A, 859: 23-28.
Chilaka CA, SD Kock, JZ Phoku, M Mwanza, MA Egbuta and MF Dutton, 2012. Fungal and mycotoxin contamination of South African commercial maize. J Food Agr Environ,10: 296-303. Creppy EE, 2002. Update of survey, regulation and toxic effects of
mycotoxins in Europe. Toxicol Lett, 127: 19-28.
Demet O, H Oguz, I Celik and H Adiguzel, 1995. Production of aflatoxin on wheat, corn, rice and peanut. Eurasian J Vet Sci, 11: 135-140.
Fazekas B and A Tar, 2001. Determination of zearalenone content in cereals and feedstuffs by immunoaffinity column coupled with liquid chromatography. J AOAC Int, 84: 1453-1459.
Fink-Gremmels J and H Malekinejad, 2007. Clinical effects and biochemical mechanisms associated with exposure to the mycoestrogen zearalenone. Anim Feed Sci Technol, 37: 326-341. Forsyt OM, T Yoshizawa, N Morooka and J Tuite, 1997. Emetic and
refusal activity of the deoxynivalenol to swine. Appl Environ Microb, 34: 547-552.
Gahukar RT, 2014. Food adulteration an contamination in India: occurrence, implication and safety measures. Inter J Basic Appl Sci, 3: 47-54.
Goyarts T, S Dänicke H Valenta and KH Ueberschär, 2007. Carry-over of Fusarium toxins (deoxynivalenol and zearalenone) from naturally contaminated wheat to pigs. Food Addit Contam, 24: 369-380.
Jubeen F, IA Bhatti, U Maqbool and S Mehboob, 2012. Fungal incidence, aflatoxin B-1, tocopherols and fatty acids dynamics in ground and tree nuts during storage at two moisture levels. Int J Agric Biol, 14: 521-527.
Juszkiewicz T and J Piskorsa-Pliszczynska, 1992. Occurrence of mycotoxins in animal feeds. J Environ Toxicol Oncol, 11: 211-215. Khan MZ, MR Hameed, T Hussain, A Khan, I Javed, I Ahmad, A Hussain,
MK Saleemi and NU Islam, 2013. Aflatoxin residues in tissues of healthy and sick broiler birds at market age in Pakistan: A one year study. Pak Vet J, 33: 423-427.
Kutay HC, 2003. Farkli bolgelerde hasat edilen yem hammaddelerinin ve fabrika yemlerinin deoksinivalenol (DON) duzeyleri bakimindan incelenmesi. Doctoral Thesis. Project No: T-1104/ 18062001. Oguz H, F Nizamlioglu, I Dinc, K Uney and H Aydın, 2011.
Determination of aflatoxin existence in mixed feed, heat flour and bulgur samples. Eurasian J Vet Sci, 27: 171-175.
Oruc HH, A Sorucu, II Turkmen and E Arslan, 2012. Determination of various mycotoxin concentrations in the feedstuffs and feed produced by a feed manufacturer in Turkey. Kafkas Univ J Fac Vet Med, 18: 633-638.
Ozpinar H, T Bilal, HC Kutay and I Abas, 2001. Mycotoxin
contamination in grain and animal food in Turkey. Proc 23rd
Mycotoxin Workshop, Wien, Austria, 28-30 May, 2001, pp: 40. Pleadin J, N Vahcic, N Persi, D Sevelj, K Markov and J Frece, 2013.
Fusarium mycotoxins’ occurrence in cereals harvested from Croatian. Food Control, 32: 49-54.
Pirestan A, SN Tabatabaei, MH Fazeli, M Antikchi and M Baabei, 2011. Coparison of HPLC and ELISA for determination of aflatoxin concentration in the milk and feeds of dairy cattle. Res J Agric Sci, 7: 71-78.
Sonal S and HH Oruc, 2000. Natural mycotoxin levels in mixed feed taken from poultry farm in Bursa Province. J Vet Med Univ Yuzuncu Yil, 1: 1-6.
Sokolovic M and B Simpraga, 2006. Survey of trichothecene mycotoxins in grains and animal feed in Croatia by thin layer chromatography. Food Control, 17: 733-740.
Sultana N, A Rashid, I Tahira, HU Hanif and NQ Hanif, 2013. Distribution of various mycotoxins in compound feed, total mix ration and silage. Pak Vet J, 33: 200-204.
Valcheva A and G Valchev, 2007. The fusariotoxins zearalenon and deoxinivalenol as natural contaminators of some basic cereal components in the production of combined feed. Bulg J Agric Sci, 13: 99-104.
Waśkiewicz A, I Morkunas, W Bednarski, VC Mai, M Formela, M Beszterda, H Wiśniewska and P Goliński, 2014. Deoxynivalenol and oxidative stress indicators in winter wheat inoculated with Fusarium graminearum. Toxins, 6: 575-591.
Yildiz G, 2009. Contamination of the aflatoxin, ochratoxin A and zearalenone in roughage feeds into the animal enterprise in Turkey between 2001-2004. J Lalahan Livest Res Inst, 49: 113-124. Yildiz G, Z Selcuk and T Sahin, 2005. Determination of mycotoxin (aflatoxin, zearalenone, ochratoxin A) contamination in some
feedstuffs in Turkey. 3rd National Animal Nutrition Congress,