ADYÜEBD Adıyaman Üniversitesi Eğitim Bilimleri Dergisi ISSN:2149-2727
DOI: http://dx.doi.org/10.17984/adyuebd.307020
TIMSS Matematik Verilerinin
Aşamalı Ölçme Modelleri ile İçerik,
Bilişsel ve Konu Alanları Bakımından İncelenmesi
Önder KÖKLÜ1*
1Adıyaman Üniversitesi, Eğitim Fakültesi, Adıyaman
MAKALE BİLGİ Ö Z ET Makale Tarihçesi: Alındı 19.04.2017 Düzeltilmiş hali alındı 05.12.2017 Kabul edildi 23.12.2017 Çevrimiçi yayınlandı 28.12.2017
Bu çalışmanın amacı, TIMSS 8. sınıf matematik testlerine katılan öğrencilerimizin dünyanın başka yerlerinde yaşayan akranlarına göre doğru cevaplamada güçlük çektikleri madde gruplarını ve bu gruplarını oluşturan maddelerin özelliklerini ortaya çıkarmaktır. Bu amaç dahilinde, ilk olarak, Türkiye’nin 1999, 2007 ve 2011 yıllarında katıldığı TIMSS 8. sınıf matematik testlerinin International Association for the Evaluation of Educational Achievement (İEA) tarafından yayınlanan bütün maddeleri (toplam 260 adet), yine IEA tarafından yayınlanan değerlendirme çerçevesi dokümanları ve belirtke tabloları takip edilerek içerik, bilişsel alan ve konu alanı itibariyle gruplara ayrılmıştır. Ardından, IEA’nın bir yıllık olarak hazırladığı almanaklar kullanılarak bu maddelere ait ortalama doğru cevaplama oranları ve bu oranların TIMSS katılımcıları arası dağılımları çıkarılmıştır. Son olarak, elde edilen veriler aşamalı doğrusal ölçme modelleri ile analiz edilerek madde grupları bağlamında Türkiye ile diğer TIMSS katılımcıları arası başarı düzeyi farklılıkları tahmin edilip test edilmiştir. Bulgular öğrencilerimizin “Sayılar” içerik alanı altında bulunan “Kesirler ve Ondalıklı Sayılar” konusu ile ilgili olgular, kavramlar ve yöntemlere ait bilgi düzeylerinin diğer ülkelerde yaşayan akranlarına göre oldukça düşük olduğunu göstermekte ve bu farklılık istatistiksel olarak anlamlı bulunmaktadır.
© 2017 AUJES. All rights reserved Anahtar Kelimeler: İki aşamalı doğrusal ölçme modelleri, matematik başarı düzeyi, TIMSS
Geniş Özet Amaç
Dünyanın birçok ülkesinde çocuklara sağlanan eğitim ve öğretimin kalitesini ve etkililiğini ölçmek için öğrenci performaslarını diğer ülkelerdeki akranlarının performsları ile karşılaştırma yöntemi kullanılmaktadır (Boş & Cuiper, 1999; Bishop, 1997). Bu
karşılaştırmalar yolu ile ülkeler eğitim ve öğretim sistemlerinin güçlü ve zayıf yönlerini dolaylı
olarak belirleyebilmektedirler. Uluslararası düzeyde katılımla yapılan TIMMS (Trends in International Mathematics and Science Study) ve PISA sınavları eğitim araştırmacılarına ve müfredat düzenleyicilerine bu konuda büyük olanaklar sağlamaktadır (Mullis, Martin, Ruddock, O`Sullivan, Preuschoff, 2009).
Türkiyede öğrencilerin TIMMS ve PISA sınavlarındaki başarılarının araşıtırılması
konusu son zamanlarda bir çok eğitimcinin ve eğitim araştırmacısının dikkatini çekmiştir.
Bundan dolayı öğrencilerimizin uluslararası sınavlardaki matematik başarısı ile ilgili yapılan eğitim araştırmalarında belirgin bir artış gözlenmektedir. Son 20 yıldır yapılan araştırma çalışmalarında öğrencilerin matematik başarısı üzerindeki bir çok etken incelenmesine rağmen içerik, bilişel ve konu alanı boyutlarının etkisi üzerine bir araştırma yapılmamıştır. Bundan dolayı matematik alanındaki başarısızlığın üzerinde içerik, bilişsel ve konu alanı faktörlerinin etkisi tam olarak bilinmemektedir (Delen & Bulut, 2011; Akyüz, 2006).
Ülkemiz 1999, 2007 ve 2011 yıllarında 8. sınıflar düzeyinde TIMSS matematik ve fen bilgisi sınavlarına katılmıştır. Bu çalışmada, Türkiye’nin katıldığı yıllara ait TIMSS 8. sınıf matematik testlerinin yayınlanan maddeleri, içerik, bilişsel alan ve konu alanı itibariyle gruplara ayrılmış ve belirlenen madde gruplarında, Türkiye’deki öğrenciler ile dünyanın başka yerlerinde yaşayan akranlarının başarı düzeyleri karşılaştırılmıştır. Çalışmanın amacı, Türkiye ile diğer TIMSS katılımcıları arası başarı düzeylerinin istatistiki olarak anlamlı farklılıklar gösterdiği madde gruplarını ortaya çıkarmaktır. Bu amaç dahilinde, TIMSS tarafından yayınlamış toplam 260 adet madde (Tablo 2), Aşamalı Ölçme Modelleri (Multilevel Measurement Models) kullanılarak analiz edilmiştir.
Yöntem Veriler
Uluslararası Eğitim Başarısı Değerlendirme Kuruluşu (International Association for the Evaluation of Educational Achievement (IEA)) tarafından geliştirilen Uluslararası Matematik ve Fen Eğilimleri Çalışması (Trends in International Mathematics and Science Study (TIMSS)), 4. ve 8. sınıf öğrencilerinin matematik ve fen bilimleri başarı düzeylerini belirlemek için kullanılan bir ölçme aracıdır. Bu çalışmada, Türkiyenin katıldığı 1999, 2007 ve 2011 yılları uygulamaları sonrası yayınlanan, 8. sınıf matematik test maddeleri, bu maddelere ilişkin içerik, bilişsel alan ve konu alanı bilgileri ile maddeleri ortalama doğru cevaplama oranı verileri incelenmiştir.
TIMMS Matematik Testi
TIMMS matematik testindeki maddelerin özelliklerini niteleyen üç temel alan vardır.
Bu üç ana alandan ilki içerik alanı olup “Sayılar”, “Cebir”, “Geometri” ve “Veri Analizi ve Olasılık” olmak üzere dört başlıktan oluşur. İkinci alan ise bu 4 temel başlık altında bulunan toplam 13 konu başlığından oluşan konu alanıdır. Üçüncü alan ise “Bilgi”, “Uygulama” ve “Akıl Yürütme” gibi davranışların tanımlandığı bilişsel alandır (Tablo 1).
Tablo 1.TIMSS Sekizinci Sınıf Matematik İçerik, Konu ve Bilişsel Alanlar
Icerik Alani Konu Alani Bilissel Alan
(1) Sayılar
(1) Doğal Sayılar
(2) Kesirler ve Ondalıklı Sayılar
(3) Tam Sayılar
(4) Oran, Oranti ve Yuzde
(1) Bilgi:
Bu alan ile ilgili maddeler öğrencilerin matematikle ilgili bilmesi gereken olguları, kavramları ve yöntemleri kapsar. (2) Cebir (1) Örüntüler (2) Cebirsel İfadeler (3) Denklemler/Formüller ve Fonksiyonlar (2) Uygulama :
Bu alan ile ilgili maddeler
öğrencilerin matematikle ilgili
problemleri çözmek veya sorulara cevap vermek için bilgilerini uygulayabilme yetenekerini ölçer.
(3) Geometri
(1) Geometrik Şekiller (2) Geometride Ölçme (3) Konum ve Hareket
(3) Akıl Yürütme:
Bu alan ile ilgili maddeler öğrencilerin sıradışı problemleri mantıksal ve
sistematik düşünme yoluyla çözebilme
yeteneklerini ölçer. (4) Veri Analizi ve Olasılık (1) Veri Düzenlenmesi ve Gösterimi (2) Verilerin Yorumlanması (3) Olasılık
1999, 2007 ve 2011 yıllarına ait sekizinci sınıf TIMSS matematik testlerinde toplam
594 madde kullanılmıştır. Toplam 594 maddenin 360 tanesi çoktan seçmeli ve 234 tanesi ise
açık uçludur (Tablo 2). Açık uçlu soruların çoğunluğu doğru-yanlış şeklinde iki kategoride ve kalan küçük bir kısmı ise 0-1-2 şeklinde ikiden fazla kategoride puanlanmıştır.
Tablo 2. TIMSS 8. Sınıf Matematik Testinde Kullanılan ve Yayınlanan Madde Sayıları
Testte Kullanılan Madde Sayıları Yayınlanan Madde Sayıları
Yıl Çoktan Seçmeli Açık Uçlu Toplam Çoktan Seçmeli
Açık Uçlu Toplam
1999 125 37 162 65 17 82 2007 117 98 215 50 38 88 2011 118 99 217 48 42 90 Toplam 360 234 594 163 97 260 Verilerin Analizi
Bu çalışmada kullanılan veriler birkaç aşamadan sonra oluşturulmuş ve analiz edilmiştir. Birinci aşamada, IEA’nın yıllık (almanac) olarak hazırladığı dokümandan R 2.14.2 programıyla (R Development Core Team, 2012) yayınlanan maddelere ait ortalama doğru
aşamada, IEA’nın yayınladığı TIMSS 8. sınıf matematik değerlendirme çerçevesi dokümanları ve belirtke tabloları takip edilerek içerik, bilişsel alan ve konu alanı itibariyle maddeler gruplara ayrılmıştır. Üçüncü aşamada, birinci ve ikinci aşamada elde edilen veriler SAS programı yardımıyla birleştirilmiş ve bir sonraki analiz aşaması için gerekli veri dosyaları oluşturulmuştur. Daha sonra, HLM-6 programı yardımıyla (Raudenbush, et al., 2004) İki Aşamalı Doğrusal Ölçme Modelleri kullanılarak veriler analiz edilmiştir.
HLM programıyla veri analizi aşamasında ise iki ana basamak bulunur. İlk basamak, Eşitlik 2’de ifade edilen ve sadece birinci düzey yordayıcılarının kullanıldığı ölçme modeli ile verilerin analizidir. Bu adımda, sekizinci sınıf matematik TIMSS katılımcılarının başarı düzeyleri belirlenmiş, bu sonuçlarının güvenirliği hesaplanmış ve IEA tarafından resmi olarak açıklanan katılımcılarına ait ortalama başarı düzeyleri ile karşılaştırılmıştır. İkinci basamak, Eşitlik 3’te belirtilen, hem birinci hemde ikinci düzey yordayıcılarının kullanıldığı ölçme modeli ile verilerin analizidir. Son adımdan elde edilen bulgular, bu çalışmanın amacında belirtildiği
gibi, Türkiye ile diğer TIMSS katılımcıları arasındaki başarı düzeyleri farkını madde gruplarını
bağlamında hesaplar ve istatistiki teste tabi tutar. Bulgular kısmında, sonuçlar ayrıntılarıyla verilmiştir.
Bulgular, Tartışma ve Sonuç
Verilerin analizi sonrasında elde edilen bulgular Türkiyedeki öğrencilerin diğer ülkelerdeki öğrencilerle karşılaştırılınca “Sayılar” içerik alanı altında bulunan “Kesirler ve Ondalıklı Sayılar” konu alanına ait bilişsel alanı “Bilgi” olan sorularda başarız oldukları görülmektedir. Bir başka deyişle Türkiyeden katılan öğrencilerin “Kesirler ve Ondalıklı Sayılar” konusu ile ilgili olgular, kavramlar ve yöntemlerde bilgi düzeylerinin diğer ülkelerin öğrencileri ile karşılaştırıldığında istatistiksel olarak anlamlı düzeyde düşük olduğu görülmektedir. Bu alandaki başarızlığın, öğrencilerimizin matematik başarı sıralamalarını anlamlı bir şekilde ve negatif olarak etkilediği tespit edilmiştir. Tablo 7’de yüksek ölçüde başarısız olunan soru örnekleri görülmektedir. Detaylı olarak incelendiğinde öğrencilerin yoğunluklu olarak ondalıklı sayılar ve kesirlerde işlemler ile ilgili sorular ve kesir, ondalık ve yüzde çevrimleri ile ilgili sorularda hata yaptıkları tespit edilmiştir.
Kesirler ve ondalıklı sayılar konusu 4. sınıf müfradatından başlamak üzere takip eden sınıflarda tekrar tekrar ele alınarak yoğunlukla üzerinde durulan bir konu olmasına rağmen öğrencilerimizin hala bu konuda bilgi düzeyinde diğer ülkelerden daha düşük başarı elde etmeleri bu çalışmanın en önemli bulgusudur. Bu sonuç bize hali hazırdaki öğretim yöntemlerinin kesirler ve ondalıklı sayılar alanında gözden geçirilmesi gereğini vurgulamaktadır.
Örneğin Bulgar (2003) kesirler ve ondalık sayılarda işlemsel algoritmaların teori temelinde değil öğrenciler için daha anlamlı içeriklerde kullanılarak öğretilmesi gereğini vurgulamaktadır. Teori temelinde kuralların ezberletilerek öğretildiği ortamlarda öğrencilerin kesirler ve ondalıklı sayılarda ki işlemsel kuralları hatırlamakta zorluk çektikleri çeşitli araştırma çalışmalarında (Davis & Maher, 1990; Maher & Alston, 1989) özellikle vurgulanmıştır.
Diğer önemli bir konu ise kesirler ve ondalıklı sayıların anlamlı öğreniminde daha önce öğrenilmiş bilgilerin kavram yanılgılarına sebep olmasıdır. Bir çok araştırma çalışması (Carpenter, 1988; De Corte, Greer, & Verschaffel, 1996; De Corte, Verschaffel, & Pauwels, 1990; Fischbein, Deri, Nello, & Marino, 1985; Greeno, 1991; Lehtinen, Merenluoto, & Kasanen, 1997; Resnick & Ford, 1981; Resnick et al., 1989; Resnick and Omanson, 1987), öğrencilerin kesirler ve ondalıklı sayıları öğrenmedeki güçlüklerinin önceki bilgilerin sebep olduğu kavram yanılgılarından kaynaklandığını vurgulamaktadır. Ayrıca bazı araştırma çalışmaları (Behr et al., 1992; Lamon, 1999) kesirler ve ondalıklı sayıların öğrenimindeki güçlüklerin aşılmasında öğretmenler tarafından daha fazla pratik yaptırılması gereğini vurgulamaktadır.
Sonuç olarak kesirler ve ondalıklı sayılar konusu matematik literatüründe öğrencilerin en çok zorlandıkları konular arasında yer almaktadır. Bu konuda yapılan sayısız araştırma çalışması anlamlı öğrenmenin gerçekleşmesi konusunda bir çok öneride bulunmuştur. Bu çalışmanın bir sonucu olarak ortaya çıkan öğrencilerimizin kesirler ve ondalıklı sayılar
konusu da bilgi düzeyindeki başarızlığın giderilmesinde yukarıda bahsi geçen çalışmalarda
önerilen yöntemlerin müfredat düzenleyicileri tarafından dikkate alınması gerekmektedir. Ayrıca müfredat uygulayıcıları olan öğretmenlerinde bu yöntem ve uygulamalar hakkında yeterli düzeyde bilgilendirilmesi gerekmektedir.
AUJES Adiyaman University Journal of Educational Sciences
ISSN:2149-2727
DOI: http://dx.doi.org/10.17984/adyuebd.307020
Examination of TIMSS Mathematics Data with Multilevel
Measurement Models in Respect to Content, Cognitive and Topic
Areas
Önder KÖKLÜ1*
1Adıyaman University Faculty of Education, Adıyaman
AR T I C L E I N F O A B ST R A C T Article History: Received 19.04.2017 Received in revised form 05.12.2017 Accepted 23.12.2017 Available online 28.12.2017
This research study aims to identify TIMMS 8th grade mathematics item groups and the specification of items in which Turkish 8th grade students have signıfıcantly lower level of correct responses compared to all other 8th grade participants. For this purpose, total 260 (82 from 1999, 88 from 2007, and 90 from 2011) items released by International Association for the Evaluation of Educational Achievement (IEA) were grouped according to cognitive, content and sub-content domains. Then, mean correct responses of released items for each participant country were obtained from IEA’s yearly almanac. Finally, data were analyzed by using Multilevel Measurement Models and differences in achievement levels between Turkish 8th graders and their peers from other participating countries were predicted and tested in the context of item groups. Analysis of data showed that performance of Turkish students statistically significantly lower than performance of students from rest of the other participant countries in Number (Content Domain)-Fractions and Decimals (Topic Area)-Knowing (Cognitive Domain) item group. Detailed investigation revealed that students generally fail in procedures in fractions and conversions among fraction, decimal, and percent.
© 2017 AUJES. Tüm hakları saklıdır Keywords: Two-level hierarchical linear measurement models, mathematics performance level, TIMSS
Introduction
In many countries around the world, comparison methods are being used in order to measure quality and effectiveness of education provided to students (Boş and Cuiper, 1999; Bishop, 1997). Educational policymakers, educators, and curriculum designers are able to identify strengths and weaknesses of their educational systems by comparing their students` achievement levels with the students’ achievement levels in other countries. International studies such as TIMSS and PISA provide good opportunities for educational policymakers, educational researchers and curriculum designers in order to conduct these kind of comparative research studies (Mullis, Martin, Ruddock, O`Sullivan, Preuschoff, 2009).
*Corresponding author’s address: Adıyaman University, Education Faculty. Adıyaman e-mail: [email protected]
The mathematics achievement of Turkish students in TIMSS and PISA has attracted the attention of researchers, educators, policymakers, and the general public in recent years in Turkey. Consequently, there is a growing body of research on factors that are linked to mathematics achievement. Although effects of various factors on students’ mathematics achievement have been hypothesized and investigated for the past two decades, few attempts have been made to systematically investigate the effects of content and cognitive domains. Thus, there are limited consistent and robust findings on content and cognitive factors related to mathematics achievement (Delen and Bulut, 2011; Akyüz, 2006).
Our 8th grade students participated in TIMSS mathematics and science studies in years 1999, 2007 and 2011. In this research study TIMSS 8th grade released mathematics items belonging to the years that Turkey participated were grouped in terms of content, cognitive and topic area domains. Afterwards, achievement levels of students from Turkey and other participated countries were compared for each of these item groups. Purpose of this study is to scrutinize the content, cognitive and topic area domains which negatively affect Turkish 8th grade students’ achievements in mathematics using the TIMSS 1999, 2007 and 2011 mathematics assessment data. Main objective is to identify specific item groups in which statistically significant differences exist between Turkish students’ and other participants’ mathematics achievement levels. For this purpose, 260 items, which were released by IEA, were analyzed by using Multilevel Measurement Models.
In educational measurement literature, two fundamental features of Multilevel Measurement Models have been mentioned as advantageous. First, these models are effective for analyzing the nested data since between and within group variances can be easily computed by these models (Kamata, Bauer, and Miyazaki, 2008). In other words, since hierarchical structure of a data set is considered, by using these models variances in different levels of the model which are independent from each other can be computed without violating the “independence of observations” which is a fundamental assumption of statistical methods. Problems emerging when “independence of observations” assumption is violated have been extensively discussed in Hierarchical modeling literature (Hox, 2005; Raudenbush; Bryk; 2002). Second, these models are flexible psychometric models that allow testing many research hypotheses. (Kamata, 2001; Bauer, 2003; De Boeck and Wilson, 2004; Skrondal and Rabe-Hesketh, 2004; Berevats and Kamata, 2005; Kamata, Bauer, and Miyazaki, 2008). In other words, psychometric structures formulated with these models allow investigating the prediction power of both independent variables in different levels and interaction. Applications of both linear and generalized linear forms of these models have been presented in various research studies (Kamata, Bauer, and Miyazaki, 2008; Kamata, 2001; Luppescu, 2002; Chu and Kamata, 2005; De Boeck and Wilson, 2004; Skrondal and Rabe-Hesketh, 2004; Berevats and Kamata, 2005; Acar, 2011; Atar, 2011; Chaimongkol, 2005; Binici, 2007; Kamata, Bauer and Miyazaki, 2008)
Method Data
Trends in International Mathematics and Science Study (TIMSS) is a measurement instrument which was developed by International Association for the Evaluation of Educational Achievement (IEA) in order to measure 4th and 8th grade students’ achievement levels in mathematics and science. TIMSS has been administered worldwide since 1995 in four year periods. Some part of the test items are released in order to be used in educational research studies without any commercial purposes. In this study, 8th grade mathematics items from the years 1999, 2007 and 2011 have been investigated in terms of items’ content, cognitive levels and average correct responses. Data have revealed that there are significant differences between released items and countries joined the assessment.
TIMMS Mathematics Test
The mathematics assessment framework for TIMSS is organized around two dimensions, a content dimension specifying the domains or subject matter to be assessed within mathematics (for example, number, algebra, geometry, and data and chance at the eighth grade) and a cognitive dimension specifying the domains or thinking processes to be assessed (that is, knowing, applying, and reasoning). The cognitive domains describe the sets of behaviors expected of students as they engage with the mathematics content. (Table 1).
Table 1. TIMSS 8th Grade Mathematics Content, and Cognitive Domains
Content Domain Topics Cognitive Domain
(1) Numbers
(1) Natural Numbers (2) Fractions and Decimals (3) Whole Numbers
(4) Ratio, Proportion and Percent
(1) Knowing:
Covers the facts, concepts, and procedures students need to know.
(2) Algebra
(1) Patterns
(2) Algebraic Expressions
(3) Equations/ Formulas and Functions
(2) Applying:
Focuses on the ability of students to apply knowledge and conceptual understanding to solve problems or answer questions
(3) Geometry
(1) Geometric Shapes (2) Geometric Measurement (3) Location and Movement
(3) Reasoning:
Goes beyond the solution of routine problems to
encompass unfamiliar situations, complex contexts, and multistep problems.
(4) Data Analysis and Probability
(1) Data Organization and Representation
(2) Data Interpretation (3) Chance
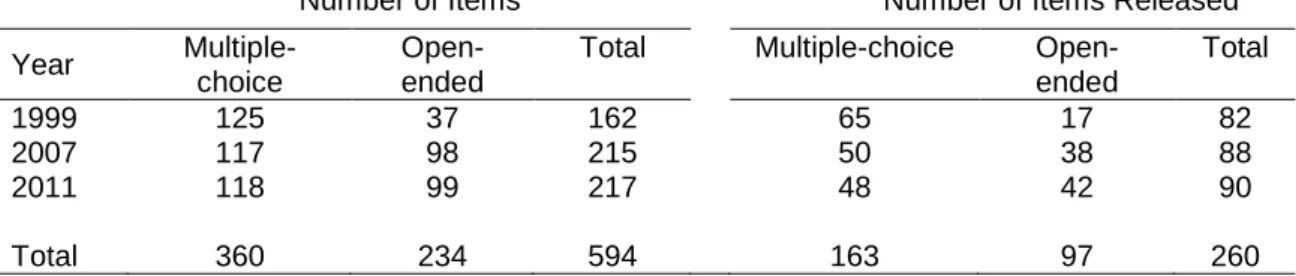
There were total 594 items used in TIMSS 1999, 2007 and 2011 8th grade mathematics tests. Of these 594 items 360 were multiple-choice items and 234 were open-ended items. 260 items out of 594 used in years 1999, 2007 and 2011 were released. 163 of these released items were multiple-choice items and 97 of those were open-ended items (Table 2).
Table 2. Distribution of items used in TIMSS 8th grade Mathematics Tests by administration year
Number of Items Number of Items Released Year
Multiple-choice
Open-ended
Total Multiple-choice Open-ended Total 1999 125 37 162 65 17 82 2007 117 98 215 50 38 88 2011 118 99 217 48 42 90 Total 360 234 594 163 97 260
Mean correct response rates for the released items are expressed on a scale between 0 and 100. The same scale is used for open-ended questions. However for the open-ended items that includes partial credits such as 0-1-2 mean correct response rates represent the rates of full correct response (2). These rates show differences between both released items and between participating countries and educational systems. Also, these rates comprise the dependent variable of two level linear hierarchical models.
Considering the Content Domain (4 groups), Cognitive Domain (3 groups) and Topic area (13 topics), a total of 156 (4x3x13) item groups can be made up for expressing all futures of each the individual item. However, only 39 of these item groups can be found explaining the 260 released items. In order to represent these groups in a systematic and more understandable way an index made up by using number codes. For example, Örneğin “Geometry-Geometric Shapes-Applying” item group is indicated as (3_1_2) by using codes shown in table 1.
Number of items in each item groups can be seen in Table 3 below. Item groups listed in table 3 are indicator variables, which express item features, in the first level of two-level linear hierarchical measurement model. If an item belongs to a group represented by indicator variable it is coded as “1” otherwise it is coded as “0”. In the second step of two-level linear hierarchical measurement model another indicator variable was made up to be able to identify “Turkey” among other participant countries or educational systems. This indicator variable is coded as “1” for “Turkey” coded as “0” for the remaining participants.
Data Analysis
Data used in this study were filtered and reorganized as result of series phases. Total 260 (82 from 1999, 88 from 2007, and 90 from 2011) released items used in TIMSS 8th grade mathematics tests were grouped according to cognitive, content and sub-content domains. Then, these item groups were analyzed by using Multilevel Measurement Models. Firstly, mean correct responses of released items for each participant country were obtained from IEA’s yearly almanac via R 2.14.2 software (R Development Core Team, 2012). Then, released items used in TIMSS
content domains. In the third level, data obtained from first and second phase of the study were combined via SAS program and data files needed for the next phase were made up. Finally, data were analyzed by using two-level linear measurement models via HLM-6 software (Raudenbush, et al., 2004).
Data analysis by HLM program involves two main steps. First step involves analysis of data by a measurement model (Eq2) using only first level predictors (achievement levels of all TIMSS participant countries). In this step, participants’ achievement levels in 8th grade mathematics test were identified and reliability of these results were computed by comparing real results of those released by IEA. In the second step, data were analyzed by a measurement model using both first and second level predictors (computing the differences in achievement level between Turkey and the all other participant countries in the context of item groups).
Two level Linear Measurement Models
Average rate of correct response variable is continues dependent variable in this model. This variable is expressed as percentage within the scale between 0 and 100.Hierarchic structure is considered when formulizing the relationship between variables. However, depending on nested structure of dependent variable levels of the model can be defined differently. According to multilevel linear measurement model defined by Kamata, Bauer and Miyazaki (2008), average correct responses for item groups are nested in individual participants. In this study, same methodology was followed but average correct responses for item groups were nested in groups of individuals. First level of the two-level measurement model is shown in Equation 1 in which “i” indicates item (i = 1, 2,..., İ), “j” indicates group of individuals (j = 1, 2,..., J) and k indicates predictor (k = 1, 2,..., K).
0 1 1 2 2 ... ( 1) ( 1)
ij j j ij j ij k j k ij Kj Kij ij
Y =π +π D +π D + +π − D − +π D +ε
Eq. 1
In this equation, Yij represents predicted outcome indicating average correct
response of individuals in group “j” for item “i” in the test. Similarly, Dkij represents value of item “i” for predictor variable “k”. In other words, it is an indicator variable that represents the item group where item “i” is. Model cannot be defined since all Dkijs were included in the model. However, this problem can be solved by equating expected value (average value) of the intersection parameter π to zero. Parameter 0 j
kj
π represents the effect of the predictor variable “k”. Basically it indicates the average rate of correct response of individual in group “j” for item “i”. Similarly, ε ij represents the error for achievement levels of individuals in group “j” for item group “i”. It is assumed that errors are normally distributed, average is equal to zero and variance isσ . 2
Parameters such as π and 0 j π presented in the first level of the model are kj defined as dependent variables in the second level of the model. In order to express that all item groups measure the same common construct, only intersection parameter π is tolerable to vary randomly between groups. All other parameters 0 j
kj
π are fixed between groups. In this case the second level of the model can be formulized as follows.
0 0 1 10 2 20 ( 1) ( 1)0 0 . . . j j j j k j k Kj K r π π β π β π β π β − − = = = = = Eq. 2
In the equation shown above, parametersβ , 10 β , 20 β(k−1)0 and β present rate K0 of correct responses for each item groups and they don’t change by groups. Since expected value of intersection parameter was equalized to zero before equation
π
0 j shown above does not have β00 constant in the right side of the equation. The term0 j
r
indicates achievement levels of groups. It is assumed that this variable is normally distributed with having 0 mean and τ00 variance.
Continues or non-continues variables which indicate groups’ features, can be added in the second level of the model. As aimed in this study, if the purpose is to compare average correct response rates of item groups in level two, an indicator variable can be made and added to the model. Therefore, second level of the modal is formulized as shown in Equation 3.
0 01 0 1 10 11 2 20 21 ( 1) ( 1)0 ( 1)1 0 ( ) ( ) ( ) . . . ( ) j j j j j j j k j k k j Kj K grup r grup grup grup π β π β β π β β π β β π β − − − = + = + = + = + = Eq. 3
Here, (grup)j is an indicator variable with two categories. While focal group
takes the value 1, reference group takes value 0. If indicator variable is used as a predictor for all item groups in model, model cannot be defined. Therefore, at least one of the item groups is selected as reference (last item group shown above) and indicator variable is not added as predictor. Coefficients β10, β , 20 β(k−1)0 and β K0 represent mean correct response of item groups for reference category. Coefficient
01
β represents the difference between mean correct responses for focal and
reference groups for selected reference item group (last item group above). Coefficients β11, β and21 β(k−1)1 represent the difference between mean correct responses for focal and reference groups for remaining item groups and is computed as deviation from coefficient β .01 Coefficientβ01 is called main effect since it shows the achievement level differences between groups in terms of reference item while coefficients β , β and β are called interaction effects since they represent the
deviation of achievement differences between groups from main effect. Therefore sum of the main effect and interaction effects gives the total effect. Interaction effects mentioned here are called as cross-level interaction effect in statistical literature and mentioned as fundamental advantage of hierarchical modeling over traditional modeling (Raudenbush and Bryk; 2002).
If we investigate the problem of independence of observations, mentioned in hierarchical modeling literature, based on the data set used in this study, the assumption of mean correct responses for high achieving groups are higher than the mean correct responses for low achieving groups violets the assumption of independence of observations. However with the use of hierarchical modeling in this study, assumption of independence of observations is satisfied.
The term (r0 j) shown in the second level in equation 2 and 3shows the achievement level of groups. If the number of subjects is increased, these models produce more reliable results in group level. (Kamata, Bauer and Miyazaki; 2008).
Findings
Two Level Measurement Model with Level-One Predictors Only
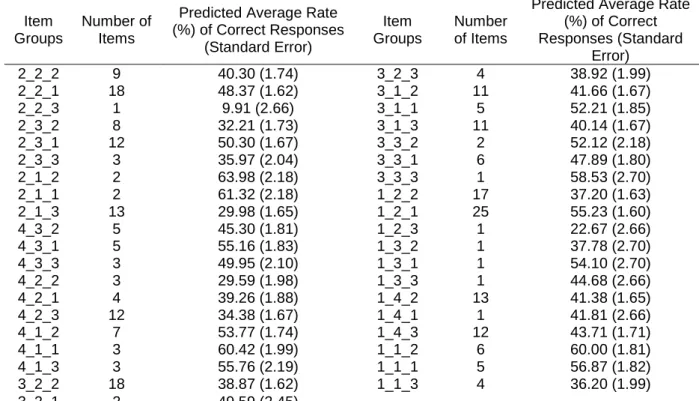
Analysis of data using this model reveals both average correct response for each item group and achievement levels of all TIMSS participant countries. Predicted average rate of correct responses and standard errors are shown in table 3 below. Average rate of correct responses for item groups are varying between 9.91 and 72.79 with a grand average of 43.11 presented in the percent scale.
Table 3. Item Groups’ Descriptive Item
Groups
Number of Items
Predicted Average Rate (%) of Correct Responses (Standard Error) Item Groups Number of Items
Predicted Average Rate (%) of Correct Responses (Standard Error) 2_2_2 9 40.30 (1.74) 3_2_3 4 38.92 (1.99) 2_2_1 18 48.37 (1.62) 3_1_2 11 41.66 (1.67) 2_2_3 1 9.91 (2.66) 3_1_1 5 52.21 (1.85) 2_3_2 8 32.21 (1.73) 3_1_3 11 40.14 (1.67) 2_3_1 12 50.30 (1.67) 3_3_2 2 52.12 (2.18) 2_3_3 3 35.97 (2.04) 3_3_1 6 47.89 (1.80) 2_1_2 2 63.98 (2.18) 3_3_3 1 58.53 (2.70) 2_1_1 2 61.32 (2.18) 1_2_2 17 37.20 (1.63) 2_1_3 13 29.98 (1.65) 1_2_1 25 55.23 (1.60) 4_3_2 5 45.30 (1.81) 1_2_3 1 22.67 (2.66) 4_3_1 5 55.16 (1.83) 1_3_2 1 37.78 (2.70) 4_3_3 3 49.95 (2.10) 1_3_1 1 54.10 (2.70) 4_2_2 3 29.59 (1.98) 1_3_3 1 44.68 (2.66) 4_2_1 4 39.26 (1.88) 1_4_2 13 41.38 (1.65) 4_2_3 12 34.38 (1.67) 1_4_1 1 41.81 (2.66) 4_1_2 7 53.77 (1.74) 1_4_3 12 43.71 (1.71) 4_1_1 3 60.42 (1.99) 1_1_2 6 60.00 (1.81) 4_1_3 3 55.76 (2.19) 1_1_1 5 56.87 (1.82) 3_2_2 18 38.87 (1.62) 1_1_3 4 36.20 (1.99) 3_2_1 2 49.59 (2.45)
As indicated in Table 4, predicted within-participants variance , 2 ˆ
σ , of average rate of correct responses is 279.27 and predicted between-participants variance ,τ , ˆ00
is approximately 185.14. Obtained variances are statistically significant (p-value <0.001, SD=79) in 0.05 alpha level.
Table 4. Two Level Measurement Model with Level-One Predictors Only
Random Effect Parameter Variance Degrees of Freedom (df) Chi-Square value p- value Level-2 Error Term τˆ00 185.14 79 9395.08 <0.001 Level-1 Error Term 2 ˆ σ 279.27
Reliability coefficient , ˆr, of predicted achievement levels of all TIMSS participants was found as 0.96 as a result of following computation shown below by using variances and number of item groups (n) given in Table 6. This value indicated that achievement levels among all TIMSS participant countries were predicted reliably with two level measurement model.
00 2 00 ˆ 185.14 ˆ 0.96 ˆ ˆ / 185.14 279.27 / 39 r n τ τ σ = = = + +
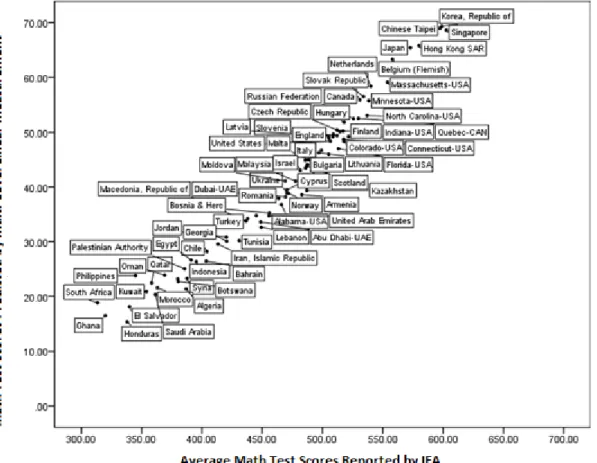
As shown in Figure 1 there is a strong, positive and linear correlation (r=0.98) between achievement levels of all TIMSS participant countries predicted by two level measurement model and achievement levels reported by IEA (for the years 1999, 2007 and 2011). Predicted mathematics achievement levels are varying between 15.36 and 69.34 with an average of 40.54.
Figure 1. Comparison of Achievement Levels Reported By IEA and Predicted Achievement
Two Level Measurement Model with Level-One and Level-Two Predictors
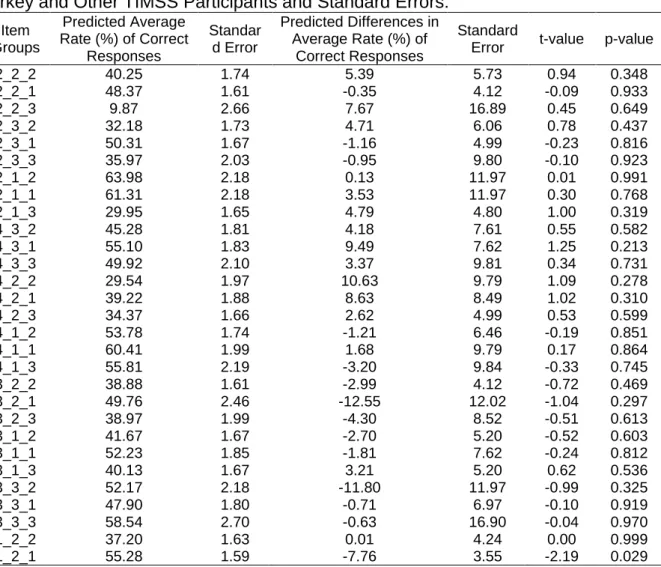
Both average rate of correct responses and standard errors for each item group for all TIMSS participants (80 , including Turkey) were predicted by previous model. Achievement level differences between Turkey and all other participants for each item group were predicted and tested statistically by this model. Predicted differences in average rate of correct responses, standard errors, t-values, and p-values were given in table 5. As seen in table, while differences are between -12.55 and 10.63, the average difference was found to be approximately 0.24 in a scale ranging 0-100. In this scale, positive values show that achievement level of Turkey is higher than other participants and negative values show the opposite. The highest negative difference between Turkey and other participant countries was found to be in Number-Fractions and Decimals-Knowing (1_2_1) group. The highest positive difference between Turkey and other participant countries was found to be in Data Analysis and Probability-Data Interpretation-Knowing (4_3_1) group. As seen in Table 5, t-values and p-values indicated that predicted difference for (1-2-1) item group (-7.76) was found to be statistically significant in 0.05 alpha level. In other words, students in Turkey have lower achievement levels in (1-2-1) item group comparing to their peers in all other participant countries.
Table 5. Predicted Differences in Average Rate of Correct Responses Between
Turkey and Other TIMSS Participants and Standard Errors.
Item Groups Predicted Average Rate (%) of Correct Responses Standar d Error Predicted Differences in Average Rate (%) of Correct Responses Standard
Error t-value p-value
2_2_2 40.25 1.74 5.39 5.73 0.94 0.348 2_2_1 48.37 1.61 -0.35 4.12 -0.09 0.933 2_2_3 9.87 2.66 7.67 16.89 0.45 0.649 2_3_2 32.18 1.73 4.71 6.06 0.78 0.437 2_3_1 50.31 1.67 -1.16 4.99 -0.23 0.816 2_3_3 35.97 2.03 -0.95 9.80 -0.10 0.923 2_1_2 63.98 2.18 0.13 11.97 0.01 0.991 2_1_1 61.31 2.18 3.53 11.97 0.30 0.768 2_1_3 29.95 1.65 4.79 4.80 1.00 0.319 4_3_2 45.28 1.81 4.18 7.61 0.55 0.582 4_3_1 55.10 1.83 9.49 7.62 1.25 0.213 4_3_3 49.92 2.10 3.37 9.81 0.34 0.731 4_2_2 29.54 1.97 10.63 9.79 1.09 0.278 4_2_1 39.22 1.88 8.63 8.49 1.02 0.310 4_2_3 34.37 1.66 2.62 4.99 0.53 0.599 4_1_2 53.78 1.74 -1.21 6.46 -0.19 0.851 4_1_1 60.41 1.99 1.68 9.79 0.17 0.864 4_1_3 55.81 2.19 -3.20 9.84 -0.33 0.745 3_2_2 38.88 1.61 -2.99 4.12 -0.72 0.469 3_2_1 49.76 2.46 -12.55 12.02 -1.04 0.297 3_2_3 38.97 1.99 -4.30 8.52 -0.51 0.613 3_1_2 41.67 1.67 -2.70 5.20 -0.52 0.603 3_1_1 52.23 1.85 -1.81 7.62 -0.24 0.812 3_1_3 40.13 1.67 3.21 5.20 0.62 0.536 3_3_2 52.17 2.18 -11.80 11.97 -0.99 0.325 3_3_1 47.90 1.80 -0.71 6.97 -0.10 0.919 3_3_3 58.54 2.70 -0.63 16.90 -0.04 0.970 1_2_2 37.20 1.63 0.01 4.24 0.00 0.999 1_2_1 55.28 1.59 -7.76 3.55 -2.19 0.029
Table 5. Continued 1_2_3 22.67 2.66 -1.79 16.89 -0.11 0.916 1_3_2 37.80 2.70 -5.18 16.90 -0.31 0.759 1_3_1 54.08 2.70 4.41 16.90 0.26 0.794 1_3_3 44.70 2.66 -6.20 16.89 -0.37 0.713 1_4_2 41.38 1.64 -0.50 4.80 -0.10 0.918 1_4_1 41.82 2.66 -2.75 16.89 -0.16 0.871 1_4_3 43.71 1.71 0.42 5.00 0.08 0.934 1_1_2 60.00 1.81 0.99 6.98 0.14 0.888 1_1_1 56.85 1.82 2.74 7.61 0.36 0.718 1_1_3 36.20 1.91 -0.81 8.50 -0.10 0.924
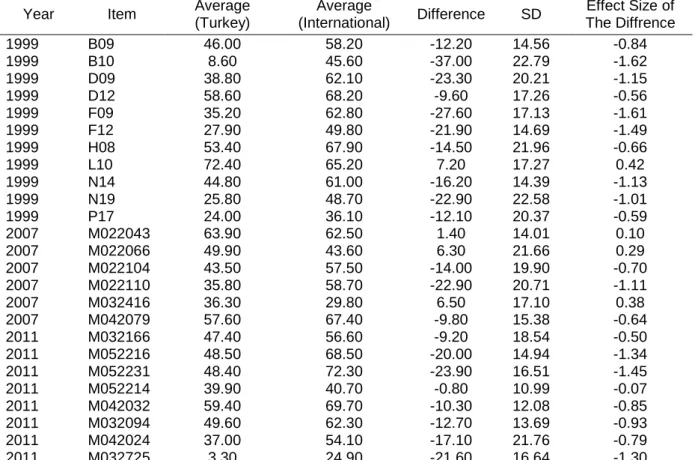
Upon each administration of the test IEA publishes reports including average correct responses for each item by participant countries. Differences between averages and standard deviations were computed by using the information in IEA reports and given in Table 6. Considering these information, it was clearly observed that participants from Turkey performed lower than the other participants in approximately 85% of the 25 items in 1_2_1 item group. For example while 48.40% of the participants from Turkey correctly answered the item M052231, 72.30% of the all other participants correctly answered the same item. In other words, for this specific item the achievement level of Turkish participants is 23.90% lower than the achievement level of all other participants.
Table 6. Average Scores for Items in Number-Fractions and Decimals-Knowing
(1_2_1) Group.
Year Item Average (Turkey) Average (International) Difference SD Effect Size of The Diffrence 1999 B09 46.00 58.20 -12.20 14.56 -0.84 1999 B10 8.60 45.60 -37.00 22.79 -1.62 1999 D09 38.80 62.10 -23.30 20.21 -1.15 1999 D12 58.60 68.20 -9.60 17.26 -0.56 1999 F09 35.20 62.80 -27.60 17.13 -1.61 1999 F12 27.90 49.80 -21.90 14.69 -1.49 1999 H08 53.40 67.90 -14.50 21.96 -0.66 1999 L10 72.40 65.20 7.20 17.27 0.42 1999 N14 44.80 61.00 -16.20 14.39 -1.13 1999 N19 25.80 48.70 -22.90 22.58 -1.01 1999 P17 24.00 36.10 -12.10 20.37 -0.59 2007 M022043 63.90 62.50 1.40 14.01 0.10 2007 M022066 49.90 43.60 6.30 21.66 0.29 2007 M022104 43.50 57.50 -14.00 19.90 -0.70 2007 M022110 35.80 58.70 -22.90 20.71 -1.11 2007 M032416 36.30 29.80 6.50 17.10 0.38 2007 M042079 57.60 67.40 -9.80 15.38 -0.64 2011 M032166 47.40 56.60 -9.20 18.54 -0.50 2011 M052216 48.50 68.50 -20.00 14.94 -1.34 2011 M052231 48.40 72.30 -23.90 16.51 -1.45 2011 M052214 39.90 40.70 -0.80 10.99 -0.07 2011 M042032 59.40 69.70 -10.30 12.08 -0.85 2011 M032094 49.60 62.30 -12.70 13.69 -0.93 2011 M042024 37.00 54.10 -17.10 21.76 -0.79 2011 M032725 3.30 24.90 -21.60 16.64 -1.30
Effect size, as seen in the last column in Table 6, expresses the differences in a more meaningful format by using standard deviation scale. Effect size was
example, effect size belonging to item M052231 was found to be (-1.45) which means achievement level of Turkish participants approximately 1.5 standard deviation lower than the average achievement level.
Discussion
As we see examples all around the world, fundamental reform movement in mathematics curriculum involving revisions and changes have been done in the in Turkey starting from the year 2005. International measurement studies such as TIMMS are indispensable tools to be able to better understand the resulting effects of these curriculum reforms in long run. From this perspective, results of this is important to understand the some of the effects of these recent curriculum reform by comparing the students achievement levels in TIMSS 8th grade mathematics test administered in years 1999, 2007 and 2001. Therefore the aim of this study was to investigate and identify the item groups that reveal statistically significant differences in achievement levels between participants from Turkey and the participants from the rest of the other countries or educational systems. For this purpose, 260 TIMSS items released from IEA were analyzed by two-level linear hierarchical measurement model.
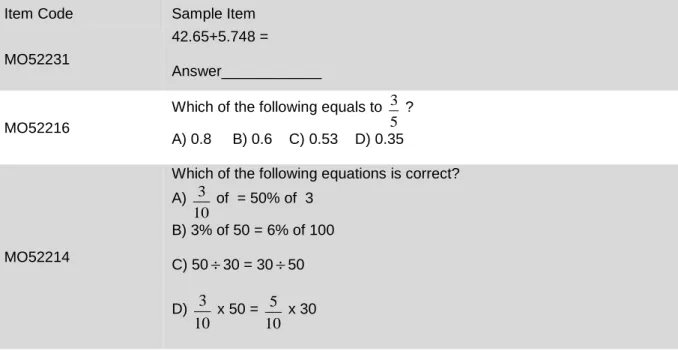
Analysis of data showed that performance of Turkish students statistically significantly lower than performance of students from rest of the other participant countries in items which are grouped under Number (Content Domain)-Fractions and Decimals (Topic Area)-Knowing (Cognitive Domain) item group. Detailed investigation revealed that students generally fail in procedures in fractions and conversions among fraction, decimal and percent. Failure in this area is negatively affecting the Country’s rating among all participant countries and educational systems. Sample items on which our students were mostly unsuccessful can be seen in Table 7.
Table 7. Sample Items in Numbers-Fractions and Decimals-Knowing group. Item Code Sample Item
MO52231
42.65+5.748 =
Answer____________
MO52216
Which of the following equals to
5 3 ?
A) 0.8 B) 0.6 C) 0.53 D) 0.35
MO52214
Which of the following equations is correct? A) 10 3 of = 50% of 3 B) 3% of 50 = 6% of 100 C) 50÷30 = 30÷50 D) 10 3 x 50 = 10 5 x 30
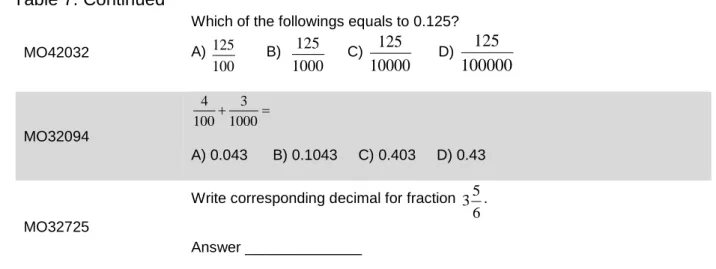
Table 7. Continued
MO42032
Which of the followings equals to 0.125? A) 100 125 B) 1000 125 C) 10000 125 D) 100000 125 MO32094 = + 1000 3 100 4 A) 0.043 B) 0.1043 C) 0.403 D) 0.43 MO32725
Write corresponding decimal for fraction
6 5 3 .
Answer ______________
In a detailed analysis the data revealed that most students have trouble understanding decimals. They confuse them with whole numbers or with fractions. They find it very difficult to understand decimal fractions as an extension of place value as used for ones, tens, hundreds, and thousands. They have also difficulties in percent conversions
Although students are exposed to the subject “Fractions and Decimals” starting from as early as 4th grade, results of this study revealed that most children still have trouble understanding fractions and decimals. Students find it very difficult to make conversion among decimals, fractions and percent’s. The results of this research suggest major changes in fractions and decimals part of the curriculum. It is also helpful for teachers to know that there are many ways and very useful methods for helping students. A full understanding of decimals and fractions comes more gradually, and involves facing ideas that conflict with what they know about numbers. The use of problems in which every day uses of decimals and fractions together rather than a meaningless manipulation of numbers would eliminate the misconceptions, because it forces students to make use of their everyday knowledge.
For instance, Bulgar (2003) stressed that decimals and fractions should be taught in more meaningful ways to students by using meaningful context. rather than solely based on theories. Research studies (Davis & Maher, 1990; Maher & Alston, 1989) showed that students have difficulties understanding decimals and fractions if they forced to memorize procedural rules.
Another important point is that previous knowledge may lead to misconceptions on learning decimals and fractions. Numerous research studies (Birgin & Gürbüz, 2009; Carpenter, 1988; De Corte, Greer, & Verschaffel, 1996; De Corte, Verschaffel, & Pauwels, 1990; Fischbein, Deri, Nello, & Marino, 1985; Greeno, 1991; Lehtinen, Merenluoto, & Kasanen, 1997; Resnick & Ford, 1981; Resnick et al., 1989; Resnick and Omanson, 1987) particularly stressed that difficulties in learning decimals and fractions are rooted in misconceptions caused by previous knowledge. Some other research (Behr et al., 1992; Lamon, 1999) on learning decimals and
fractions recommends increasing drill and practice applications in order to enhance learning.
As a result the conception of decimals and fractions is among the topic that students have much more difficulties comparing the other concepts in mathematics. These research studies have numerous recommendations in terms of providing opportunities in order to ensure meaningful and conceptual understanding. Recommendations mentioned above in this study should be taken into consideration by curriculum developers to remedy students’ difficulties in learning fractions and decimals. In addition classroom teachers should be well informed about the changes in this field by workshops and in-service training opportunities.
References
Acar, T. (2011). Maddenin Farklı Fonksiyonlaşmasında Örneklem Büyüklüğü: Genelleştirilmiş Aşamalı Doğrusal Modelleme Uygulaması. Kuram ve Uygulamada Eğitim Bilimleri 11(1), 279-288.
Bauer D. J. (2003). Estimating Multilevel Linear Models as Structural Equation Models. Journal of Educational and Behavioral Statistics. Vol. 28, No. 2, pp. 135-167.
Behr, M. J., Harel, G., Post, T., & Lesh, R. (1992). Rational number, ratio, and proportion. In D. A.Grouws (Ed.), Handbook of research on mathematics teaching and learning (pp. 296–333). New York: Macmillan.
Binici, S. (2007). Random-effects differential item functioning via hierarchical generalized linear model and generalized linear latent mixed model: A comparison of estimation methods. Unpublished doctoral dissertation, Florida State University.
Birgin, O. & Gürbüz, R. (2009). İlköğretim İkinci Kademe Öğrencilerinin Rasyonel Sayılar Konusundaki İşlemsel ve Kavramsal Bilgi Düzeylerinin İncelenmesi. Uludağ Üniversitesi Eğitim Fakültesi Dergisi, 22(2), 529-550.
Bulgar, S. (2003). Children’s sense-making of division of fractions. Journal of Mathematical Behavior, 22, 319-334.
Carpenter, T. (1988). Teaching as problem solving. In R. Charles, & E. Silver (Eds.), The teaching and assessing of mathematical problem solving (pp. 187–202). Reston, VA: National Council of Teachers of Mathematics.
Chaimongkol, S. (2005). Modeling differential item functioning (dif) using multilevel logistic regression models: A Bayesian Perspective. Unpublished doctoral dissertation. Florida State University.
Chu KL, Kamata A.(2005). Test equating in the presence of DIF items. Journal of Appl Meas. 6(3):342-54.
Davis, R. B., & Maher, C. A. (1990). What do we do when we ‘do mathematics’? In: N. Noddings (Ed.), Constructivist views of the teaching and learning of mathematics (Vol. Monograph No. 4). Reston, VA: National Council of Teachers of Mathematics.
De Corte, E., Greer, B., & Verschaffel, L. (1996). Mathematics teaching and learning. In D. C. Berliner,& R. C. Calfee (Eds.), Handbook of educational psychology (pp. 491–549). New York: Macmillan.
De Corte, E., Verschaffel, L., & Pauwels, A. (1990). Influence of the semantic structure of word problems on second graders’ eye movements. Journal of Educational Psychology, 82, 359–365.
Fischbein, E., Deri, M., Nello, M. S., & Marino, M. S. (1985). The role of implicit models in solving verbal problems in multiplication and division. Journal for Research in Mathematics Education, 1985(16), 3–17.
Greeno, J. G. (1991). Number sense as situated knowing in a conceptual domain. Journal for Research in Mathematics Education, 22(3), 170–218.
Kamata, A. (2001). Item Analysis by the Hierarchical Generalized Linear Model. Journal of Educational Measurement. Vol. 38, No. 1 (Spring, 2001) , pp. 79-93.
Kamata, A., Bauer, D.J. & Miyazaki, Y. (2008). Multilevel measurement modeling. In A.A. O'Connell & D.B. McCoach (Eds.) Multilevel Modeling of Educational Data (pp. 345-388). Charlotte, NC: Information Age Publishing.
Kamata, A. (2001). Item Analysis by the Hierarchical Generalized Linear Model. Journal of Educational Measurement, 38, 79-93.
Kamata, A., & Binici, S. (2003). Random Effect DIF Analysis via Hierarchical Generalized Linear Modeling. Paper presented at the biannual meeting of Psychometric Society, July, Sardinia, Italy.
Kamata, A., & Vaughn, B. K. (2004). An Introduction to Differential Item Functioning Analysis. Learning Disabilities: A Contemproary Journal, 2(2), 49-64.
Kamata, A., Chaimongkol, S., Genc, E., & Bilir, K. (2005). Random-Effect Differential Item Functioning Across Group Unites by the Hierarchical Generalized Linear Model. Paper presented at the annual meeting of the American Educational Research Association, April, Montreal, Canada.
Kim, W. (2003). Development of a differential item functioning (DIF) procedure using the hierarchical generalized model: a comparison study with logistic regression procedure. Unpublished doctoral dissertation. Pennsylvania State University. Lamon, S. J. (1999). Teaching fractions and ratios for understanding. Mahwah, NJ,
USA: Lawrence Erlbaum Associates, Inc.
Lehtinen, E., Merenluoto, K., & Kasanen, E. (1997). Conceptual change in mathematics: from rational to (un)real numbers. European Journal of Psychology of Education, XII(2), 131–145.
Luppescu, S. (2002). DIF detection in HLM. Paper presented at the annual meeting of the American Educational Research Association, New Orleans.
Maher, C. A., and Alston, A. (1989). Is meaning connected to symbols? An interview with Ling Chen. The Journal of Mathematical Behavior, 8(3), 241-248.
Miyazaki, Y.& Kenneth A. F. (2006). A Hierarchical Linear Model with Factor Analysis Structure at Level 2. Journal of Educational and Behavioral Statistics.Vol. 31, No. 2, pp. 125-156.
R Development Core Team (2012). R: A language and Environment for Statistical Computing. R Foundation for Statistical Computing, Vienna, Austria.
Raudenbush, S.W., Bryk, A.S, & Congdon, R. (2004). HLM 6 for Windows. Hierarchical linear and non-linear modeling. Lincolnwood, IL: Scientific Software International.
Raudenbush, S. W., & Bryk, A. S. (2002). Hierarchical linear models: Applications and data analysis methods. 2nd edition. Sage Publications Inc. Newbury, CA. Resnick, L. B., & Ford, W. W. (1981). The psychology of mathematics for instruction.
Hillsdale, NJ: Lawrence Erlbaum Associates.
Resnick, L. B., Nesher, P., Leonard, F., Magone, M., Omanson, S., & Peled, I. (1989). Conceptual bases of arithmetic errors: the case of decimal fractions. Journal of Research in Mathematics Education, 20(1), 8–27.
Resnick, L. B., & Omanson, S. (1987). Learning to understand arithmetic. In R. Glaser (Ed.), Advances in instructional psychology, Vol. 3. (pp. 41–95). Hillsdale, NJ: Erlbaum.
Skrondal, A. & Rabe-Hesketh, S. (2004). Generalized Latent Variable Modeling: Multilevel, Longitudinal, and Structural Equation Models. New York: Chapman & Hall/CRC.