i
Pt-FREE PEROVSKITE BASED OXIDATION CATALYSTS FOR
AUTOMOTIVE APPLICATIONS
A THESIS
SUBMITTED TO THE DEPARTMENT OF CHEMISTRY
AND THE GRADUATE SCHOOL OF ENGINEERING AND SCIENCE OF BİLKENT UNIVERSITY
IN PARTIAL FULFILLMENT OF THE REQUIREMENTS FOR THE DEGREE OF
MASTER OF SCIENCE
By Merve Doğaç
ii
I certify that I have read this thesis and that in my opinion it is fully adequate, in scope and in quality, as a thesis for the degree of Master of Science.
………. Assist. Prof. Emrah Özensoy (Advisor)
I certify that I have read this thesis and that in my opinion it is fully adequate, in scope and in quality, as a thesis for the degree of Master of Science.
………. Prof. Dr. Ömer Dağ
I certify that I have read this thesis and that in my opinion it is fully adequate, in scope and in quality, as a thesis for the degree of Master of Science.
………. Assist. Prof. Dr. Hande Toffoli
Approved for the Graduate School of Engineering and Science: ……….
Prof. Dr. Levent Onural Director of the Graduate School
i
ABSTRACT
Pt-FREE PEROVSKITE BASED OXIDATION CATALYSTS FOR
AUTOMOTIVE APPLICATIONS
Merve Doğaç M.S. in Chemistry
Supervisor: Assist. Prof. Emrah Özensoy July, 2013
Textural properties, structural integrity and NOx/SOx adsorption/release properties of
LaMnO3, Pd/LaMnO3, LaCoO3 and Pd/LaCoO3 type perovskites were studied via
in-situ FTIR, ex-in-situ FTIR, TPD, XRD, XPS and N2 sorption. Adsorption geometries of
NOx species on the synthesized samples were determined via in-situ FTIR, which
revealed similar NOx adsorption types for all perovskites. The NOx adsorption
capacity (NSC) of LaMnO3 is higher than that of LaCoO3, due to the higher specific
surface area and the higher crystallization temperature of the Mn-based perovskite. In situ FTIR and TPD experiments showed that incorporation of Pd into the perovskite structure does neither have a significant influence on the type of adsorbed NOx species nor on the NSC. However, the surface structures of perovskites
significantly change after reduction in H2 atmosphere, leading to drastic increase in
the uptake of NOx. Although NOx adsorption behavior of LaCoO3 and Pd/LaCoO3
are quite similar, Pd has significant influence on preserving the structural integrity of Pd/LaCoO3 upon reduction with H2 at 623 K. Moreover, TPD measurements showed
that complete reduction of surface nitrite/nitrate groups was observed for Co-based perovskites with the appearance of a N2 (28 a.m.u) signal. SOx adsorption/desorption
behavior of LaMnO3, Pd/LaMnO3, LaCoO3, and Pd/LaCoO3, was also investigated
via in-situ FTIR. Sulfation of the perovskite surfaces reveals the presence of surface sulfite/sulfate and bulk-like sulfate species. Pd incorporation into both LaMnO3 and
LaCoO3 significantly increases the SOx storage on the surface. Investigation of the
SOx release characteristics of LaMnO3 and Pd/LaMnO3 showed that although
Pd-containing sample stores significantly more SOx, it can also release a large fraction
of the adsorbed SOx species in a reversible fashion via thermal regeneration.
ii
on both LaCoO3 and Pd/LaCoO3 with the formation of bulk sulfates where thermal
regeneration is not effective. For investigating the reduction of sulfate/sulfite species and the regeneration of the sulfur-poisoned catalysts under reducing conditions, desulfation experiments were performed by utilizing H2. This set of experiments
showed that although containing perovskites store more sulfur compared to Pd-free counterparts, they can be efficiently regenerated with H2 at significantly lower
temperatures. Thus, these results suggest that Pd-promoted Mn-based perovskite systems are promising oxidation catalysts revealing high NOx oxidation capability,
high NSC and enhanced sulfur tolerance.
Keywords: Perovskite, NOx storage, LaMnO3, Pd/LaMnO3, LaCoO3, Pd/LaCoO3,
iii
ÖZET
OTOMOTİV UYGULAMALARI İÇİN PLATİN İÇERMEYEN
PEROVSKİT TABANLI OKSİDASYON KATALİZÖRLERİ
Merve Doğaç
Kimya Yüksek Lisans Tezi Danışman: Yrd. Doç. Dr. Emrah Özensoy
Temmuz, 2013
LaMnO3, Pd/LaMnO3, LaCoO3 and Pd/LaCoO3 tipi perovskitlerin yapısal özellikleri
ve NOx/SOx adsorpsiyon / desorpsiyon özellikleri, in-situ FTIR, TPD, XRD, XPS ve
BET ile çalışılmıştır. Perovskit üzerindeki NOx adsorpsiyon geometrileri in-situ
FTIR ile belirlenmiştir ve tüm perovskitler benzer NOx adsorpsiyon profili
göstermektedir. LaMnO3 ‘ün NOx depolama kapasitesi, LaCoO3 ‘den daha fazladır.
Bunun nedeni, Mn içeren perovskitin XRD de gösterildiği gibi, daha yüksek sıcaklıklarda kristalleşmesinden dolayı; spesifik yüzey alanının Co içeren perovskite göre daha yüksek olmasıdır. In-situ FTIR ve TPD deneylerinde elde edilen sonuçlara göre, perovskit yapılarına Pd eklenmesi, adsorplanmış NOx türlerinde veya NOx
depolama kapasitesinde önemli bir değişikliğe yol açmamıştır. Fakat, perovskitler, H2 (g) ortamında indirgendiklerinde, yüzey yapılarında ciddi değişimler ortaya
çıkmaktadır. Bunun sonucu olarak, NOx depolama kapasitelerinde, ciddi bir artış
gözlenmektedir. LaCoO3 ve Pd/LaCoO3 malzemelerinin, NOx adsorpsiyonları ciddi
benzerlik göstermesine ragmen, indirgenme ortamında Pd’un perovskit ile birlikte bulunması yapıyı korumada ciddi önem taşımaktadır. Ayrıca, Co içeren perovskitleri üzerinde yapılan TPD deneylerinde, H2 (g) ile nitrit/nitrat türlerinin tam indirgenmesi
sonucu, N2 (28 a.m.u) sinyali gözlenmiştir. LaMnO3, Pd/LaMnO3, LaCoO3 ve
Pd/LaCoO3 tipi perovskitlerin, SOx adsorpsiyon ve desorpsiyon davranışları da
in-situ FTIR ile incelenmiştir. Perovskitlerin kükürt ile zehrlenmesinden sonra, yüzeyde sülfit/sülfat ve iyonik sülfatlar görülmüştür. Hem Co içeren, hem de Mn içeren perovskitlere Pd eklenmesi sonucunda, SOx depolamada ciddi artış gözlenmektedir.
Pd içeren Mn tabanlı perovskit, Pd içermeyen perovskite göre çok daha ciddi miktarda fazla kükürt depolamasına ragmen; Pd içeren perovskitte depolanan kükürtün büyük kısmı, yüksek sıcaklıkla gerçekleştirilen, ısıl rejenerasyon işlemi
iv
sonucunda, yüzeyden temizlenebilmektedir. Co içeren perovskit için bu geçerli değildir. Kükürt zehirlenmesinin, LaCoO3 ve Pd/LaCoO3 perovskitleri için ısıl olarak
tersinir olmadığı gözlenmiştir. Sülfat/sülfit türlerinin indirgenmesi ve zehirlenen katalizörlerin rejenerasyonu için perovskitler, H2 gazı ortamında ısıtılmıştır. Bu
deneyler sonucunda, Pd içeren perovskitlerin, Pd içermeyenlere oranla daha çok SOx
tutmasına ragmen, sülfürlerin önemli kısmını düşük sıcaklık ve H2 ortamında geri
bıraktığı görülmüştür. Pd içermeyen perovskitlerde, yüzeydeki SOx türleri, Pd
içerenlere nispeten daha yüksek bir ısıl kararlılığa ve H2 (g) ile indirgenmeye karşı
daha kuvvetli bir direnç göstermiştir. Ayrıca Co tabanlı perovskitlerin yüzeyindeki SOx türlerinin, Mn içeren perovskitlere göre daha kararlı olduğu saptanmıştır. Tüm
bu sonuçlar toplu olarak değerlendirildiğinde, Mn temelli ve Pd ile katkılandırılmış perovskitlerin, yüksek NOx oksitleme ve depolama potansiyeline ve yüksek kükürt
direncine sahip umut verici bir oksidayon katalizörü olduğu sonucuna varılmıştır.
Anahtar Kelimeler: Perovskit, NOx depolama, LaMnO3, Pd/LaMnO3, LaCoO3,
v
vi
ACKNOWLEDGEMENTS
Herewith this acknowledgement, I would like to state my gratitude to many individuals who have provided me great support and helped me throughout my studies for my research project.
First and foremost, I would like to express my deep sense of appreciation to my research supervisor Assist. Prof. Emrah Özensoy for providing me an opportunity to work on this research project. I would like to state my sincere thanks to him for his valuable guidance, encouragement, patience and supervision throughout my studies. It has been a pleasure studying in his research group.
I would like to thank especially to Zafer Say for his advice on my research and the precious time that he has shared with me through my graduate studies.
I am sincerely grateful to Evgeny Vovk for his contributions and scientific discussions.
I would like to gratefully thank to General Motors Company for their financial support.
I have received great support, encouragement and companionship from Özlem Ünal, Gözde Barım, Yiğit Altay, Tuğçe Durgut and Menekşe Koca in both my personal life and academic study during the past few years. I thank them all for their valuable friendship.
Last but not the least, I wish to thank to my beloved parents; my mother, Banu Doğaç, my father, Ali Doğaç, my sister, Melis Doğaç and my lovely dog, Roko. Nobody has been more important to me in the world than my family. There is no word to express my gratitude to my family for their love, support and encouragement during my graduate studies. Their unconditional love and continuous support brings me there. I owe them a lot for supporting me spiritually and genuinely throughout my life.
vii TABLE OF CONTENTS CHAPTER 1 ... 1 1. INTRODUCTION ... 1 CHAPTER 2 ... 3 2. BACKGROUND ... 3
2.1. Properties of Perovskite oxides ... 3
2.1.1. Perovskite Structure ... 3
2.1.2. Non-stoichiometry in Perovskites... 5
2.1.3. Modification of Perovskite Structure... 5
2.1.4. Adsorption Properties of Perovskites ... 6
2.1.5 Thermal Stabilities of Perovskites ... 6
2.2. Automotive Applications of Perovskites ... 7
2.2.1. NOx Reduction Performances of A and/or B site Substituted La-based Perovskites ... 7
2.2.2. NOx Reduction Performances of Precious Metal Containing Perovskites 10 2.2.3. Sulfur Poisoning of the Perovskite Catalysts... 12
CHAPTER 3 ... 14
3. EXPERIMENTAL ... 14
3.1. Sample Preparation ... 14
3.1.1. Synthesis of Pd-free LaMnO3 and LaCoO3 Perovskite Samples... 14
3.1.2. Synthesis of Pd-impregnated LaMnO3 and LaCoO3 Perovskite Samples 14 3.1.3. Synthesis of La2O3 ... 15 3.2. INSTRUMENTATION ... 15 3.2.1 XRD ... 15 3.2.2. N2 Sorption ... 16 3.2.3. Raman Spectroscopy ... 16 3.2.4. TEM ... 16 3.2.5. SEM ... 17 3.2.6. XPS ... 17 3.2.7. FTIR ... 18
viii
3.2.7.2. Stepwise NOx (g) Desorption Experiments... 19
3.2.7.3. NOx Adsorption over Reduced Surfaces ... 20
3.2.7.4. SOx Adsorption Experiments ... 20
3.2.7.5. Reduction of SOx via H2 ... 20
3.2.7.6. NOx Adsorption Experiments on Poisoned Samples ... 20
3.2.8. Temperature Programmed Desorption (TPD) ... 21
CHAPTER 4 ... 22
4. RESULTS AND DISCUSSION ... 22
4.1. Structural Characterization ... 22
4.1.1. XRD Experiments ... 22
4.1.1.1. XRD Analysis of La2O3 ... 22
4.1.1.2. XRD Analysis of LaCoO3 ... 23
4.1.1.3. XRD Analysis of LaMnO3 ... 24
4.1.1.4. XRD Analysis of Pd/LaMnO3 and Pd/LaCoO3 ... 26
4.1.2. Raman Spectroscopy Experiments ... 28
4.1.3. N2 Sorption ... 31
4.1.4. Scanning Electron Microscopy (SEM) and Energy Dispersive X-ray (EDX) Mapping Analysis ... 31
4.1.5. Transmission Electron Microscopy (TEM) and Energy Dispersive X-ray (EDX) Analysis ... 35
4.1.6. X-Ray Photoelectron Spectroscopy (XPS) Analysis ... 38
4.2. In-situ Spectroscopic Characterization of the Synthesized Samples under Reactive Conditions ... 43
4.2.1. Fourier Transformed Infrared (FTIR) and Temperature Program Desorption (TPD) Experiments ... 43
4.2.1.1. NOx Adsorption and Desorption Behavior of Pd-free Perovskite Surfaces ... 43
4.2.1.2. NOx Adsorption and Desorption Behavior of Reduced Perovskite Surfaces ... 49
4.2.1.3. Effect of Palladium on NOx Adsorption and Desorption Behavior ... 53
4.2.1.4. NOx Adsorption and Desorption Behavior of Reduced Pd/Perovskite Surfaces ... 58
4.3. FTIR Spectroscopic Analysis of SOx Uptake of the Synthesized Materials ... 62
4.3.1. Sulfation and De-sulfation Behavior of Perovskites ... 62
4.3.2. Effect of Palladium on SOx Adsorption and Desorption Behavior of Perovskites ... 64
ix
4.3.4. Effect of S-poisoning on the NOx Storage Capacity of Perovskites ... 67
4.4. Quantitative SOx Uptake Determination via XPS ... 70
CHAPTER 5 ... 73
5. Conclusions ... 73
x
LIST OF FIGURES
Figure 1. Cubic perovskite crystal structure (adapted from reference 21) ... 3 Figure 2. Different crystal structures of perovskite systems [102]. ... 4 Figure 3. Self-regeneration capability of the Pd containing “intelligent” perovskite
catalyst [101] ... 11
Figure 4. Behavior of the “intelligent” perovskite catalyst and conventional catalyst
in redox fluctuations [101] ... 12
Figure 5. Schematic diagram of in situ FTIR and TPD analysis system [40]. ... 19 Figure 6. XRD pattern of the synthesized La2O3 sample after calcination at 973 K. 22 Figure 7. XRD patterns of the synthesized LaCoO3 samples after calcination at
different temperatures. ... 23
Figure 8. Characteristic XRD signals corresponding to the cubic and rhombohedral
LaCoO3 samples. ... 24 Figure 9. Cubic and Rhombohedral structures of LaCoO3 [102] ... 24 Figure 10. XRD patterns of the synthesized LaMnO3 samples after calcination at
different temperatures. ... 25
Figure 11. Characteristic XRD signals corresponding to the cubic and rhombohedral
LaMnO3 samples. ... 26 Figure 12. XRD patterns of LaMnO3 and LaCoO3 after calcination at 973 K and
their Pd impregnated counterparts. (Pd impregnated samples were additionaly calcined at 773 K after impregnation). ... 27
Figure 13. Characteristic perovskite XRD signals corresponding to the Pd-free and
Pd-containing perovskite samples calcined at 973 K ... 27
Figure 14. Raman spectrum of La2O3 benchmark sample. ... 28 Figure 15. Raman spectra of LaMnO3 and Pd/LaMnO3 samples after calcination at
973 K. ... 30
Figure 16. Raman spectra of LaCoO3 and Pd/LaCoO3 samples after calcination at
973 K. ... 30
Figure 17. (a) SEM image, (b) La + Mn EDX elemental map and (c) a representative
EDX spectrum of LaMnO3 sample calcined at 973K. ... 32 Figure 18. (a) SEM image, (b) La + Co EDX elemental map and (c) a representative
xi
Figure 19. (a) SEM image, (b) La + Mn, (c) La + Pd, (d) Mn+Pd EDX elemental
maps and (c) a representative EDX spectrum of Pd/LaCoO3 sample calcined at
973K. ... 34
Figure 20. (a) SEM image, (b) La + Co, (c) La + Pd, (d) Co+Pd EDX elemental maps and (c) a representative EDX spectrum of Pd/LaCoO3 sample calcined at 973K. ... 35
Figure 21. (a) Bright field TEM image showing LaCoO3 particulates with selected area diffraction pattern (inset) and (b) HRTEM image from a single LaCoO3 particulate ... 36
Figure 22. Bright field TEM images showing LaMnO3 particulates ... 36
Figure 23. Representative BF TEM image of Pd/LaCoO3. ... 37
Figure 24. Representative BF TEM images of Pd/LaMnO3. ... 38
Figure 25. HRTEM image of Pd/LaMnO3. ... 38
Figure 26. Pd3d XP spectra corresponding to a selected set of synthesized samples calcined at 973 K ... 39
Figure 27. Representative La4d XP spectra corresponding to LaCoO3, LaMnO3 Pd/LaCoO3 and Pd/LaMnO3 samples calcined at 973 K ... 39
Figure 28. Co2p XP spectra of Co-containing samples calcined at 973 K ... 40
Figure 29. Mn2p XP spectra of Mn-containing samples calcined at 973 K ... 40
Figure 30. Representative C1s XP spectra of LaCoO3, LaMnO3 Pd/LaCoO3 and Pd/LaMnO3. ... 41
Figure 31. Representative O1s XP spectra of selected samples. ... 42
Figure 32. FTIR spectra of stepwise NO2 (g) adsorption on activated a) LaMnO3 and b) LaCoO3 at 323 K... 44
Figure 33. FTIR spectra of La2O3 saturated with 1.0 Torr of NO2 (g) at 323 K. ... 45
Figure 34. FTIR spectra of LaMnO3 (black spectrum) and LaCoO3 (red spectrum) surfaces saturated with 5.0 Torr NO2 (g) at 323 K. ... 46
Figure 35. Temperature-dependent FTIR spectra for NO2(g) saturated (a) LaMnO3 and (b) LaCoO3 samples between 323 K – 823 K. ... 47
Figure 36. TPD profiles obtained after NO2(g) saturation at 323 K of activated (a) LaMnO3 and (b) LaCoO3. ... 49
xii
Figure 37. FTIR spectra of saturated surfaces with 5.0 Torr NO2(g) at 323 K. a)
reduced LaMnO3 (black spectrum) and LaMnO3 (red spectrum), b) reduced
LaCoO3 (black spectrum) and LaMnO3 (red spectrum). ... 51 Figure 38. TPD profiles obtained after NO2(g) saturation at 323 K of (a) LaMnO3
and (b) reduced LaMnO3. ... 52 Figure 39. TPD profiles obtained after NO2(g) saturation at 323 K of (a) fresh
LaCoO3 and (b) reduced LaCoO3. ... 53 Figure 40. FTIR spectra for stepwise NO2(g) adsorption on activated a) LaMnO3 and
b) Pd/LaMnO3 at 323 K ... 54 Figure 41. FTIR spectra for stepwise NO2(g) adsorption on activated a) LaCoO3 and
b) Pd/LaCoO3 at 323 K ... 54 Figure 42. Temperature-dependent FTIR spectra for NO2(g) saturated (a) LaMnO3
and (b) Pd/LaMnO3 samples between 323 K – 823 K. ... 55 Figure 43. Temperature-dependent FTIR spectra for NO2(g) saturated (a) LaCoO3
and (b) Pd/LaCoO3 samples between 323 K – 823 K. ... 56 Figure 44. TPD profiles obtained after NO2(g) saturation at 323 K of activated (a)
LaMnO3, (b) Pd/LaMnO3, (c) LaCoO3, (d) Pd/LaCoO3. ... 58 Figure 45. FTIR spectra of surfaces saturated with 5.0 Torr NO2(g) at 323 K. a)
reduced LaMnO3 (black spectrum) and LaMnO3 (red spectrum), b) reduced
Pd/LaMnO3 (black spectrum) and LaMnO3 (red spectrum), c) reduced LaCoO3
(black spectrum) and LaCoO3 (red spectrum), d) reduced Pd/LaCoO3 (black
spectrum) and Pd/LaCoO3 (red spectrum). ... 60 Figure 46. TPD profiles obtained after NO2(g) saturation at 323 K of reduced (a)
LaMnO3, (b) Pd/LaMnO3, (c) LaCoO3, (d) Pd/LaCoO3. ... 62 Figure 47. FTIR spectra related to SOx uptake and release properties of a) LaMnO3,
and c) LaCoO3. Bottom set of spectra in each panel were acquired after SOx
exposure (2.0 Torr, SO2:O2 = 1:10) at 323 K, followed by annealing at 373, 473
and 673K in the SOx gas mixture for 15 min. Upper set of spectra in each panel
were acquired by heating at 473, 673, 873 and 1073 K for 15 min under vacuum and after SOx gas mixture is evacuated. All spectra were acquired at 323 K in
vacuum ... 63
Figure 48. FTIR spectra related to SOx uptake and release properties of a) LaMnO3,
xiii
Figure 49. FTIR spectra related to the desulfation of a) LaMnO3, b) Pd/LaMnO3, c)
LaCoO3 and d) Pd/LaCoO3 surfaces via H2(g). Bottom set of spectra in each
panel were acquired after SOx exposure (2.0 Torr, SO2:O2 = 1:10) at 323 K,
followed by annealing at 673 K in the SOx gas mixture for 15 min. Upper set of
spectra in each panel were acquired by heating at 673, 773 and 873 K under 2.0 Torr of H2 (g) for 15 min after SOx gas mixture had been evacuated. All spectra
were acquired at 323 K in vacuum. ... 67
Figure 50. FTIR spectra acquired after NO2 saturation (5.0 Torr NO2(g), 323 K, 10
min) of fresh (black spectra) and S-poisoned surfaces (red spectra) via 2.0 Torr, 673K, SO2:O2 = 1:10. a) LaMnO3 and b) Pd/LaMnO3. All spectra were acquired
at 323 K in vacuum. ... 69
Figure 51. FTIR spectra acquired after NO2 saturation (5.0 Torr NO2(g), 323 K, 10
min) of fresh (black spectra) and S-poisoned surfaces (red spectra) via 2.0 Torr, 673K, SO2:O2 = 1:10. a) LaCoO3 and b) Pd/LaCoO3. All spectra were acquired
at 323K in vacuum. ... 70
Figure 52. Surface atomic ratios for sulfated and sulfated+reduced LaMnO3 and
Pd/LaMnO3 samples via XPS. ... 71 Figure 53. Surface atomic ratios for sulfated and sulfated+reduced LaCoO3 and
xiv
LIST OF TABLES
Table 1. Calcination temperatures of the synthesized samples. ... 15
Table 2. The amounts of chemicals used in the synthesis. ... 15
Table 3. BET specific surface areas (obtained after calcination at 973 K) ... 31
Table 4. BE values (in eV) for the main signals observed in the XP spectra ... 42
Table 5. Relative surface atomic ratios of the elements investigated in the XPS analysis of the synthesized samples ... 43
Table 6. List of adsorbed species observed in this study with their corresponding characteristic IR vibrational [15-20] ... 45
Table 7. Integrated areas under NO (30 amu) desorption curve. ... 49
Table 8. Integrated areas under NO (30 amu) desorption curve. ... 52
Table 9. Integrated areas under NO (30 amu) desorption curve for activated Pd-free and Pd/perovskites. ... 57
Table 10. Integrated areas under NO (30 amu) desorption curve for reduced Pd-free and Pd/perovskites. ... 62
1
CHAPTER 1
1. INTRODUCTION
Reducing air pollution caused by toxic gases is an important global problem. In recent years, hazardous gases such as CO, NOx, SOx and unburned hydrocarbons
have been subject to more stringent emission regulations. NOx emitted from
automobile exhaust have serious effects on the atmosphere, environment and human health [1-3].
To meet emission regulations, the automobile industry is constantly searching for new technologies. The major function of catalytic converters in automotive exhaust systems is performing the following reactions [4];
Oxidation of CO and HC to CO2 and H2O:
CyHn + (y + n/4) O2 yCO2 CO + ½ O2 CO2 CO + H2O CO2 + H2 Reduction of NO (NO2) to N2: NO (or NO2) + CO ½ N2 + CO2 NO (or NO2) + H2 ½ N2 + H2O (y + n/2) NO (or NO2) + CyHn (y + n/4) N2 + y CO2 + (n/2) H2O
Lean burn engines have become very popular in recent years as they offer higher fuel efficiencies and lower CO2 emission. The major challenge regarding lean burn
engines is their high NOx emissions in the untreated tailpipe. These NOx gases
cannot be removed completely with three way catalysts and emission regulations cannot be met. Thus, various catalyst technologies are considered for NOx reduction.
The catalysts that are used for removing NOx are selective catalytic reduction (SCR)
2
reduced by H2, hydrocarbons (HC) or urea in the presence of excess oxygen.
However HC-SCR catalysts suffer from low performance and NH3-SCR catalysts
have significant technological drawbacks associated with the urea transportation, storage and dosing. NSR technology also has its own set of challenges. The problems with NSR catalysts are sulfur poisoning and the cost of the precious metals (i.e. Platinum Group Metals or PGM) used in their synthesis. Long-term usage of NSR catalysts causes a decrease in the efficiency of the catalysts due to thermal aging and sulfur poisoning. Therefore, the search for novel catalytic technologies for NOx
reduction of continues.
Perovskites are widely studied materials in literature and have wide applications in the chemical industry. They are used in oxidation reactions, pollution abatement, hydrogenation and hydrogenolysis reactions, photocatalysis, chemical sensors, and electrolysis, such as solid oxide fuel cells [5-105]. Lanthanum-based perovskite catalysts such as LaMnO3 and LaCoO3 are promising candidates for NSR catalysts
due to their higher NOx conversion, lower price, relativly easy synthesis and higher
3
CHAPTER 2
2. BACKGROUND
2.1. Properties of Perovskite oxides
2.1.1. Perovskite Structure
The general formula of the perovskite is ABO3. Most of the metals that are found in
the periodic table are stable in the perovskite structure. The importance of the perovskite structure is that metals can be found in mixed oxidation states and/or unstable oxidation states in the crystal structure. The ideal cubic perovskite structure with a space group Pm3m-Oh is shown in Figure 1 [21]. A and B are cations with
different sizes, “A” is typically larger than “B”. The “A” position is generally occupied by post-transition metals or alkaline earth metals, and “B” position is generally occupied by transition metals or noble metals. The A and B cations are 12-fold and 6-12-fold coordinated with oxygen anions, respectively. The perovskite superstructure has a ReO3-type framework where the A cation is incorporated into
the BO6 octahedra [21].
Figure 1. Cubic perovskite crystal structure (adapted from reference 21)
A
B
4
If “a” is considered as a unit cell parameter of ideal perovskite, B-O distance is equal to a/2 and A-O distance is a/√2. Then, the relationship between the ionic radii becomes
rA + rO = √2 (rB + rO)
However, cubic structure is still preserved without obeying the previous equation [21]. Goldschmidt [45] introduced a term called the “tolerance factor” (t) which is a measure of the deviation from the ideal perovskite crystal structure;
t = rA + rO / √2 (rB + rO)
where r values are the ionic radii of A and B cations at room temperature [21, 45, 57].
For an ideal perovskite structure, the value of t is equal to 1. This situation is generally observed at high temperatures. Moreover, for values of t between 0.75 and 1, perovskite structure can be still preserved. However, cations of different sizes can alter the structure and lower the symmetry. Rhombohedral, orthorhombic, hexagonal and bixbyite phases are examples of the resulting structures after distortion of the cubic geometry as shown in Figure 2 [3, 46-48].
5
2.1.2. Non-stoichiometry in Perovskites
Non-stoichiometry in the perovskite structure is observed very frequently [21, 49-51]. Other than the ionic radii requirement mentioned above, the electroneutrality condition should also be satisfied. This condition implies that total charge of the A site and B site cations should be equal to the charge of the oxygen anions found in the perovskite structure. Two types of non-stoichiometry are observed for perovskites: oxygen non-stoichiometry and cation non-stoichiometry. For instance, LaMnO3+λ is one of the most commonly known oxygen-rich perovskite structures
[52]. However, by substituting different cations into the A and/or B sites, this oxygen non-stoichiometry can be eliminated [53-55]. Another type of non-stoichiometry in perovskites is the cation non-stoichiometry which is common for CaTiO3-type
perovskites, where some of the Ca cations are missing in the perovskite structure at the A-site position [56]. B-site non-stoichiometry is not as common as previously mentioned cases, because the B-site cations typically possess high charge and small size. Thus, removing these cations from the perovskite structure is thermodynamically unfavorable.
2.1.3. Modification of Perovskite Structure
Moreover, the perovskite structure can be modified by substituting different A and B cations with different cations by keeping the charges and sizes of these latter species comparable with their original counterparts. The A site cation is typically suggested to be catalytically inactive and substitution of different A cations into the structure has two different results; change in the oxidation state of the B site cation and creation oxygen non-stoichiometry [57-59]. Sr2+ substitution into the La
2NiO4 type
perovskite is an example of substituting a different A site cation into the perovskite type structure [58]. In this structure, some of the La3+ ions are replaced with Sr2+.
Since the oxidation states of lanthanum and strontium are different, in order to preserve the electroneutrality, a Ni2+/Ni3+ couplet is generated and oxygen vacancies are created [58, 59]. Although strontium does not have a direct effect on catalytic performance, the creation of oxygen vacancies and different oxidation states of the Ni cation causes an increase in the oxidation capability of perovskite. Another type of substitution is the insertion of different B site cations into the ABO3 perovskite
6
B site cation exhibits different oxidation states and it is typically the catalytically active site. However, as in the case of A-site substitution, B-site insertion helps tune the oxidation states of the already existing B-site cations and creates oxygen vacancies which can directly alter the catalytic activity [57, 60-63].
2.1.4. Adsorption Properties of Perovskites
Adsorption properties of perovskites are important for understanding catalytic reaction mechanisms. Tascon et al. studied CO and NO adsorption on LaMO3-type
perovskite where M is a first-row transition metal; such as Cr, Mn, Fe, Co or Ni [21, 64, 65]. These authors observed that CO adsorption depends on the electronic configuration of the B-site cation at room temperature. The greatest amount of CO is adsorbed on LaFeO3, whereas NO adsorption shows maxima for Co and Mn-based
perovskites with the formation of dinitrosyls, nitrite and nitrate species on the surface. Kremenic et al. studied the oxygen adsorption of profiles of LaMO3 (M= Cr,
Mn, Fe, Co, Ni) [66]. Oxygen adsorption profiles are especially important for the reduction/oxidation cycles of the perovskites. Oxygen adsorption is maximized for LaCoO3 and LaMnO3 [21, 66, 67].
2.1.5 Thermal Stabilities of Perovskites
Thermal stability of the perovskite structure under reducing conditions is another crucial aspect for the long-term use of catalysts in catalytic cycles. Stability of the catalyst depends on both A and B site cations in the structure [21]. Co-based perovskites are generally very unstable in reducing atmospheres [22, 23, 68-79]. Nakamura et al. showed that partial substitution of Sr into the La1-xSrxCoO3 causes
important changes in the stability of the perovskite structure [68]. In such cases, stability of the perovskite decreases as the strontium concentration increases. When the Sr concentration increases in the structure, both unstable Co4+ cations and oxygen
vacancies are formed resulting in the diffusion of bulk oxygen to the surface. Lago et al. examined the reducibility of LnCoO3 (Ln = La, Pr, Nd, Sm, Gd) perovskites [71].
They observed that the Co cations are reduced in two steps: at around 633 K, Co3+ is reduced to Co2+ and within 783-845 K, Co2+ is reduced to metallic cobalt. Moreover, the Ln site of the perovskite determines the stability of the structure and due to the large size of lanthanum, the most stable perovskite in the series is LaCoO3. Crespin
7
et al. have conducted a detailed investigation of the relationship between reduction conditions and the stability of Co-based perovskites [22]. If LaCoO3 is completely
reduced to metallic cobalt and La2O3 at 673 K, the reduced phases will return to the
original perovskite structure after a re-oxidation process. However, this is not the case when the reduction of LaCoO3 occurs at 1073 K. Because of the thermal
treatment of LaCoO3 at high temperatures in H2 atmosphere, metallic Co particles
grow drastically in size, so that the original perovskite structure cannot be restored after re-oxidation, and instead Co3O4 phase forms. Formation of Co3O4 may be
prevented via re-oxidation of the reduced phases under very mild conditions.
2.2. Automotive Applications of Perovskites
2.2.1. NOx Reduction Performances of A and/or B site Substituted La-based Perovskites
Perovskite-type catalysts have been widely applied to exhaust gas treatment systems in the recent years. Kim et al. studied the NOx reduction performance of La 1-xSrxCoO3 and La1-xSrxMnO3 perovskites [5]. They observed that such catalysts have
high inherent NO oxidation capability with or without strontium. However, the effect of strontium addition on NO oxidation is more pronounced for Co-containing perovskites due to a larger amount of oxygen vacancies are created in La1-xSrxCoO3.
According to their study, although the Co-based perovskite is more active than its Mn-containing counterpart, La1-xSrxMnO3 is more promising as a commercial
catalyst because of the instability of Co-based perovskites in a reducing atmosphere [44, 72]. Li et al. investigated the DeNOx performance of La1-xSrxCoO3-type
perovskites [80]. They used La2O3 and SrO as NOx storage materials. They
suggested that the presence of strontium in the perovskite structure is important for two reasons. First, since Sr addition to Co-based perovskites forms an unstable oxidation state of cobalt (i.e., Co4+), the catalyst has a higher oxidation capability. Besides, SrO has a higher basicity than La2O3, so SrO can also act as a NOx storage
component. They found that the La0.7Sr0.3CoO3 perovskite had the best NO-to-NO2
conversion performance and the largest NOx storage capacity at 3000C. Wen et al.
studied NO oxidation via La1-xCexCoO3 [82]. They observed that the surface is
mainly dominated by the A-site cations, i.e. La and Ce. They claimed that there is no direct correlation between catalytic activity and the surface enrichment of A cations.
8
Among their catalysts, x=0.2 has the highest catalytic activity with the highest amount of adsorbed oxygen. Thus, they correlated the catalytic activity with the extent of adsorbed oxygen. On the other hand, this correlation is open to critisim as the perovskite systems which are not doped with Ce but revealing a high oxygen adsorption capacity such as LaCoO3, is not as active as the Ce-containing analogue.
Hence, extent of adsorbed oxygen should not be the only parameter determining the catalytic activity. NO TPD experiments done by Wen et al. [82] showed that N2O
formation was observed for the Ce-doped perovskite but not for pure LaCoO3. The
evolution of N2O might be related to the CeO2 phase originating from the phase
segregation in the La1-xCexCoO3 structure. N2 signal was not detected for the La 1-xCexCoO3 system, excluding the direct decomposition of NO. Removal of NOx and
N2 production efficiency via a La1-xCexNiO3 (0< x <0.05) catalyst was investigated
by Zhou et al [84]. This study showed that substitution of cerium increased the stability of the perovskite and the activity of the catalyst, because cerium (IV) was incorporated with the lattice and increased the nickel (II) content that was suggested to be the active site of the perovskite structure. According to their report, La0.97Ce0.03NiO3 had the highest activity during NO conversion. Giannakas et al. [90]
studied the reduction of NO over LaMnO3 and LaFeO3-type perovskites. LaMnO3
and LaFeO3 showed high activity between 300-500 0C and 300-450 ºC, respectively.
For LaMnO3, Mn3+-O-Mn4+ pairs were suggested to be responsible for the high
activity of the perovskite rather than the specific surface area (SSA). Moreover, the effect of Sr and Ce substitution into LaFeO3 on the NO+CO reaction was also
examined [85]. The catalytic activities of La0.85Sr0.15FeO3, La0.8Ce0.2FeO3 and
La0.8Sr0.1Ce0.1FeO3-type perovskites were investigated. Sr-doped perovskites were
synthesized successfully whereas Ce could not be incorporated into the perovskite and phase segregation was observed during the synthesis of Ce-doped samples. Activity results showed that the Ce-doped perovskite has the highest conversion of NO+CO whereas the undoped perovskite has the lowest activity [85]. Activities of these perovskite systems were directly correlated to the SSA values. La0.8Ce0.2FeO3
has the highest activity revealing the highest SSA. Moreover, presence of the CeO2
phase with the perovskite was found to assist NO combustion [85, 86]. Sr-containing perovskites were deactivated with the formation of SrFeO3 [85-87]. The effect of Sr
9
These catalysts were found to show activity within 220-560 0C. It was observed that substitution of Sr for La after a certain extent decreased the activity of the catalyst [92] since the Sr addition changes the defects in perovskite structure. It is well known that the LaMnO3 perovskite has excess oxygen in its lattice [52], however Sr
substitution results in an oxygen deficient Mn-based perovskite, leading to a decline in activity.
Lima et al. [88] investigated iron-based perovskites for the following reaction: NO+CO CO2 + ½ N2
Rather than changing the A site of the perovskite, B-site substitution was performed. Co was doped into the B-site of LaFeO3 rather than Ce and/or Sr that appear at the A
site of the perovskite structure. Interestingly, the Co-doped perovskite had a lower activity than undoped LaFeO3. Another study revealed that when Fe atoms were
replaced by Co up to 30%, the activity for NO reduction by CO decreased compared to LaFeO3 and LaCoO3 [88, 89]. Co-doped perovskites were also studied by Wang et
al [91]. Materials exhibiting different values of x in LaMn1-xCoxO3 (where 0<x<0.5)
were used for NO oxidation. The NO oxidation temperature shifted to lower values with partial substitution of Co into LaMnO3 in a non-linear fashion. LaMn0.9Co0.1O3
had the highest activity due to the greatest amount of activated oxygen and the synergistic effect between Mn and Co.
Tanaka et al. [81] analyzed both A-site and B-site substituted perovskites. The catalytic activity and stability of La0.9Ce0.1Co1−xFexO3 perovskite catalysts (x = 0,
0.2, 0.4, 0.6, 0.8 and 1.0) for automotive emission control were examined. An increase in the cobalt content increases the catalytic activity and decreases the structural stability. According to their results, Fe was responsible for the structural durability whereas Co improved catalytic activity. Thus, La0.9Ce0.1Co0.4Fe0.6O3
showed the highest catalytic activity as well as the highest structural durability. It was also reported that when the cobalt fraction exceeds 0.6, the perovskite structure transforms into a K2NiF4-type structure that diminishes the activity of the catalyst.
10
2.2.2. NOx Reduction Performances of Precious Metal Containing Perovskites
In order to stabilize the precious metal against sintering, volatilization and/or solid state reaction with the substrate, precious metal-containing perovskites are being considered as an important alternative for exhaust treatment systems [21]. Precious metal-containing perovskites were synthesized by either wet-impregnation or co-precipitation methods [5, 83, 94-98]. Kim et al. [5] combined the La1-xSrxCoO3 and
La1-xSrxMnO3 perovskites with Pd, in order to increase the efficiency and sulfur
poisoning tolerance of the catalyst. It was observed that the Pd/perovskites showed activities as high as commercial catalysts, especially for the conversion of NO to NO2 [5]. Moreover, the Pd/perovskites were found to be still active after poisoning
with sulfur, whereas Pd-free perovskites lost their activity [5]. Rodriguez et al. [83] studied the NOx performance of LaFe0.95-xCoxPd0.05O3-type catalysts. They have
shown that by changing the Fe and Co ratio at the B site of the perovskite, NOx
reduction and N2 selectivity changed. Fe/Co=1 was reported to be the best
compositional ratio for NOx reduction and N2 selectivity also yielding a catalyst with
the highest surface area [83]. They also showed that in the absence of palladium, NOx conversion decreased drastically. In a different study, NO reduction via H2 was
also investigated on five different perovskites namely, LaFeO3, La0.8Sr0.2FeO3,
La0.8Sr0.2Fe0.9Pd0.1O3, La0.7Sr0.2Ce0.1FeO3 and La0.7Sr0.2Ce0.1Fe0.9Pd0.1O3 [93].
Activity results indicated that La0.8Sr0.2Fe0.9Pd0.1O3 had the highest conversion at 130 0C whereas the lowest activity was observed for undoped LaFeO
3. All of the
substituted perovskites showed similar activity between 210-280 0C. Temperature programmed reduction (TPR) experiments indicated that the extent of reduction of the B-site cations were responsible for the activity towards NO reduction. Moreover, reducibility of the catalysts was enhanced via substitution of Sr and Ce into the perovskites with the creation of oxygen vacancies. The presence of Pd also increased the activity due to its high H2 chemisorption capability and also due to the ease of
perovskite reduction via H spill over. Yao et al. [94] examined the effect of Pd loading on the reduction of NOx for Co-based perovskites. Catalytic activity was
found to be greatly enhanced by the substitution of a slight amount of Pd into the perovskite structure (i,e. LaCo0.99Pd0.01O3 and LaCo0.97Pd0.03O3). The increase in the
11
oxidation state of palladium, Pd4+ [94-97] and a higher SSA compared to Pd-free LaCoO3 [94, 98].
Tanaka et al. [81] studied palladium supported La0.9Ce0.1Co1−xFexO3 perovskite
catalysts (x = 0, 0.2, 0.4, 0.6, 0.8 and 1.0) for automotive emission control. The have demonstrated that the activity of the perovskites increased in the presence of Pd. After this study, Tanaka, Uenishi and Nishihata et al. [96, 99-101] introduced a term called “intelligent catalyst” for Pd-containing perovskites where it was claimed that the perovskite structure responded to the environmental conditions by maintaining its catalytic performance and structure. Since the catalyst maintained its activity for long periods, it had a “self-regeneration” capability as depicted in Figure 3.
Figure 3. Self-regeneration capability of the Pd containing “intelligent” perovskite
catalyst [101]
This particular perovskite catalyst was in the form of LaFe0.95Pd0.05O3. According to
this report, Pd entered the lattice and occupied the B-site of the perovskite under an oxidizing environment. On the other hand, under a reducing conditions, Pd segregated out of the perovskite lattice and formed a metallic Pd nanoclusters [101]. The presence of the perovskite structure was claimed to inhibit the excessive growth of the metallic Pd particles. Thus, it was suggested that the noble metal-containing perovskite preserved its activity by switching between these two different Pd forms in the catalyst (Figure 4).
12
Figure 4. Behavior of the “intelligent” perovskite catalyst and conventional catalyst
in redox fluctuations [101]
2.2.3. Sulfur Poisoning of the Perovskite Catalysts
One of the major problems of catalytic converters is the poisoning of the catalyst due to sulfur species such as H2S, thiophene and COS originating from fuel and engine
lubricants. NOx reduction and storage perfromances are significantly affected by
sulfur leading to deactivation of the catalyst [42]. Perovskite-based catalysts also suffer from sulfur poisoning due to the basic properties of lanthanum, iron, cobalt, etc. [103]. Removal of sulfates at low temperatures is not typically possible and thus the reduction of sulfates requires high temperatures causing deterioration of perovskite lattice [80]. Rossetti et al. [103] investigated the effect of sulfur poisoning on various perovskites of the form La(1-x)AxBO3 ((A= Ce,Sr), (B=Co,Mn,Fe), (x=0,
0.1, 0.2)) with and without Pt or Pd. All of their catalysts showed high activity for methane conversion. First, they examined the effect of the B-site on the methane conversion activity and sulfur poisoning. LaMnO3 and LaCoO3 showed the highest
activity whereas LaFeO3 showed the least. The resistance towards sulfur poisoning
of the perovskites decreased as follows: LaMnO3>LaCoO3>LaFeO3. LaMnO3,
LaCoO3 and LaFeO3 lost 10%, 17% and 18% of the original conversion activity,
upon poisoning respectively. This behavior was attributed to the higher basicity of Mn among other B site cations. It was suggested that the CO2 which was generated
13
sulfur poisoning of the perovskite. In the same study, the effect of A-site substitution on sulfur poisoning of the perovskites were also studied [103]. Up to 10 wt% Sr addition was observed to enhance the activity of the Mn-based perovskites, however further substitution did not affect the performance [103]. For LaCoO3, Sr addition led
to a slight decrease in the activity. The insertion of Sr to all types of perovskites studied in this work [103] improved resistance towards sulfur poisoning, which was found to be the highest for La0.8Sr0.2MnO3. Sr incorporation also resulted in the
creation of oxygen vacancies and an increase in the oxidation state of the B–site cation, thereby increasing the acidity of the metal ion and weakening the SO2 surface
binding. As discussed above, although the presence of Sr improved the sulfur tolerance, this was not the case for Ce4+ substitution which had an adverse effect on the poisoning resistance [103]. This study also revealed that the presence of Pd or Pt enhanced the activity of Co-based perovskites. The insertion of Pt increased methane conversion for LaMnO3, but Pd diminished the activity. Both Pt and Pd incorporated
perovskites showed high resistance against sulfur poisoning. The highest activity was obtained for Pt/LaMnO3 together with the highest sulfur resistance. Moreover,
Koponen et al. [105] showed that extremely high Pd loadings, such as 10 wt% on LaMn1-xFexO3-type perovskite catalysts increased the resistance against sulfur
poisoning, however, higher Pd loadings also led to a decrease in methane conversion. The poisoning mechanism of Al2O3-supported LaCoO3 was studied by Zhu et al
[104]. The reaction between LaCoO3 and SO2 was reported to yield La2(SO4)3,
La2(SO3)3, La2O2SO4 and CoO species with the destruction of the perovskite
structure. Annealing to higher temperatures was found to help removal of sulfates/sulfites but regeneration of the perovskite structure was reported to be not feasible. Zhang et al. [35] also observed the destruction of the perovskite structure of LaFeCuO3 via sulfur poisoning. Partial re-construction of the perovskite structure
14
CHAPTER 3
3. EXPERIMENTAL
3.1. Sample Preparation
3.1.1. Synthesis of Pd-free LaMnO3 and LaCoO3 Perovskite Samples
Perovskite samples were synthesized using the citrate method as prescribed in the recent GM patent [37]. First, citric acid with 10 weight percent excess was dissolved in distilled water. Nitrate precursors of the corresponding metals (see Table 1 for details) were added into the prepared citric acid solution. Solutions were stirred for 1 hr followed by heating at 353 K with continuous stirring under ambient conditions. During heating, the solvent was slowly evaporated and a viscous gel formation was observed concomitant with the evolution of a brown gas (i.e. NO2). The obtained gel
was placed in an oven and heated at 363 K overnight in air. Next, the samples were finely ground in a mortar to obtain a powder form. Finally, obtained powders were calcined in an oven at 873, 873, 1073, and 1173 K for 5 hr in air. The amounts of chemicals used in the synthesis and the corresponding calcination temperatures are listed in Tables 1 and 2, respectively.
3.1.2. Synthesis of Pd-impregnated LaMnO3 and LaCoO3 Perovskite Samples
LaMnO3 and LaCoO3 samples were synthesized as described in section 3.1.1. Next,
perovskite samples were calcined at 973 K for 5 hours in air and then mixed with deionized water and stirred continuously for 1 hour. This is followed by the addition of 1.5 wt% of Pd precursor to the perovskite suspension (i.e. 0.03248 g Pd(NO3)2 for
every 1.00 g of perovskite) and stirring for 3 hr. Then, the samples were aged for 1 day under ambient conditions. After aging, a black precipitate was obtained below a clear and colorless solution. Then, the samples were dried overnight at 393 K under ambient conditions. Finally, obtained samples were calcined in air at 773 K for 5 hr. Samples prepared via the impregnation method were denoted as Pd/LaMnO3 and
15
3.1.3. Synthesis of La2O3
La2O3 was synthesized using La(NO3)3.6H2O(s) precursor calcined at 973 K in an
open-air oven for 12 hr.
Table 1. Calcination temperatures of the synthesized samples.
Sample Name Calcination Temperature (K)
LaMnO3 873 LaMnO3 973 LaMnO3 1073 LaMnO3 1173 LaCoO3 873 LaCoO3 973 LaCoO3 1073 LaCoO3 1173 1.5wt% Pd/LaMnO3 973 1.5wt% Pd/LaCoO3 973
Table 2. The amounts of chemicals used in the synthesis.
Precursors LaMnO3 LaCoO3 Pd/LaMnO3 Pd/LaCoO3
La(NO3)3.6H2O 1.7905g 1.7613g 1.7905g 1.7613g Mn(NO3)3.4H2O 1.0379g - 1.0379g - Co(NO3)2.6H2O - 1.1838g - 1.1838g Pd(NO3)2 - - 0.03248g 0.03248g Citric acid 1.9116g 1.8805g 1.9116g 1.8805g Distilled water 82.7ml 81.3ml 150ml 150ml 3.2. INSTRUMENTATION 3.2.1 XRD
The powder XRD patterns were recorded using a Rigaku diffractometer, equipped with a Miniflex goniometer and an X-ray source with Cu Kα radiation, at λ=1.5418
16
Å, 30 kV, and 15 mA. The powder samples were pressed and affixed to standard-sized glass slides and scanned in the 10-80° 2θ range with a scan rate of 0.01 deg. s-1. Diffraction patterns were assigned using Joint Committee on Powder Diffraction Standards (JCPDS) cards supplied by the International Centre for Diffraction Database (ICDD).
3.2.2. N2 Sorption
The specific surface areas (SSA, m2/g) of the samples were measured by the five-point Brunauer-Emmett-Teller (BET) method [38] via low-temperature isothermal adsorption/desorption of N2. The samples were degassed under vacuum at room
temperature for 1 hr, prior to adsorption measurements in order to outgas the physisorbed moisture. The measurements were performed using a Micromeritics ASAP 2000 gas sorption and porosimetry system.
3.2.3. Raman Spectroscopy
Raman spectra were recorded on a HORIBA Jobin Yvon LabRam HR 800 instrument, equipped with a confocal Raman BX41 microscope, spectrograph with an 800 mm focal length, and a CCD detector. The Raman spectrometer was equipped with a Nd:YAG laser (λ=532.1 nm). During the Raman experiments, the laser power was tuned to 20 mW, measured at the sample position, in order to minimize the sample heating effects. Before the Raman measurements, the powder samples were mechanically dispersed onto a single-crystal Si holder. The incident light source was focused onto the sample by using a 50× objective. The confocal hole and slit entrance were set at 1100 and 200 μm, respectively. The spectrometer was regularly calibrated by adjusting the zero-order position of the grating and comparing the measured Si Raman band frequency with the typical reference value of 520.7 cm-1.
All Raman spectra were acquired within 100 - 4000 cm-1 with an acquisition time of
213 s and a spectral resolution of 4 cm-1. 3.2.4. TEM
Transmission electron microscopy (TEM) studies were conducted using a JEOL JEM 2100F field emission scanning/transmission electron microscope. Powders for TEM analysis were prepared through solution-drop method. A mixture of methanol and
17
powders were dispersed on carbon-coated copper grids and directly examined using bright-field (BF) and high-resolution imaging (HRTEM).
3.2.5. SEM
The morphology, elemental composition, and dispersion of the elements on the surface of the samples were investigated using a scanning electron (SE) microscope, equipped with an EDX detector. SEM and EDX data were acquired using a Zeiss EVO40 environmental SEM that is equipped with a LaB6 electron gun, a vacuum SE
detector, an elevated pressure SE detector, a backscattering electron detector (BSD), and a Bruker AXS XFlash 4010 detector. Samples for SEM and EDX analysis were prepared by grinding the powder samples into fine particles and mechanically dispersing them onto an electrically conductive carbon film which was placed on an aluminum sample holder. No additional coatings or dispersive liquids were used for the SEM and EDX sample preparation. SEM images were obtained using a vacuum SE detector where the electron acceleration voltage of the incident beam was varied within 10-20 kV and the samples were kept typically at ≤ 5 ×10⁻⁵ Torr inside the SEM. All of the EDX data were collected using an electron acceleration voltage of 20 kV and a working distance of 15 mm. For all of the EDX elemental mapping studies, at least four independent areas of identical dimensions on the same catalyst sample were investigated in order to ensure the reproducibility of the results.
3.2.6. XPS
XPS data were recorded using a SPECS spectrometer with a PHOIBOS-DLD hemispherical energy analyzer and a monochromatic Al Kα X-ray irradiation (hν = 1486.74 eV, 400 W). The powder samples were settled on cupper based conducting sticky tape. An electron flood gun was used for charge compensation during the XPS analysis. The flood gun parameters were chosen to be appropriate for binding energy (B.E.) shifts and peak width broadening. The following typical flood gun settings were used during the XPS data acquisition: Electron Energy = 3 eV, Emission Current = 50 μA.
18
3.2.7. FTIR
FTIR spectroscopic measurements were carried out in transmission mode in the batch-type catalytic reactor [39] coupled to an FTIR spectrometer (Bruker Tensor 27) and a quadruple mass spectrometer (QMS, Stanford Research Systems, RGA 200) used for TPD experiments. All FTIR spectra were acquired at 323 K. In the TPD experiments, a linear temperature ramp with a heating rate of 12 K/min was utilized to heat the sample within the range of 323–1023 K. The QMS signals with corresponding m/z were monitored during the TPD measurements. A Hg-Cd-Te (MCT) detector which is used for recording FTIR data works with liquid nitrogen (LN2) cooling. Gas pressures are controlled by a MKS Baratron absolute pressure
transducer. Rotary and turbo pumps are used for evacuation of gases throughout the instrument. During FTIR measurement, the average scan is 128 and resolution is 4 cm-1. A high conductance and lithographically-etched tungsten grid (P/N PW10379-003) is used for pressing the powder samples. About 20 mg samples are pressed on the W-grid. Tantalum foil is spot-welded to the top of the W-grid. The tungsten grid is connected to the copper legs together with a ceramic vacuum feed through. A K-type thermocouple which monitors the temperature is spot-welded to the tantalum foil that already connected to the grid. An adjustable dc power supply and computer controlled PID electronics control the temperature up to 1173 K. After the samples were placed into the batch reactor, it was baked out at 403 K for 12 hours to both remove surface water and bake the chamber walls. Before each experiment, the sample surface is activated by flushing the reactor with 1 Torr NOx gas for five
19
Figure 5. Schematic diagram of in situ FTIR and TPD analysis system [40].
3.2.7.1. Stepwise NOx (g) Adsorption Experiments
Before the actual NO2 adsorption experiments, each sample was activated via an
initial treatment with NO2 in order to burn-off residual carbonaceous species
followed by annealing at c.a. 900 K in vacuum. These samples are labeled as “activated.” NO2 (g) was dosed on to the activated surfaces. First, 1 Torr NO2 (g)
was dosed into the manifold and released onto the sample for 1 min. Upon expansion into the spectroscopic reactor, this 1 Torr of NO2 (g) in the manifold resulted in an
NO2 pressure of 0.1 Torr over the sample. Before taking IR data, NOx was evacuated
until the pressure inside the chamber reached about 10-3 Torr. This procedure was repeated 10 times for each sample. Finally, the surface was saturated via dosing with 5 Torr NO2 over the sample for 10 minutes. For the whole adsorption experiment, the
temperature was kept 323 K. NO2(g) used in the experiments was prepared by
mixing NO(g) (Air Products, 99.9%) and O2(g) (Linde GmbH, Germany, 99.999%)
followed by multiple freeze-pump-thaw cycles for further purification.
3.2.7.2. Stepwise NOx (g) Desorption Experiments
In order to understand the thermal stabilities of adsorbed species, desorption experiments were performed. After saturation of surfaces with 5 Torr NO2 at 323 K,
20
the temperature was linearly increased from 323 K to 823 K in order to remove the surface species. While recording the IR spectrum, the sample was cooled to 323 K.
3.2.7.3. NOx Adsorption over Reduced Surfaces
Perovskite materials were pre-treated with an aggressive reducing agent, H2(g),
before the NOx adsorption experiments. The surface was reduced with 5.0 Torr H2(g)
at 623 K for 10 minutes. After evacuation of H2 at 323 K, 5 Torr NO2 (g) was dosed
over the sample for 10 minutes. The IR spectrum was recorded after pumping out the NO2 (g). These perovskite samples were mentioned as “reduced” which refers to the
reduction of the material surface with 5.0 Torr H2(g) at 623 K for 10 minutes prior to
NO2 exposure.
3.2.7.4. SOx Adsorption Experiments
Sulfation experiments were performed with SO2+O2 (which will be hereafter referred
as SOx) gas mixture with a SO2:O2 partial pressure ratio of 1:10. Previously activated
samples were exposed to 2 Torr SOx (g) for 10 min at 323 K. After recording the
data, the samples were heated between 373-673 K with 100 K increments in the presence of SOx(g). At each temperature, the samples were cooled down to 323 K for
IR data acquisition. The samples were heated up to 1073 K in vacuum where the temperature increment is 100 K between 373-673 K and 200 K between 673-1073 K. All FTIR data were recorded at 323 K.
3.2.7.5. Reduction of SOx via H2
Samples were poisoned with 2 Torr SOx at 673 K for 30 min prior to the reduction
process. SOx was pumped out at 673 K, and the samples were cooled down to 323 K
for H2 dosage. 2 Torr H2 gas was introduced onto the sample at 323 K and annealing
in H2 atmosphere was performed between 673-973 K with a 100 K increment. 3.2.7.6. NOx Adsorption Experiments on Poisoned Samples
Poisoning of the samples were performed with 2 Torr SOx at 673K for 30 minutes.
Before cooling the sample to 323 K, SOx was evacuated. 5 Torr NO2 (g) was dosed
on the sample at 323K for 10 minutes to saturate the poisoned surface with NOx.
21
3.2.8. Temperature Programmed Desorption (TPD)
TPD experiments were done using a Quadruple Mass Spectrometer (QMS) that was connected to the vacuum chamber via a pneumatic gate valve. The powder sample of about 20 mg was pressed onto a tungsten grid which was mounted on the IR/TPD cell, as described in section 2.2.7. The oxidation-resistant thoria-coated iridium filament of the mass spectrometer was outgassed for 30 min before each TPD experiment. After cooling to 323 K, 8 Torr of NO2 for 20 min was dosed onto the
sample until equilibrium was reached. To remove weakly physisorbed species, the system was outgassed at 1 x 10⁻⁶ Torr. Next, TPD experiments were performed. Thermally desorbed NOx species during the TPD process were monitored by
simultaneously recording the QMS signals with mass to charge ratios (m/z) equal to 18 (H2O), 28 (N2/CO), 30 (NO), 32 (O2), 44 (N2O/CO2) and 46 (NO2). TPD
experiments were done within the temperature range between 323-1023 K where the temperature ramp rate was 12 K/min.
22
CHAPTER 4
4. RESULTS AND DISCUSSION
4.1. Structural Characterization
4.1.1. XRD Experiments
XRD analysis of the synthesized samples will be discussed in the following sub-sections.
4.1.1.1. XRD Analysis of La2O3
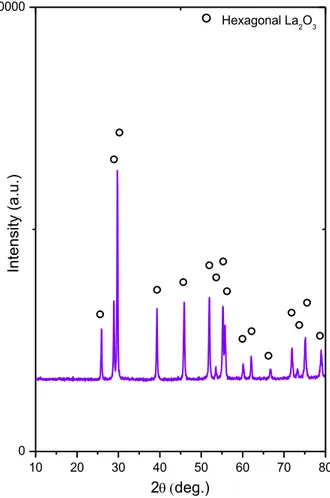
The XRD pattern of the synthesized La2O3 sample is shown in Figure 6. The XRD
pattern reveals the presence of a pure hexagonal La2O3 phase (ICDD card no:
00-005-0602) without any other ordered phases (Figure 6).
Figure 6. XRD pattern of the synthesized La2O3 sample after calcination at 973 K.
10 20 30 40 50 60 70 80 0 10000 In te n si ty (a .u .) 2deg.) Hexagonal La2O3
23
4.1.1.2. XRD Analysis of LaCoO3
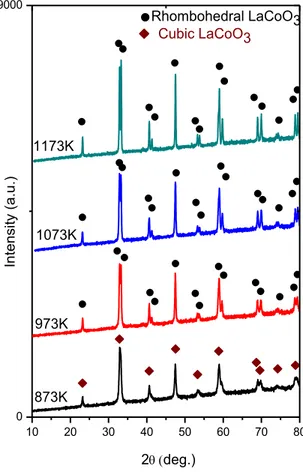
XRD patterns of the LaCoO3 samples obtained after calcination at different
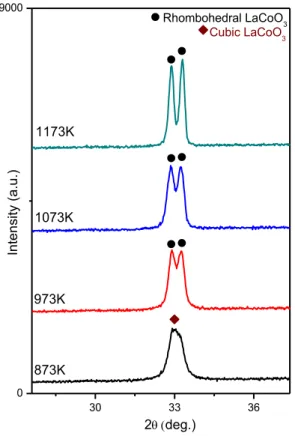
temperatures are presented in Figure 7. Figure 8 shows the major diffraction signal appeared at 2θ = ~ 33°. After calcination at 873 K, the predominantly existing phase seems to be the cubic perovskite phase (ICDD card no: 01-075-0279). It is apparent that the XRD lines at 873 K are broad and composed of convoluted features indicating the presence of a poorly crystalline rhombohedral perovskite phase (ICDD card no: 00-025-1060) as well as the cubic perovskite phase [42, 43]. At higher calcination temperatures, the perovskite signals become sharper and are better resolved. With increasing calcination temperatures, the major perovskite peak (2θ = ~ 33°) starts to split into a couple of well-resolved signals, corresponding to rhombohedral and cubic perovskite phases (Figure 8). Crystal structures of the cubic and rhombohedral phases are shown in Figure 9 [102].
Figure 7. XRD patterns of the synthesized LaCoO3 samples after calcination at
different temperatures. 10 20 30 40 50 60 70 80 0 19000 Cubic LaCoO3 In te n si ty (a .u .) 2deg.) Rhombohedral LaCoO3 1173K 1073K 973K 873K
24
Figure 8. Characteristic XRD signals corresponding to the cubic and rhombohedral
LaCoO3 samples.
Figure 9. Cubic and Rhombohedral structures of LaCoO3 [102] 4.1.1.3. XRD Analysis of LaMnO3
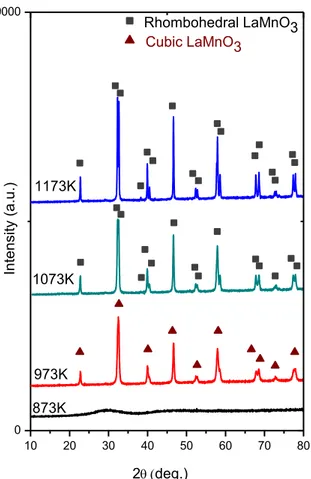
As in the case of the LaCoO3 samples, no other oxide phases were detected in the
XRD analysis of the LaMnO3 samples other than the perovskite phases (Figure 10).
It is worth mentioning that Mn-based samples are amorphous at 873 K and start to
30 33 36 0 19000 Rhombohedral LaCoO3 Cubic LaCoO3 In te n si ty (a .u .) 2deg.) 1173K 1073K 973K 873K rhombohedral cubic
25
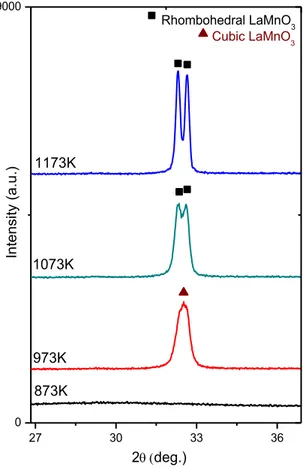
crystallize at higher temperatures (T > 873 K). Figure 11 indicates the major diffraction pattern of LaMnO3 appeared at 2θ = ~ 32.8° After calcination at 973 K, a
cubic perovskite phase (ICDD card no: 00-051-1516) is formed as can be seen in Figure 11. As the calcination temperature is increased to 1073 K, cubic to rhombohedral perovskite (ICDD card no: 01-073-5958) phase transformation is observed with splitting of the signal [43, 44]. The major perovskite signal, which is relatively convoluted at low temperatures splits into a doublet at higher calcination temperatures, indicating the formation of a well-ordered rhombohedral phase at higher temperatures (Figure 11).
Figure 10. XRD patterns of the synthesized LaMnO3 samples after calcination at
different temperatures. 10 20 30 40 50 60 70 80 0 19000 1173K 1073K 973K 873K In te n si ty (a .u .) 2deg.) Rhombohedral LaMnO3 Cubic LaMnO3
26
Figure 11. Characteristic XRD signals corresponding to the cubic and rhombohedral
LaMnO3 samples. 4.1.1.4. XRD Analysis of Pd/LaMnO3 and Pd/LaCoO3
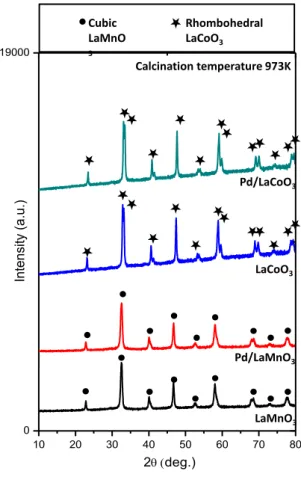
Samples synthesized using the Pd impregnation protocol were also analyzed via XRD (Figure 12). These samples were calcined at 973 K. For both of the Pd-impregnated samples, the only detectable phases were perovskite phases and no other ordered oxides such as PdO were observed. While Mn-based perovskite structures have only a single peak related to the cubic lattice (with a possible contribution form a poorly crystallized rhombohedral phase), the major diffraction line of Co-based perovskites is split into two peaks which exhibits the transformation from cubic to rhombohedral structure (Figure 13).
27 30 33 36 0 19000 1173K 1073K 973K 873K In te n si ty (a .u .) 2deg.) Rhombohedral LaMnO3 Cubic LaMnO3
27
Figure 12. XRD patterns of LaMnO3 and LaCoO3 after calcination at 973 K and
their Pd impregnated counterparts. (Pd impregnated samples were additionaly calcined at 773 K after impregnation).
Figure 13. Characteristic perovskite XRD signals corresponding to the Pd-free and
Pd-containing perovskite samples calcined at 973 K
10 20 30 40 50 60 70 80 0 19000 In te nsi ty (a .u .) 2deg.) LaCoO3 Pd/LaMnO3 LaMnO3 Pd/LaCoO3 Calcination temperature 973K Cubic LaMnO 3 Rhombohedral LaCoO3 30 35 16656.7 2deg.) In te n si ty (a .u .) LaCoO3 Pd/LaMnO3 LaMnO3 Pd/LaCoO3
28
4.1.2. Raman Spectroscopy Experiments
As a benchmark measurement, the Raman spectrum of a pure La2O3 sample which
was synthesized as described above was also acquired (Figure 14). As expected, the corresponding Raman spectrum displayed three characteristic La2O3 Raman peaks
located at 95, 181 cm-1 with the most intense feature appearing at 401 cm-1.
Figure 14. Raman spectrum of La2O3 benchmark sample.
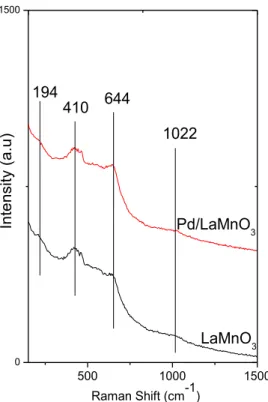
Raman spectra of LaMnO3 and LaCoO3 are presented in Figures 15 and 16. The
Raman spectra of perovskites demonstrate a convoluted set of peaks. After calcination at 973 K, the LaMnO3 sample reveals Raman shifts at c.a. 72, 194, 410,
644 and 1022 cm-1 (Figure 15). These bands can be tentatively assigned as follows,
the band at 410 cm-1 is most likely associated with the La-O modes since the La 2O3
benchmark sample has a major Raman shift at around 401 cm-1. These La-O species can possibly be attributed to both La2O3 and LaMnO3 structures suggesting the
presence of La2O3 domains on the surface, which may be difficult to detect in XRD,
possibly due to their small crystallite size or their lack of atomic order. Additional support for the presence of La-rich phases (i.e. La2O3) on the synthesized perovskite
surfaces will also be presented in the next sections. The Raman band appearing at
500 1000 0 8000 In te n sit y ( a .u ) Raman Shift (cm-1) La2O3 401 181
![Figure 3. Self-regeneration capability of the Pd containing “intelligent” perovskite catalyst [101]](https://thumb-eu.123doks.com/thumbv2/9libnet/5978321.125248/27.892.229.745.488.784/figure-self-regeneration-capability-containing-intelligent-perovskite-catalyst.webp)
![Figure 4. Behavior of the “intelligent” perovskite catalyst and conventional catalyst in redox fluctuations [101]](https://thumb-eu.123doks.com/thumbv2/9libnet/5978321.125248/28.892.194.724.138.444/figure-behavior-intelligent-perovskite-catalyst-conventional-catalyst-fluctuations.webp)
![Figure 5. Schematic diagram of in situ FTIR and TPD analysis system [40].](https://thumb-eu.123doks.com/thumbv2/9libnet/5978321.125248/35.892.172.779.135.461/figure-schematic-diagram-situ-ftir-tpd-analysis.webp)