Comparison of Three Methods for Estimating Volume of the
Uterine Layers in Healthy Women: A Stereological Study
Comparación de Tres Métodos para Estimar el Volumen de las Capas Uterinas en Mujeres Sanas: Un Estudio Estereológico
Omur Karaca Saygili1; Mine Islimye Taskin2; Bahar Yanik Keyik3; Mesut Sackes4; Emrah Ozcan1 & Ilter Kus1
KARACA, S. O.; TASKIN, M. I.; KEYIK, B.Y.; SACKES, M.; OZCAN, E. & KUS, I. Comparison of three methods for estimating volume of the uterine layers in healthy women: A stereological study. Int. J. Morphol., 36(2):614-622, 2018.
SUMMARY: Aim of this study is to measure the volume of the uterine layers in healthy women according to the menstrual cycle phases and to test the agreement between three methods. The study was performed with 28 healthy women. Participants were divided into three groups as follicular (n=7), luteal (n=10) and postmenopausal phase (n=11). We used the point-counting and planimetry method in MR images and the ellipsoid methods in images obtained by transvaginal ultrasonography. Spearman correlation analysis showed significant negative correlations between the volumes of uterine layers and age (p<0.01). The volumes of the total uterus, the total myometrium and the endometrium measured with planimetry and point-counting methods were significantly lower in the postmenopausal women (p<0.01). While volumes of total uterus and the total myometrium significantly lower in the postmenopausal group in measurements done using ellipsoid method, the decrease in the volume of the endometrium was not statistically significant. The Bland–Altman test results indicated an excellent agreement between point-counting and planimetry methods in the volumetric measurements. The ellipsoid method might be inadequate for determining uterine layers volume particularly the endometrium volume. The stereological methods permit unbiased and efficient estimation of volume of uterine layers in vivo examination of MRI.
KEY WORDS: Cavalieri; Planimetry; MRI; Uterus; Volume.
INTRODUCTION
The uterus in reproductive women consists of three layers as the endometrium, the junctional zone (inner myometrium) and the myometrium (outer myometrium) on T2-weighted in magnetic resonance images (MRI). In these images, the endometrium appears a high signal intensity zone, while the outer myometrium appears a medium intensity zone. The Junctional zone appears low signal intensity zone and separates the endometrium from the outer myometrium (Hauth et al., 2007; Wasnik et al., 2011; He et
al., 2016).
The junctional zone has been described as a crucial marker for the diagnosis of adenomyosis and delineating the invasiveness of malignant tumors (Hauth et al.; Wasnik
et al.; He et al.). The simplest and widely used measure is
the thickness of the endometrium and the junctional zone
for the morphological analysis of uterus on the medical images. In general, while the thickness of junctional zone is over 12 mm in adenomyosis, the thickness of less than 10 mm for endometrium is accepted normal in reproductive age women (Novellas et al., 2011; Sofic et al., 2016). Nevertheless, the thickness measurement is performed on the any point on both the anterior or posterior uterine wall and there is no standard measuring point on the uterine wall (Kido et al., 2007; Exacoustos et al., 2011; He et al.; Meylaerts et al., 2017).
Magnetic resonance has a significant role in the evaluation of uterine layers. Magnetic resonance provides a better image quality in normal uterus, thus facilitating the identification of the location of uterine tumors. Although ultrasound is an imaging technique commonly
1 Department of Anatomy, Faculty of Medicine, Balıkesir University, 10145, Balıkesir, Turkey.
2 Department of Gynecology and Obstetrics, Faculty of Medicine, Balıkesir University, 10145, Balıkesir, Turkey. 3 Department of Radiology, Faculty of Medicine, Balıkesir University, 10145, Balıkesir, Turkey.
4 Department of Elementary Education, Necatibey School of Education, Balıkesir University, Balıkesir 10100 Turkey.
used to evaluate genitourinary pathologies, it has limitations in displaying tissue characteristics and accurate visualization of the uterus (Hauth et al.; Wasnik et al.; He
et al.). Moreover, to estimate the uterine volume in
ultrasound images, the most commonly used image analysis method is the ellipsoid (calliper) method. In the calliper method the pooled length measurements are used to estimate the ellipsoidal shape of the uterine volume (Thrippleton et al., 2015). Whereas the stereology based on Cavalieri’s principle used mostly in vivo studies and in MR images is an unbiased method that may estimate the volume of an object divided into a sequence of parallel cross sectional planes (Gundersen et al., 1988; Roberts et
al., 2000). The Cavalieri principle used in the present study
is practical as the estimation of volume, can be performed easily without interfering the routine procedures in clinics and radiological centers (Acer et al., 2010; Thrippleton et
al.). Point-counting and planimetry are commonly used
techniques in estimating volume based on the Cavalieri principle (Gong et al., 1999; Acer et al.). The point-counting method is less time-consuming than planimetry and avoids all assumptions on the shape unlike the ellipsoid method (Thrippleton et al.). Recent studies have demonstrated that point-counting method based on the Cavalieri’s principle has been successfully used to estimate the volume of organs or structures in MR images (Manios
et al., 2016; Mayer et al., 2016).
The aim of this study was to estimate the volumes of the total uterus, the total myometrium, the outer myometrium, the junctional zone, and the endometrium with stereological methods using MRI and transvaginal ultrasonography in healthy women during the menstrual cycle phases and to compare the estimated volumes obtained from three different methods.
MATERIAL AND METHOD
Study population. The protocol of this study was approved by the Ethics Committee of Faculty of Medicine at Erciyes University and written informed consent was obtained from all volunteers. The study was performed in a sample of 17 healthy women volunteers of reproductive age (mean 34.2±4.7 years in luteal phase and mean 36.7±4.5 years in follicular phase) and in 11 postmenopausal women (mean 53.9±7.3 years). Women reporting regular menstrual cycle, non-use of oral contraceptives and not taking hormone replacement therapy, with no history of gynecological illness were identified in the inclusion criteria. Data regarding the participant´s age, body mass index, methods of childbirth, and the number of pregnancies were also collected.
Study protocols. Participants were classified into three groups as follicular phase group (7), luteal phase group (10) and postmenopausal group (11) for pelvic MRI examinations and transvaginal ultrasound. Pelvic MRI and transvaginal ultrasound were performed on the 7th or 8th day of the menstrual cycles for the follicular phase and on the 20th and 21st day for the luteal phase. Postmenopausal status was defined as the absence of menstruation for more than a year. We used three methods for estimation of volume of uterine layers.
1. Point - counting method in MR images. 2. Planimetry method in MR images.
3. Using the Ellipsoid method in images obtained by transvaginal ultrasonography.
MR image acquisition. Pelvic MR images were acquired on a 1.5 tesla system (Philips, Ingenia, 2013). Sagittal T2-weighted imaging without fat suppression was performed (repetition time (TR): 4500 ms, echo time (TE): 80 ms, field of view (FOV): 170x170, matrix size: 172x119, voxel size: 1x1x1, Flip angle: 90). The section thickness was 1.5 mm in all examinations without intersection gap.
Volumetric analysis in MR images
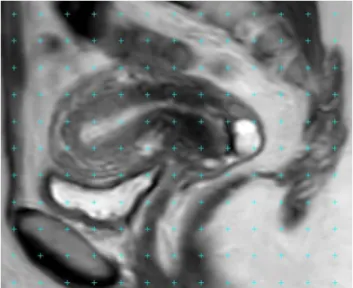
Point - counting method. The point - counting method utilized in this study is based on the Cavalieri principle. 1.5 mm section thicknesses were used to estimate the volume of the region of interest (ROI). Firstly, the MR images were opened with RadiAnt DICOM Viewer and saved in a computer. Then, the square grid system with d = 0.3 cm between the two test points was superimposed,
Fig. 1.A sagittal MRI with a point-counting grid superimposed on it for the estimation of volume of uterine layers.
randomly covering on section image (Fig. 1). The points appeared on the ROI-sectioned surface area were counted for each section. The theoretical basis and details of methodology and the formula used to achieve a coefficient of error (CE) of less than 5 % have been described previously (Gundersen et al.; Roberts et al.).
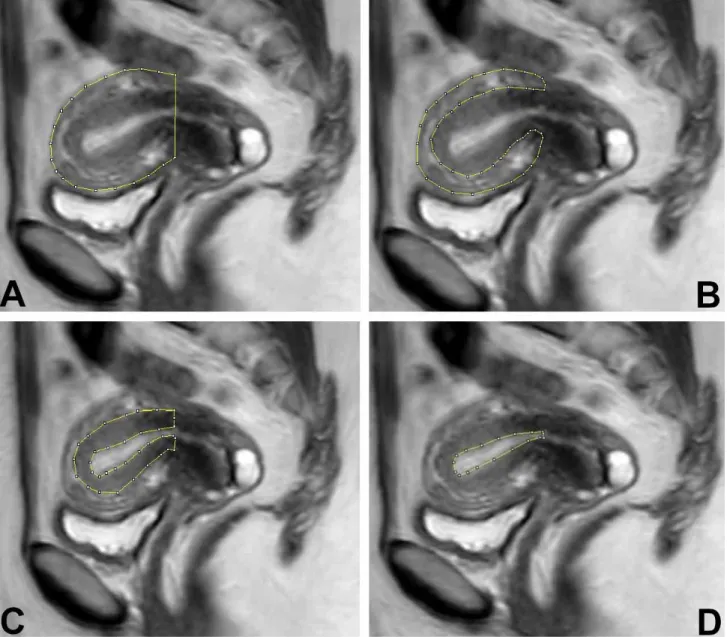
Planimetry method. Uterus MR images were transferred to a computer and image analyses was performed using image analysis software, ImageJ(http://rsb.info.nih.gov/ij/ docs/index.htlm). The images were displayed using a stan-dard image and screen levels on a monitor with stable contrast settings. Boundaries of sections of uterine layers were manually traced on each section of the images (Figs. 2a-d). The cross-sectional surface area was measured with
the Planimetry method using ImageJ software. Using a hand-held mouse, the investigator traced around the area of interest within a slice (Gundersen et al.). The software calculates the number of pixels covered within the traced area, and the process was repeated for each slice. The volumes of uterine layers were calculated based on the pixel size and slice thickness using the following formula: Volume= the sum of the areas (cm2) X slice thickness (cm)
Transvaginal ultrasonography. After letting the patient empty bladder; total uterine, total myometrial and endometrial measurements were obtained with a 7.0 MHz vaginal transducer (Voluson 730, GE Healthcare, USA) in a lithotomy position. The overall uterine length was
Fig. 2. A sagittal MRI with a planimetric contour on it for the estimation of volume of total uterus (a), outer myometrium (b), junctional zone (c) and endometrium (d).
measured in the long axis from the fundus to the cervix (internal os) in sagittal US image. The depth (AP diameter) was measured from the anterior to the posterior wall and perpendicular to the length. The probe was turned slowly counterclockwise to visualize the uterus at 90 degrees to the sagittal view. The maximum width was measured in this transverse (coronal) plane. Sagittal US image of the uterus obtained during the follicular or luteal phase of the menstrual cycle demonstrates the endometrium with a multilayered appearance. Endometrial length and width measured in sagittal view, and then third measurement was made in coronal plane. In postmenopausal group, endometrial measurements were carried out with the same method. The volumes of the total uterus, the total myometrium and the endometrium with transvaginal ultrasonography were calculated using the Ellipsoid for-mula (volume=0.523x length x depth x width).
Statistical analysis. All volumetric data were expressed as mean ± standard deviation (SD). Spearman’s rank correlation coefficients were calculated to assess the association between the volumes of uterine layers measured with three different methods and age, methods of childbirth, and number of pregnancy. The volumetric differences of uterine layers versus to groups (follicular phase, luteal phase and postmenopausal phase) and three different methods were compared using the Kruskal-Wallis test. The Bland– Altman test, along with Pearson correlation coefficients, was used to assess agreement between the three different measurement methods (Altman & Bland, 1983; Bland & Altman, 1986). Friedman's test was performed to examine whether volumetric measurements of patients in follicular phase, luteal phase and postmenopausal phase were different. The level of significance was set at p<0.05 and statistical analyses performed with Number Cruncher Statistical System (NCSS 11 2016).
RESULTS
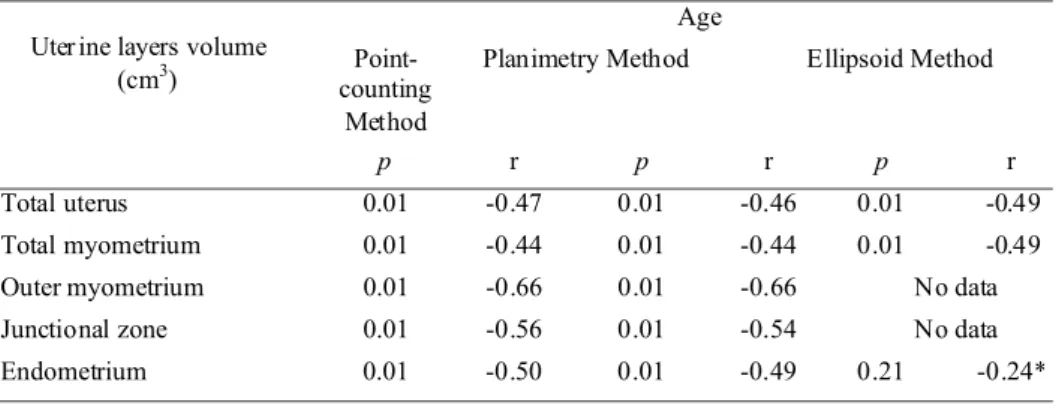
The uteri were anteverted and anteflexed position in 24 cases (85 %). Spearman correlation analysis showed a significant negative correlation between volume of uterine layers (total uterus, total myometrium, outer myometrium, junctional zone and endometrium) and age (Table I). We also found a significant positive correlation between the volume of the outer myometrium and the number of pregnancies (p<0.05). Nevertheless, the correlation between the volumes of uterine layers and other parameters such as height and weight of the women and methods of childbirth was not significant.
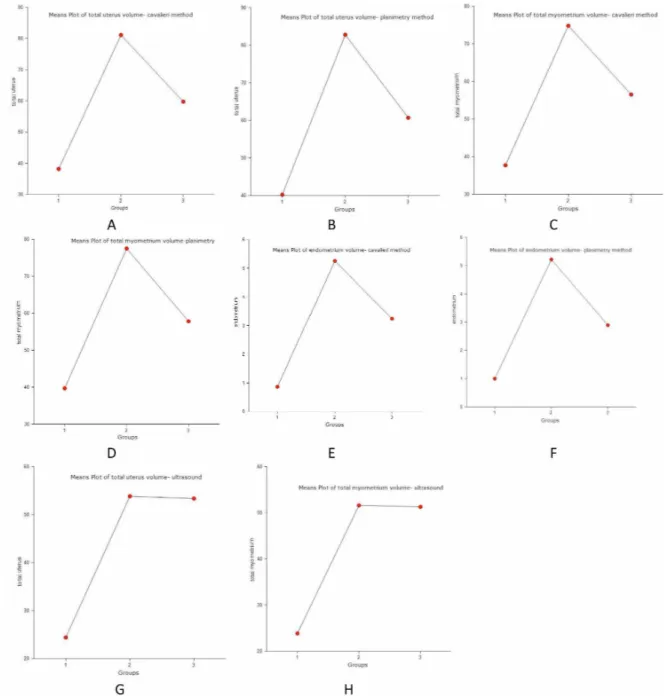
The mean volumes of uterine layers with respect to three methods in premenopausal (follicular and luteal phase groups) and postmenopausal women are presented in Table II. The junctional zone could not be measured on ultrasound images owing to less visualization of this zone. The junctional zone was not visible in 63.6 % of postmenopausal women participating in our study. In premenopausal women, the mean ratio of junctional zone volume versus total myometrium volume was 25.9 % by point - counting method and 26.5 % by planimetry method. The volumes of the total uterus, the total myometrium, and the endometrium measured with planimetry and point – counting methods were significantly lower in the postmenopausal group when compared to the luteal phase group (p<0.01) (Figs. 3a-f). However, in measurements done using ellipsoid method, the volumes of the total uterus and the total myometrium were significantly lower in the postmenopausal group than in the premenopausal group except the endometrium volume (p<0.01) (Figs. 3g-h). There was a decrease in the endometrium volume in the postmenopausal group but it was not statistically significant. When our results compared
Age
Point-counting Method
Planimetry Method Ellipsoid Method Uter ine layers volume
(cm3)
p r p r p r
Total uterus 0.01 -0.47 0.01 -0.46 0.01 -0.49
Total myometrium 0.01 -0.44 0.01 -0.44 0.01 -0.49
Outer myometrium 0.01 -0.66 0.01 -0.66 No data
Junctional zone 0.01 -0.56 0.01 -0.54 No data
Endometrium 0.01 -0.50 0.01 -0.49 0.21 -0.24*
* There is no significant correlation between endometrium volume and age respect to the ellipsoid method. Table I. Spearman correlation coefficients indicating the relationship between uterine layers volume and age
Table II. The mean volume of uterine layers measured with three methods in premenopausal (follicular and luteal phase groups) and postmenopausal women.
*P < 0.05 Volume of total uterus, total myometrium and endometrium in the ellipsoid method was significantly lower than that of the point-counting and planimetry method in the luteal phase and postmenopause group.
Fig. 3. The volume of the total uterus, total myometrium and endometrium in postmenopausal phase (1), luteal phase (2) and follicular phase (3) groups with respect to three methods.
Poin t-counting Method (cm3) Planimetry Method (cm3) Ellipsoid Method (cm3)
Uterine Layers Follicular phase Luteal phase Postmeno pause Follicular phase Luteal phase Postm eno pause Follicular p hase Luteal phase Postmenopa use Total uterus 59.7±2 7 81.0±34 38.1±12 60.7±27 82.7±35 40.2±13 5 3.3±2 6 53.8±20* 24.4±10* Total myometrium 56.4±2 6 74.8±33 37.7±11 57.8±26 77.5±33 39.7±12 5 1.2±2 6 51.5±18* 23.8±9.9*
Outer myometrium 41.0±1 7 56.5±23 No data 40.98±16 57.5±25 No data No data No data No data
Junctional zone 15.4±1 0 19.2±9. 2 No data 16.8±11 20±9.5 No data No data No data No data
Endometrium 3.2±2.1 5.2± 2.8 0.8±1 .0 2.8±1.8 5.2±2.6 0.9±1.1 2 .0±3.2 2.2± 1.8*
to the menstrual cycle phases, there was no significant differences in the volumes of uterine layers measured with three methods between women in the follicular phase and the luteal phase.
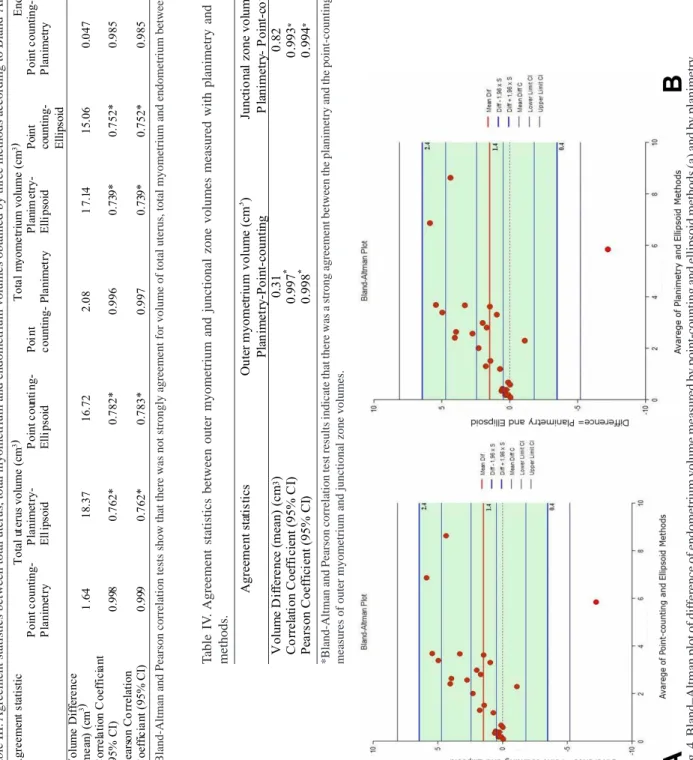
The agreements among three methods were examined constructing Bland-Altman plots using 95 % confidence intervals for volume differences. There were no significant differences among the planimetry and the point-counting methods for all measurements (p<0.01) (Tables III and IV).
T o tal u terus v o lume (c m 3) T o ta l m yom e tr ium vol ume (c m 3) E ndom e tr ium vol ume (c m 3) A g re e m en t s tati stic P o in t c oun ti ng-P la n imet ry P la n imet ry -Ell ip so id P o in t c o unti n g -Ell ip so id Po in t c oun ti ng- P la n im et ry P lan im etry-Ell ip so id Po in t co un ti ng-Ell ip so id P o in t c oun ti ng-P la n im etry P lan im etry-Ell ip so id Po in t c oun ti ng -Ell ip so id V o lu m e Diff ere nc e (m e an ) ( cm 3) 1 .6 4 18 .3 7 1 6 .72 2. 0 8 1 7 .1 4 1 5 .06 0. 0 4 7 1 .4 2 * 1. 4 7 * C orr e la ti o n C o effi c ia n t (95% CI) 0. 9 98 0 .7 62* 0. 7 82* 0. 9 9 6 0 .7 39* 0. 7 52* 0. 9 8 5 0 .5 10* 0. 5 00* P ears on C o rrelati on C o effi c ia n t ( 9 5 % CI) 0 .99 9 0 .7 6 2 * 0 .7 8 3 * 0 .9 9 7 0 .73 9 * 0 .7 5 2 * 0 .9 8 5 0 .5 1 1 * 0 .5 0 0 * Ou ter m y o m et ri u m v o lu m e ( cm 3 ) Jun ct io n al zo ne vol u m e (c m 3 ) A g reeme n t sta ti s ti c s Pl an im et ry -Poin t-co u n ti n g P la n imet ry - P o in t-co u n ti n g Vo lu m e Di ff e re n ce ( m e a n ) (c m 3) 0.31 0 .82 C o rrel at ion C o ef fi c ie n t (95% C I) 0.997 * 0. 9 9 3 * P ea rs o n Coef fi ci e n t (9 5 % CI ) 0 .998 * 0 .994 * T able III.
Agreement statistics between total uterus, total myometrium and endometrium volumes obtained by three methods accord
ing to Bland-Altman and Pearson correlation tests.
* Bland-Altman and Pearson correlation tests show that there was not strongly agreement for volume of total uterus, total myome
trium and endometrium between ellipsoid and other methods.
*Bland-Altman and Pearson correlation test results indicate that there was a strong agreement between the planimetry and the po
int-counting methods for the
measures of outer myometrium and junctional zone volumes.
T
able IV
.
Agreement statistics between outer myometrium and junctional zone volumes measured with planimetry and point-counting
methods.
Fig. 4. Bland–Altman plot of dif
ference of endometrium volume measured by point-counting and ellipsoid methods (a) and by plani
metry
However, there was a mean difference of 1.47 cm3 (49.3 %)
between measurements of volume of the endometrium using the point-counting and ellipsoid method and a difference of 1.42 cm3 (48.9 %) between planimetry and ellipsoid method
(Figs. 4a-b) (Table III). Moreover, there was not a strong agreement for the volumetric measures of total uterus and total myometrium between ellipsoid and other methods (Table III). Friedman analysis demonstrated that the volumes of total uterus, total myometrium and endometrium were significantly lower in ultrasound images than with MR images in the luteal phase and postmenopausal phase groups (p<0.05) (Table II).
DISCUSSION
To be able to diagnose adenomyosis and other uterine diseases or to investigate causes of infertility one must know the normal appearance and volumes of the uterine layers, particularly the volume of the junctional zone and the endometrium. In several studies, the thickness measurement was performed to assess the junctional zone or the endometrium. For example, the thickness of junctional zone over 12 mm and the ratio of junctional zone thickness ver-sus total myometrial thickness over the 40 % have been used as criteria for the diagnosis of adenomyosis (Kido et al., 2007; Sofic et al.; Meylaerts et al.). Moreover, the thickness measurement is performed on the any point on both the ante-rior or posteante-rior uterine wall, and there is no standard measuring point on the uterine wall (Kido et al., 2007; Exacoustos et al.; He et al.). Meylaerts et al. indicated that the outer myometrial thickness and the ratio of junctional zone thickness versus total myometrial thickness would differ depending on the location in the uterine wall. So in this study, it was aimed to investigate volume of uterine layers using stereological methods in healthy women to assess whole uterus.
The appearance and size of the uterine layers change in response to a variety of physiologic effects depending on the postmenopausal status (Kido et al., 2003; Hauth et al.). Our results show that there is a significant decrease in the volume of uterine layers in the postmenopausal women according to three methods, except the endometrium volume where ellipsoid method was used. The Bland-Altman analysis indicated that the average mean difference between ellipsoid and stereological methods was 49 % for endometrium volume. A possible reason for this, is that ellipsoid method had underestimated the volume of uterine layers especially volume of endometrium which has a small volume with respect to other uterine layers. Consistent with our results, Thrippleton
et al., reported that the calliper (ellipsoid) measurements were
biased and underestimated uterine volume by 13 % on avera-ge than Cavalieri measurements. In another study, Acer et al. presented that the most widely used formula for prostate volume determination is elliptic formula, and underestimates prostate volume by 7-34 % using TRUS compared to mean actual volume. Acer et al. reported a difference between prostate volume by point-counting and planimetry, with mean actual volumes of 2.60 % and 1.33 % respectively.
In the present study, we were unable to compare the junctional zone volume between our groups, as this area was not visible in nearly two-thirds of postmenopausal women. This limitation appears to be in line with previous studies reporting that the junctional zone cannot be delineated in about 30-50 % postmenopausal women (Bazot et al., 2001; Novellas
et al.; He et al.). To assess junctional zone, while many studies
measured the ratio of junctional zone thickness, whether in healthy women or women diagnosed with adenomyosis, no previous study reported the ratio of junctional zone volume (Meylaerts et al.). In the current study, the mean ratio of junctional zone volume to total myometrium volume of healthy women with premenopausal status was 25.9 % by Cavalieri method and 26.5 % by planimetry method. As it was not possible to obtain clear images of the junctional zone, during ultrasound, we could not calculate the ratio values of this layer by ellipsoid method. Naftalin et al. (2012), reported a similar limitation that the visualization of junctional zone was optimal in 47 %, satisfactory in 42 %, and unsatisfactory in 12 % of the women, with normal uterus and visualization quality gets better with increasing endometrial thickness and with decreasing parity in three-dimensional ultrasound images.
Age is another factor that influences the appearance and size of the uterine layers. Hauth et al. stated that the increase in the junctional zone thickness and the uterine volume until the age of 41-50 years, is followed by a decrease in these measurements. In addition, He et al. showed that the thickness of the junctional zone was significantly higher in the 20-30 year age women versus the 30-40 years age women. Similar to the findings of previous studies, in the current study the volumetric measures of uterine layers tended to decrease as the age of the women increased, in measurements using sterelogical methods and ellipsoid method.
In addition to age and postmenopausal status, hor-monal variation in the women’s reproductive age can influence the thickness of the uterine layers throughout the menstrual cycles (Mccarthy et al., 1986; He et al.). McCarthy
et al. reported that endometrial thickness of healthy women
not taking oral contraceptives was significantly larger in the luteal phase, but the thickness of the junctional zone in the follicular and luteal phase was not different. He et al. indicated that in the 20-30 years age women, the thickness
of the junctional zone increased significantly during the menstrual phase while no significant changes during the menstrual cycles phases in the 30-40 years age women was observed. Likewise, in our premenopausal group nearly 30-40 years age, neither the volumetric measure of the junctional zone nor the endometrium significantly changed in the follicular and luteal phase in all methods.
Nonetheless, the present study has several limitations. Firstly, the number of participants was low as pelvic MRI and transvaginal ultrasound were performed on certain days of the menstrual cycles for the in each volunteer during a single menstrual cycle. This was impractical for participant because it required more time and had to be done on specific days. The second limitation is that volume of the junctional zone could not be measured on ultrasound images owing to less visualization of this zone. Moreover, the junctional zone is not visible in 63.6 % of postmenopausal women participating in our study such as previous studies point out this problem (Bazot et al.; Novellas et al.; He et al.).
In conclusion, we found an excellent agreement between point counting and planimetry methods both providing high precision and approximately equal levels of accuracy. The stereological methods allow unbiased and efficient estimation of volume of uterine layers in vivo examination of MRI. However, the results suggested that the ellipsoid method used in the ultrasound images might be inadequate for determining uterine layers volume particularly the endometrium volume. Therefore, we suggest that estimating volume of uterine layers using stereological method may be clinically relevant for gynecology surgeons for the investigation of the uterus pathologies.
ACKNOWLEDGMENTS
The authors are thankful to volunteer. This study was supported by Scientific Research Projects Unit of Balikesir University with grant number 2012/07.
KARACA, S. O.; TASKIN, M. I.; KEYIK, B. Y.; SACKES, M.; OZCAN, E. & KUS, I. Comparación de tres métodos para estimar el volumen de las capas uterinas en mujeres sanas: Un estudio estereológico. Int. J. Morphol., 36(2):614-622, 2018.
RESUMEN: El objetivo de este estudio fue medir el vo-lumen de las capas uterinas en mujeres sanas de acuerdo con las fases del ciclo menstrual y probar la concordancia de tres méto-dos. El estudio se realizó en 28 mujeres sanas. Las participantes se dividieron en tres grupos, folicular (n=7), luteal (n=10) y fase posmenopáusica (n=11). Utilizamos el método de conteo puntual
y planimetría en imágenes de resonancia magnética y utilizamos los métodos elipsoides en imágenes obtenidas por ultrasonografía transvaginal. El análisis de correlación de Spearman mostró corre-laciones negativas significativas entre los volúmenes de las capas uterinas y la edad (p <0,01). Se midieron con planimetría los volú-menes total de útero, el miometrio y endometrio, los métodos de recuento de puntos fueron significativamente más bajos en las mujeres posmenopáusicas (p <0,01). Por otra parte, el volumen total de útero y el total del miometrio fue significativamente me-nor en el grupo posmenopáusico en las mediciones realizadas con el método elipsoide. La disminución en el volumen del endometrio no fue estadísticamente significativa. Los resultados de las prue-bas de Bland-Altman indicaron una excelente concordancia entre los métodos de recuento de puntos y de planimetría en las medi-ciones volumétricas. El método elipsoide puede ser inadecuado para determinar el volumen de las capas uterinas, particularmente en el volumen del endometrio. Los métodos estereológicos permi-ten una estimación imparcial y eficiente del volumen de las capas uterinas en el examen in vivo de la resonancia magnética.
PALABRAS CLAVE: Cavalieri; Planimetría; IRM; Útero; Volumen.
REFERENCES
Acer, N.; Ugurlu, N.; Uysal, D. D.; Unur, E.; Turgut, M. & Camurdanoglu, M. Comparison of two volumetric techniques for estimating volume of intracerebral ventricles using magnetic resonance imaging: a stereological study. Anat. Sci. Int., 85(3):131-9, 2010.
Altman, D. G. & Bland, J. M. Measurement in medicine: The analysis of method comparison studies. J. R. Stat. Soc. Ser. D, 32(3):307-17, 1983. Bazot, M.; Cortez, A.; Darai, E.; Rouger, J.; Chopier, J.; Antoine, J. M. & Uzan, S. Ultrasonography compared with magnetic resonance imaging for the diagnosis of adenomyosis: correlation with histopathology. Hum.
Reprod., 16(11):2427-33, 2001.
Bland, J. M. & Altman, D. G. Statistical methods for assessing agreement between two methods of clinical measurement. Lancet, 1(8476):307-10, 1986.
Exacoustos, C.; Brienza, L.; Di Giovanni, A.; Szabolcs, B.; Romanini, M. E.; Zupi, E. & Arduini, D. Adenomyosis: three-dimensional sonographic findings of the junctional zone and correlation with histology.
Ultrasound Obstet. Gynecol., 37(4):471-9, 2011.
Gong, Q. Y.; Tan, L. T.; Romaniuk, C. S.; Jones, B.; Brunt, J. N. & Roberts, N. Determination of tumour regression rates during radiotherapy for cervical carcinoma by serial MRI: comparison of two measurement techniques and examination of intraobserver and interobserver variability. Br. J. Radiol., 72(853):62-72, 1999.
Gundersen, H. J. G.; Bendtsen, T. F.; Korbo, L.; Marcussen, N.; Møller, A.; Nielsen, K.; Nyengaard, J. R.; Pakkenberg, B.; Sørensen, F. B.; Vesterby, A. & West, M. J. Some new, simple and efficient stereological methods and their use in pathological research and diagnosis. APMIS, 96(5):379-94, 1988.
Hauth, E. A.; Jaeger, H. J.; Libera, H.; Lange, S. & Forsting, M. MR imaging of the uterus and cervix in healthy women: determination of normal values. Eur. Radiol., 17(3):734-42, 2007.
He, Y. L.; Ding, N.; Li, Y.; Li, Z.; Xiang, Y.; Jin, Z. Y. & Xue, H. D. Cyclic changes of the junctional zone on 3 T MRI images in young and middle-aged females during the menstrual cycle. Clin. Radiol., 71(4):341-8, 2016.
L.; Koyama, T. & Fujii, S. The effect of oral contraceptives on uterine contractility and menstrual pain: an assessment with cine MR imaging.
Hum. Reprod., 22(7):2066-71, 2007.
Kido, A.; Togashi, K.; Koyama, T.; Yamaoka, T.; Fujiwara, T. & Fujii, S. Diffusely enlarged uterus: evaluation with MR imaging. Radiographics,
23(6):1423-39, 2003.
Manios, G. E.; Mazonakis, M.; Voulgaris, C.; Karantanas, A. & Damilakis, J. Abdominal fat volume estimation by stereology on CT: a comparison with manual planimetry. Eur. Radiol., 26(3):706-13, 2016.
Mayer, K. N.; Latal, B.; Knirsch, W.; Scheer, I.; von Rhein, M.; Reich, B.; Bauer, J.; Gummel, K.; Roberts, N. & Tuura, R. O. Comparison of automated brain volumetry methods with stereology in children aged 2 to 3 years. Neuroradiology, 58(9):901-10, 2016.
McCarthy, S.; Tauber, C. & Gore, J. Female pelvic anatomy: MR assessment of variations during the menstrual cycle and with use of oral contraceptives. Radiology, 160(1):119-23, 1986.
Meylaerts, L. J.; Wijnen, L.; Grieten, M.; Palmers, Y.; Ombelet, W. & Vandersteen, M. Junctional zone thickness in young nulliparous women according to menstrual cycle and hormonal contraception use. Reprod.
Biomed. Online, 34(2):212-20, 2017.
Naftalin, J.; Hoo, W.; Nunes, N.; Mavrelos, D.; Nicks, H. & Jurkovic, D. Inter- and intraobserver variability in three-dimensional ultrasound assessment of the endometrial-myometrial junction and factors affecting its visualization. Ultrasound Obstet. Gynecol., 39(5):587-91, 2012. Novellas, S.; Chassang, M.; Delotte, J.; Toullalan, O.; Chevallier, A.;
Bouaziz, J. & Chevallier, P. MRI characteristics of the uterine junctional zone: from normal to the diagnosis of adenomyosis. A. J. R. Am. J.
Roentgenol., 196(5):1206-13, 2011.
Roberts, N.; Puddephat, M. J. & McNulty, V. The benefit of stereology for quantitative radiology. Br. J. Radiol., 73(871):679-97, 2000. Sofic, A.; Husic-Selimovic, A.; Carovac, A.; Jahic, E.; Smailbegovic, V. &
Kupusovic, J. The significance of MRI evaluation of the uterine junctional zone in the early diagnosis of adenomyosis. Acta Inform.
Med., 24(2):103-6, 2016.
Thrippleton, M. J.; Munro, K. I.; McKillop, G.; Newby, D. E.; Marshall, I.; Roberts, N. & Critchley, H. O. Unbiased and efficient estimation of the volume of the fibroid uterus using the Cavalieri method and magnetic resonance imaging. Reprod. Sci., 22(1):15-22, 2015.
Wasnik, A. P.; Mazza, M. B. & Liu, P. S. Normal and variant pelvic anatomy on MRI. Magn. Reson. Imaging Clin. N. Am., 19(3):547-66, 2011.
Corresponding author:
Assist. Prof. Dr. Omur Karaca Saygili Department of Anatomy Faculty of Medicine Balıkesir University Cagis Yerleskesi 10145, Balıkesir TURKEY E-mail: [email protected] Received: 07-12-2017 Accepted: 04-02-2018