Contents lists available atScienceDirect
Journal of Neuroimmunology
journal homepage:www.elsevier.com/locate/jneuroimShort Communication
Metabolomics approaches in experimental allergic encephalomyelitis
Battini S.
a, Bund C.
a,b, Moussallieh F.M.
b, Çiçek A.E.
c,d, De Sèze J.
e,f, Namer I.J.
a,b,g,⁎aICube, UMR 7357 University of Strasbourg/CNRS, France
bDepartment of Biophysics and Nuclear Medicine, Hautepierre Hospital, University Hospitals of Strasbourg, France cComputational Biology Department, Carnegie Mellon University, Pittsburgh, PA, United States
dComputer Engineering Department, Bilkent University, Ankara, Turkey
eDepartment of Neurology, Hautepierre Hospital, University Hospitals of Strasbourg, France fINSERM U1119, Strasbourg, France
gFMTS, Faculty of Medicine, Strasbourg, France
A R T I C L E I N F O
Keywords: Metabolomics HRMAS NMR Biomarker EAE model Multiple sclerosis InflammationA B S T R A C T
A myelin basic protein (MBP)-induced experimental allergic encephalomyelitis (EAE) involves paraplegia due to a reversible thoracolumbar spinal cord impairment. The aims of this study were thus tofind significant metabolic biomarkers of inflammation and identify the site of inflammation in the central nervous system (CNS) during the acute signs in of the disease using metabolomics.
All the EAE samples were associated with higher levels of lactate, ascorbate, glucose and amino acids, and decreased level of N-acetyl-aspartate (NAA) compared to the control group.
A decreased NAA level has been particularly shown in lumbar spinal cord in relationship with the clinical signs.
1. Introduction
EAE is a well-established animal model of cell-mediated auto-immune diseases of CNS and as such remains the most commonly used experimental model of multiple sclerosis (MS).
An MBP-induced EAE model is characterized by reversible para-plegia, tail weakness and an incontinence on the 11th–12th day after immunization (Namer et al., 1992), corresponding to thoracolumbar impairment.
MR imaging, particularly using multiparametric quantitative tech-niques (T1, T2 and T2* relaxation time measurements, diffusion and magnetization transfer ratio measurements), and MR spectroscopy have been widely used to explain the disease's physiopathology mechanisms including those of observed in the normal appearing white matter (Reitz et al., 2016). In recent years, NMR or mass spectrometry meta-bolomics, has been used to investigate the metabolite changes in only cerebrospinal fluid which reflects the tissue inflammation associated with EAE (Smolinska et al., 2011; Blanchet et al., 2011; Smolinska
et al., 2012; Noga et al., 2012; Lutz et al., 2013; Gebregiworgis et al., 2013; Mangalam et al., 2013; Coulier et al., 2013; Cocco et al., 2015; Dickens et al., 2015; Poisson et al., 2015) or MS (Sinclair et al., 2010; Lutz et al., 2007; Villostada et al., 2017; Bhargava and Calabresi, 2016; Pieragostino et al., 2015; Dickens et al., 2014; Reinke et al., 2014; Vingara et al., 2013; Moussalieh et al., 2014). The aims of this study were thus to (Namer et al., 1992)find significant metabolic biomarkers of inflammation in intact CNS tissues, and (Reitz et al., 2016) identify the site and the degree of inflammation in different level of the CNS (including the optic nerve) during the acute signs of EAE using1H-high resolution magic angle spinning (HRMAS) nuclear magnetic resonance (NMR) spectroscopy.
2. Material and methods 2.1. Population and induction of EAE
This study included 20 female Lewis rats (Charles River, France),
https://doi.org/10.1016/j.jneuroim.2017.11.018
Received 12 September 2017; Received in revised form 30 November 2017; Accepted 30 November 2017
⁎Corresponding author at: Department of Biophysics and Nuclear Medicine, University Hospitals of Strasbourg, Hautepierre Hospital, 1, Avenue Molière, 67098 Strasbourg Cedex,
France.
E-mail address:[email protected](I.J. Namer).
0165-5728/ © 2017 Elsevier B.V. All rights reserved.
aged 6–8 weeks, (weight: 130–145 g). Ten rats were immunized with intradermal injection of a 0.1 mg of MBP in a complete Freund adjuvant containing 0.5 mg of attenuated Mycobacterium tuberculosis strain H37RA (EAE group) (Namer et al., 1992). Ten other non-immunized rats constituted the control group.
2.2. Tissue sample preparation for HRMAS NMR spectroscopy
All rats were sacrificed the same day when clinical signs were maximal (appearance offlaccid paraplegia (score 5, (McFarlin et al., 1974)), on the 12th day in the EAE group. The whole CNS and optic nerves were collected and snap-frozen in liquid nitrogen before storage. The sample preparation was performed at−20 °C and was placed in a 25μL disposable insert. The amount of tissue used for analysis ranged from 6 to 20 mg.
2.3. HRMAS NMR data acquisition
All spectra were achieved on a Bruker Avance III 500 spectrometer operating at a proton frequency of 500.13 MHz and equipped with a 4 mm HRMAS probe operating at 4 °C. A 1D proton spectrum using a Carr–Purcell–Meiboom–Gill (CPMG) pulse sequence was acquired with an inter-pulse delay of 285μs and an acquisition time of 10 min (Imperiale et al., 2013). A total of 31 metabolites were identified within the range of 4.69–1.02 ppm from the spectra, obtained from all tissue samples (Table 1). Among the 31 identified metabolites, only 25 me-tabolites were quantified. Indeed, only well-defined peaks with no overlapping in the 1D CPMG spectra were selected for quantification. 2.4. HRMAS NMR data processing and statistical analyses
Setup included ensuring the lactate linewidth was < 1 Hz and < 1.5 Hz for all other quantified metabolites. All collected spectra were acceptable for processing and statistical analyses (EAE = 44 samples and control = 40 samples): 19 brain tissue samples (respec-tively 9 and 10), 17 cervical spinal cord tissue samples (respec(respec-tively 9 and 8), 20 thoracic spinal cord tissue samples (respectively 10 and 10), the 20 lumbar spinal cord tissue samples (respectively 10 and 10) and 8 optic nerve tissue samples (respectively 2 and 6).
Spectra were normalized according to sample weight and the region between 4.69 and 1.02 ppm of each 1D spectra was automatically bucketed into integral regions of 0.01 ppm, using AMIX 3.9.14 software (Bruker GmbH, Germany) and it was then exported and analyzed into SIMCA P (version 13.0.3, Umetrics AB, Umeå, Sweden). An orthogonal partial least square-discriminant analysis (OPLS-DA) was performed to analyze the data. The following OPLS-DA models were used in order to compare the EAE group and the control group in:
•
Lumbar spinal cord•
Thoracic spinal cord•
Cervical spinal cord•
Brain•
Optic nerveThe model quality was reported for OPLS-DA: R2Y > 0.7 and Q2≥ 0.5 can be considered as a good predictor.
Metabolites' quantification was performed using the PULCON method with an external reference standard of lactate (3μmol), scanned under the same analytical conditions as the tissue samples (Wider and Dreier, 2006).
Peaks of interest were automatically defined by an in-house
Table 1
NMR resonance assignments of the metabolites identified in samples of Lewis rats with EAE. Each peak in the 2D spectra represents a correlation1H–13C. The groups in bold
text were used to perform the metabolites' quantification. Metabolite Group 1H chemical shift
(ppm) 13C chemical shift (ppm) 1 Acetic acid CH3 1.92 26.04 2 Alanine CH3 1.48 18.97 3 Allocystathionine CH2 2.18 32.48 CH2′-S 3.11 34.42 CH-NH2 3.89 55.07 CH′-NH2 3.94 56.47 4 Arginine βCH2 1.92 30.36 δCH2 3.23 43.30 αCH 3.77 57.09 5 Ascorbate CH2 3.71 75.29 CH-O 4.52 81.03 6 Aspartate CH2(u) 2.70 39.28 CH2(d) 2.81 39.24 CH-NH2 3.89 55.07 7 Betain (CH3)3 3.29 56.12 CH2 3.89 69.20 8 Choline N+-(CH 3)3 3.21 56.58 N+-CH 2 3.53 70.02 CH2-OH 4.07 58.26 9 Creatine CH3 3.03 39.61 CH2 3.93 56.46 10 GABA βCH2 1.90 26.06 γCH2 2.29 36.81 αCH2 3.00 41.96 11 Glutamate CH2 2.06 29.82 CH2-CO 2.34 36.09 12 Glutamine CH2 2.14 29.07 CH2-CO 2.44 33.53 CH-NH2 3.77 57.14 13 Glycerophosphocholine N+-(CH 3)3 3.24 56.66 CH2-O 4.31 62.63 14 Glycine CH2 3.56 44.19 15 Hypotaurine CH2-S 2.65 58.35 CH2-N 3.35 36.34 16 Isoleucine CH3-CH2 0.94 16.81 CH-NH2 3.64 65.26 17 Lactate CH3 1.33 22.79 CH 4.12 71.29 18 Leucine (CH3)2 0.95 24.98 CH2 1.72 29.26 CH-NH2 3.73 55.92 19 Lysine δCH2 1.72 32.90 εCH2 3.01 41.91 βCH2 1.93 30.30 20 Methionine CH2(u) 2.05 16.84 21 Myo-inositol (CH)2 3.53 74.06 (CH)2 3.62 75.17 CH 4.06 74.96 22 NAA CH3 2.02 24.68 CH 4.38 56.22 23 Phosphocreatine CH3 3.03 39.68 CH2 3.93 56.51 24 Phosphorylcholine N+-(CH 3)3 3.22 56.70 CH2-O 4.17 61.47 25 Serine CH2-OH 3.97 63.09 CH-NH2 3.84 59.23 26 Taurine CH2-N 3.42 38.27 CH2-S 3.26 50.27 27 Threonine CH-NH2 3.58 63.34 CH-OH 4.25 68.82 28 Valine CH3 1.03 20.85 CH 3.59 63.29 29 α-glucose C4H 3.40 72.30 C2H 3.54 73.94 C3H 3.71 75.37 C2H 3.85 63.35 C1H 5.23 95.02
program using MATLAB 7.0 (Mathworks, Natik, United States). Peak integration was then compared to the one obtained with the lactate reference and was later corrected according to the number of protons; results were expressed as nmol/mg of tissue.
As our population is small, additional network analyses using the “algorithm to determine expected metabolite level alterations”, based on mutual information (ADEMA, (Cicek et al., 2013)), were performed following our initial statistical analyses. The network was constructed using the Kyoto Encyclopedia of Genes and Genomes (Kanehisa and Goto, 2000; Kanehisa et al., 2014) and Salway's work (Salway, 2014). Some groups of metabolites were compared related to involved meta-bolic pathways as follows:
•
Taurine, Hypotaurine, Aspartate, Serine, Methionine•
Aspartate, N-acetyl-aspartate, Threonine•
Aspartate, Threonine•
Aspartate, Methionine, Allocystathionine, Hypotaurine, Taurine•
Aspartate, Lysine•
Serine, Allocystathionine, Hypotaurine, Taurine•
Glucose, Serine, Glycine•
Glutamate, Valine•
Glucose, Lactate•
Valine, Lactate, Alanine•
Glucose, Myoinositol, Ascorbate, Glycine, Glutamate•
Glutamate, Glutamine•
Glutamate, Glutamine, Gamma-aminobutyric acid•
Glutamate, Glutamine, Glycine•
Glutamate, Glutamine, Creatine•
Glutamate, Glycine, Creatine•
Choline, Glycerophosphocholine, Phosphorylcholine, Total-Choline•
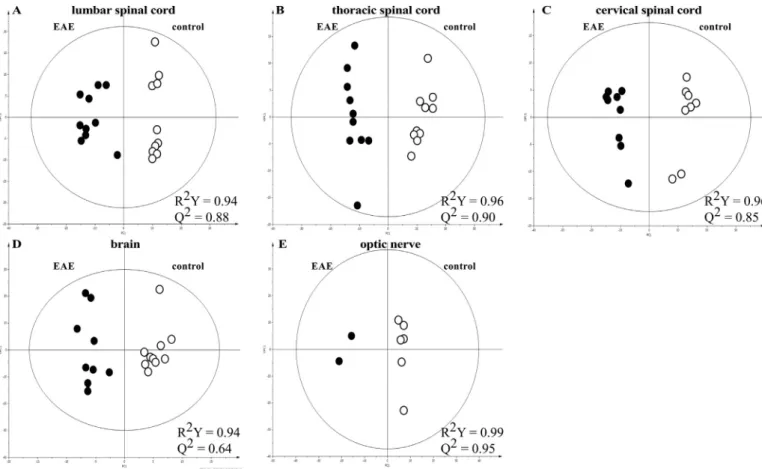
Betain, Methionine, Choline 3. ResultsMetabolomic profiles of the EAE and control groups were clearly separated by a bi-component OPLS-DA, showing lumbar/thoracic/cer-vical/spinal cord inflammation as well as brain and optic nerve in-flammation (Fig. 1). Then, the network analyses using ADEMA in-dicated the metabolites that are predicted to increase, decrease or remain stable, in the EAE group (Fig. 2,Table 2).
Fig. 1. Bi-component OPLS-DA models in lumbar (A), thoracic (B) and cervical (C) spinal cord, brain (D) and optic nerve (E): EAE group (full symbols) and control group (open symbols). These OPLS-DA were employed to optimize the separation between groups and to classify the samples in each model. OPLS-DA was performed on the whole set of variables (spectral interval of 0.01 ppm) to select those with real discriminating power. Cross-validation was used in each OPLS-DA model to determine the number of components and to avoid data over-fitting. Two measurements of model quality were reported for OPLS-DA: R2Y and Q2representing, respectively, the accuracy offit (i.e. data variation) and the accuracy of prediction, as
Metabolomics profiles of intact tissue were clearly separated by a heat map showing the levels of 26 metabolites in the EAE and control groups, comparing cervical, thoracic and lumbar spinal cord, in order to represent the individual differences in the metabolites' concentrations (Fig. 3). A decreased level of NAA was particularly highlighted in samples from EAE group in comparison with samples from control group. Then, an increased level of amino acids was also highlighted in samples from the EAE group (Fig. 3).
3.1. Level of NAA
In order to correlate metabolomics and clinical signs, we focused on the level of NAA which reflects neuronal dysfunction. The level of NAA in intact tissue was found to be reduced in all EAE-related samples compared to control-related samples, but was significantly decreased in lumbar spinal cord samples if compared to others, including thoracic
and cervical spinal cord samples (Fig. 4). 4. Discussion
Metabolomics is the latest stage of the multi-omics approaches, after genomics, transcriptomics and proteomics. Currently, well-recognized tools for metabolomics are NMR spectroscopy and gas or liquid chro-matography–mass spectrometry. HRMAS NMR spectroscopy technology is particularly suitable for the analysis of intact tissue. This avoids the need for chemical extraction procedures or for handling the samples, both of which are required by mass spectrometry or liquid-state NMR spectroscopy. HRMAS NMR spectroscopy enables identification and quantification of several metabolites in intact tissues from spectra with excellent resolution and signal to noise ratio with few material (5–20 mg). HRMAS NMR provides new insights in the study tissue metabolic pathways in EAE by identification of cell membranes and
Fig. 2. Metabolic network analysis using ADEMA in lumbar spinal cord. The red, green and blue arrows respectively indicate the metabolites that are predicted to increase, decrease or remain stable, in the EAE group. (For interpretation of the references to color in thisfigure legend, the reader is referred to the web version of this article.)
phospholipid metabolism, cellular energy production via neogluco-genesis, tricarboxylic acid cycle and oxidative stress. Our results about EAE-related samples' metabolome show a higher level of glucose, lac-tate, phosphocholine and amino acids (particularly, serine, taurine, alanine, lysine, and glutamine).
Areas within tissues in Lewis-rats with EAE are hypoxic which has implications on the cellular metabolism (Johnson et al., 2016). Hypoxia may also affect choline phosphorylation through effect on Chk-α and transporters (Glunde et al., 2008). Hypoxia may also promote damaged cells growth by particularly stimulating glycolysis.
We observed a higher level of lactate in all the CNS tissues in EAE. Elekes et al., hypothesized that glycogenolysis was induced by stress
and, astroglial cells were exported by lactate using neurotransmitter or hormonal processes (Elekes et al., 1996). As described by Lutz et al., this could contribute and explain increased level of lactate in in-flammation (Lutz et al., 2007). Given the elevated glycolysis in in-flammation, leading to increased lactate production, the ability to uti-lize lactate could provide an additional advantage to cells. Indeed, the inhibition of glycolysis through suppressing LDHA expression by RNA interference decreased the growth of damaged cells. Increased levels of amino acids confirm many of the findings from other studies which analyzed the CSF, by using the EAE model and from patients with MS (Elekes et al., 1996). This could represent a critical pathway leading to neuroinflammatory process that is recognized in EAE and MS (Musgrave et al., 2011).
Furthermore, a decreased level of NAA has also been shown in all samples from the EAE group, particularly in lumbar spinal cord sug-gesting a relationship between neuronal dysfunction and the clinical signs previously described (Wolinsky and Narayana, 2002).
In order to demonstrate the full neurological impairment in EAE models,finer supplemental examinations are probably necessary, in-stead of gross clinical examination.
5. Conclusions
HRMAS NMR spectroscopy, applied to an MBP-induced EAE model, demonstrates that the inflammatory process affects the whole CNS in-cluding the optic nerve even if paraplegia is the only clinical sign ob-served. The level of NAA is lower in the lumbar spine, which is also related to our clinical observations. This technique could be used in order to evaluate the efficiency of the different therapeutic programs which could be tested on this model.
Nonstandard abbreviations
ADEMA algorithm to determine expected metabolite level alterations CPMG Carr-Purcell-Meiboom-Gill
HRMAS high resolution magic angle spinning
OPLS-DA orthogonal partial least square-discriminant analysis Institutional review board/ethics board consent
The Departmental Division of the Veterinary Department of Bas-Rhin approved the study (Research location: A 67-482-30). The per-sonal authorization for this study corresponds to the following number: 67-190 (Date: 01/09/2009).
Competing interests
All authors declare that they have no competing interests. All authors have read and approved thefinal manuscript. Acknowledgments
We gratefully acknowledge J. Steibel and C.D. Lam for their skillful technical assistance regarding the EAE model management as well as K. Elbayed for the MatLab scripts that he developed allowing for the quantification of metabolites.
Table 2
Metabolites that are predicted to increase (red), decrease (green) or remain stable (=), in the EAE group in comparison with the control group. GPC, glycerophosphocholine; PC, phosphocholine; LSC, lumbar spinal cord; TSC, thoracic spinal cord; CSV, cervical spinal cord; B, brain; ON, optic nerve.
Lumbar Spinal Cord Thoracic Spinal Cord Cervical Spinal Cord Brain Optic nerve GPC PC Choline Lysine Methionine = = Betain = Serine Allocystathionine = = = Hypotaurine Threonine Aspartate = NAA = Alanine Valine Glucose = Lactate = = = Glycine = MyoInositol Ascorbate = GSH = = = = = Glutamate = = = Glutamine = GABA Creatine = = =
References
Bhargava, P., Calabresi, P.A., 2016. Metabolomics in multiple sclerosis. Mult. Scler. 22, 451–460.
Blanchet, L., Smolinska, A., Attali, A., et al., 2011. Fusion of metabolomics and pro-teomics data for biomarkers discovery: case study on the experimental autoimmune encephalomyelitis. BMC Bioinforma. 12, 254–266.
Coulier, L., Muilwijk, B., Bijlsma, S., et al., 2013. Metabolite profiling of small cere-brospinalfluid sample volumes with gas chromatography-mass spectrometry: appli-cation to a rat model of multiple sclerosis. Metabolomics 9, 78–87.
Dickens, A.M., Larkin, J.R., Griffin, J.L., et al., 2014. A type 2 biomarker separates re-lapsing-remitting from secondary progressive multiple sclerosis. Neurology 83, 1492–1499.
Dickens, A.M., Larkin, J.R., Davis, B.G., et al., 2015. NMR-based metabolomics separates the distinct stages of disease in a chronic relapsing model of multiple sclerosis. J. NeuroImmune Pharmacol. 10, 435–444.
Elekes, O., Venema, K., Postema, F., et al., 1996. Possible glial contribution of rat hip-pocampus lactate assessed with micro dialysis and stress. Acta Neurochir. Suppl. 67, 1–5.
Gebregiworgis, T., Massilamany, C., Ganaplara, A., et al., 2013. Potential of urinary metabolites for diagnosing multiple sclerosis. ACS Chem. Biol. 8, 684–690.
Glunde, K., Shah, T., Winnard Jr., P.T., et al., 2008. Hypoxia regulates choline kinase expression through hypoxia-inducible factor-1 alpha signaling in a human prostate cancer model. Cancer Res. 68, 172–180.
Imperiale, A., Elbayed, K., Moussallieh, F.M., Reix, N., Piotto, M., Bellocq, J.P., et al., 2013. Metabolomic profile of the adrenal gland: from physiology to pathological. Endocr. Relat. Cancer 20, 705–716.
Johnson, T.W., Wu, Y., Nathoo, N., et al., 2016. Gray matter hypoxia in the brain of the experimental autoimmune encephalomyelitis model of multiple sclerosis. PLoS One 11, e0167196.
Kanehisa, M., Goto, S., 2000. KEGG: kyoto encyclopedia of genes and genomes. Nucleic Acids Res. 28, 27–30.
Kanehisa, M., Goto, S., Sato, Y., et al., 2014. Data, information, knowledge and principle: back to metabolism in KEGG. Nucleic Acids Res. 42, D199–205.
Lutz, N.W., Viola, A., Malikova, I., et al., 2007. Inflammatory multiple-sclerosis plaques generate characteristic metabolic profiles in cerebrospinal fluid. PLoS One 2, e595.
Lutz, N.W., Fernandez, C., Pellissier, J.F., et al., 2013. Cerebral biochemical pathways in experimental autoimmune encephalomyelitis and adjuvant arthritis: a comparative metabolomics study. PLoS One 8, e56101.
Mangalam, A., Poisson, L., Nemutlu, E., et al., 2013. Profile of circulatory metabolites in a relapsing-remitting animal model of multiple sclerosis using global metabolomics. J. Clin. Cell Immunol. 30, 4–29.
McFarlin, D.E., Blank, S.E., Kibler, R.F., 1974. Recurrent experimental allergic en-cephalomyelitis in the Lewis Rat. J. Immunol. 113, 712–715.
Moussalieh, F.M., Elbayed, K., Chanson, J.B., et al., 2014. Serum analysis by 1H nuclear
Fig. 3. Heat map showing the levels of 26 metabolites in spinal cord in the EAE (black color, n = 29) and control (gray color, n = 28) groups. Samples and metabolites were ordered by hierarchical clustering (double classification). Each column is one sample and each line is one metabolite. The shades of red and green represent respectively high and low intensity of metabolites relative to its mean intensity (black). (For interpretation of the references to color in this figure legend, the reader is referred to the web version of this article.)
Fig. 4. Comparison of NAA levels between the EAE from the control group, in samples from lumbar/thoracic/cervical spinal cord, brain and optic nerve.*p < 0.05; **p < 0.005.
induced acute experimental allergic encephalomyelitis in Lewis rat. Magn. Reson. Med. 24, 325–334.
Noga, M.J., Dane, A., Shi, S., Attali, A., et al., 2012. Metabolomics of cerebrospinalfluid reveals changes in the central nervous system metabolism in a rat model of multiple sclerosis. Metabolomics 8, 253–263.
Pieragostino, D., D'Alessandro, M., di Loia, M., et al., 2015. An integrated metabolomics approach for the research of new cerebrospinalfluid biomarkers of multiple sclerosis. Mol. BioSyst. 11, 1563–1572.
Poisson, L.M., Suhail, H., Singh, J., et al., 2015. Untargeted plasma metabolomics iden-tifies endogeneous metabolite with drug-like properties in chronic animal model of multiple sclerosis. J. Biol. Chem. 290, 30697–30712.
Reinke, S.N., Broadhurst, D.L., Sykes, B.D., et al., 2014. Metabolomic profiling in multiple sclerosis: insights into biomarkers and pathogenesis. Mult. Scler. 20, 1396–1400.
Reitz, S.C., Hof, S.M., Fleischer, V., et al., 2016. Multi-parametric quantitative MRI of normal appearing white matter in multiple sclerosis; and the effect of disease activity on T2. Brain Imaging Behav. 11, 744–753.
Salway, Z.Z., 2014. Metabolism at A Glance, 3rd ed. Blackwell Publishing, Malden (MI).
Sinclair, A.J., Viant, M.R., Ball, A.K., et al., 2010. NMR-based metabolomics analysis of
cerebrospinalfluid and serum in neurological disease – a diagnostic tool? NMR Biomed. 23, 123–132.
Smolinska, A., Attali, A., Blanchet, L., et al., 2011. NMR and pattern recognition can distinguish neuroinflammation and peripheral inflammation. J. Proteome Res. 10, 4428–4438.
Smolinska, A., Posma, J.M., Blanchet, L., et al., 2012. Simultaneous analysis of plasma and CSF by NMR and hierarchical models fusion. Anal. Bioanal. Chem. 403, 947–959.
Villostada, P., Alonso, C., Agirrezabal, I., et al., 2017. Metabolomic signatures associated with disease severity in multiple sclerosis. Neurol. Neuroimmunol.
Neuroinflammation 4, e321.
Vingara, L.K., HJ, Yu, Wagshul, M.E., et al., 2013. Metabolomic approach to human brain spectroscopy identifies associations between clinical features and the frontal lobe metabolome in multiple sclerosis. NeuroImage 82, 586–594.
Wider, G., Dreier, L., 2006. Measuring protein concentrations by NMR spectroscopy. J. Am. Chem. Soc. 128, 2571–2576.
Wolinsky, J.S., Narayana, P.A., 2002. Magnetic resonance spectroscopy in multiple sclerosis: window into the diseased brain. Curr. Opin. Neurol. 15, 247–251.