UNEMPLOYMENT DECREASED THANKS TO CONSTRUCTION
Seyfettin Gürsel
*Gökçe Uysal
and Ayşenur Acar
Abstract
Seasonally adjusted labor market data shows that non-agricultural unemployment rate decreased from 12.5
percent to 12.1 percent (0.4 percentage points) in the period of October 2013 compared to the period of September
2013. This unexpected decline was due to the large increase in non-agricultural employment, most of which was in
the construction sector. Seasonally adjusted employment increased by 99 thousand from the period of September
2013 to the period of October 2013. Hence, unemployment rate decreased by 0.5 percentage points.
Consequently, seasonally adjusted non-agricultural unemployment rate increased from 11.4 percent in October
2013 to 11.9 percent in September 2013.
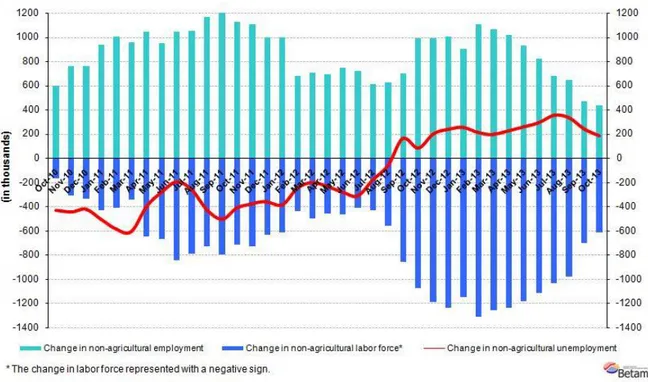
Increases in non-agricultural labor force and employment are returning to trend
According to the data released by TurkSTAT, non-agricultural labor force increased by 614 thousand (2.8 percent)
and non-agricultural employment increased by 433 thousand (2.3 percent) in the period of October 2013 (Figure 1).
Consequently, the number of persons unemployed in non-agricultural sectors increased by 181 thousand. 600
thousand increase in non-agricultural labor force is compatible with the structural trend. Similarly, 2.3 percent
increase in employment is also compatible with about 4 percent GDP growth.
Figure 1 Year-on-year changes in non-agricultural labor force, employment and unemployment
Source: TurkSTAT,Betam
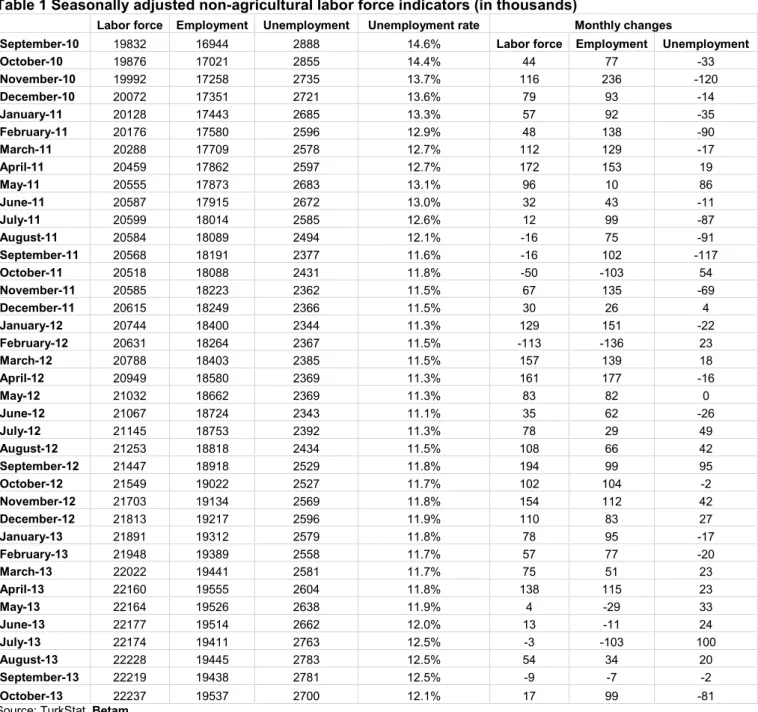
Strong increase in non-agricultural employment
According to seasonally adjusted data, non-agricultural labor force decreased by 17 thousand in the period of
October 2013 compared to the period of September 2013, and reached 22 million 237 thousand (Figure 2, Table
*Prof. Dr. Seyfettin Gürsel, Betam, Director, [email protected]
Yrd. Doç. Dr. Gökçe Uysal, Betam, Vice Director, [email protected] Ayşenur Acar, Betam, Research Assistant, [email protected]
Labor Market Outlook:
January 2014
www.betam.bahcesehir.edu.tr
2
1). Non-agricultural employment increased by 99 thousand and reached 19 million 537 thousand. Hence, the
number of persons unemployed in non-agricultural sectors decreased by 81 thousand and non-agricultural
unemployment rate decreased from 12.5 percent in the period of September 2013 to 12.1 percent in the period of
October 2013. The increase in seasonally adjusted non-agricultural employment (99 thousand) is the strongest
recorded since April 2013. 117 thousand decline in non-agricultural employment (from May 2013 to September
2013) explains the strong and rapid increase.
Figure 2 Seasonally adjusted non-agricultural labor force, employment and unemployment
Source: TurkStat,Betam
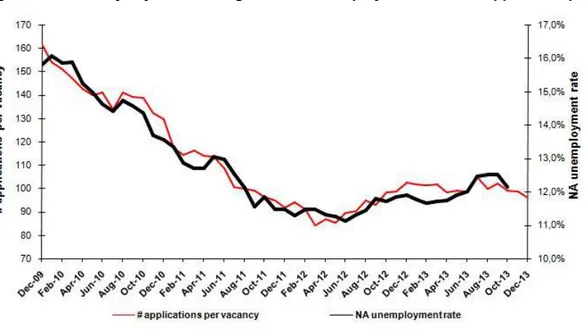
According to Kariyer.net data, non-agricultural unemployment might continue to decrease in the
next period
Seasonally adjusted application per vacancy statistics calculated using Kariyer.net
1series indicate that
non-agricultural unemployment might slightly decrease in the period of November 2013.
Figure 3 Seasonally adjusted non-agricultural unemployment rate and application per vacancy
Source: Kariyer.net, TurkStat,Betam
1 Betam has been calculating application per vacancy using series released by Kariyer.net for a while. Seasonal and calendar adjustment
procedure is applied to application per vacancy series. A decrease in applications per vacancy may be caused by an increase in vacancies or by a decrease in the number of applications. An increase in vacancies signals economic growth while decreasing number of applications indicates a decrease in number of people looking for a job.
Surprising increase in construction employment
Seasonally adjusted labor market series show that increase in construction employment that has been observed for
the last two periods continues to accelerate in the period of October 2013 (Table 2, Figure 4).
2The monthly
increase reached 94 thousand. Meanwhile the slowdown in service employment continues, i.e. service employment
increased slightly (20 thousand) in the period of October 2013. However, decline in manufacturing employment that
has been observed since the period of June 2013 continues in this period. Manufacturing employment decreased
by 15 thousand in the period of October 2013 compared to the period of September 2013. Agricultural employment
continues to decrease as well.
2Employment in each sector is seasonally adjusted separately. Hence the sum of these series may differ from the seasonally adjusted series of
www.betam.bahcesehir.edu.tr
4
Figure 4 Employment by sectors (in thousands)
3Source: TurkStat,Betam
Table 1 Seasonally adjusted non-agricultural labor force indicators (in thousands)
Labor force Employment Unemployment Unemployment rate Monthly changes
September-10 19832 16944 2888 14.6% Labor force Employment Unemployment
October-10 19876 17021 2855 14.4% 44 77 -33 November-10 19992 17258 2735 13.7% 116 236 -120 December-10 20072 17351 2721 13.6% 79 93 -14 January-11 20128 17443 2685 13.3% 57 92 -35 February-11 20176 17580 2596 12.9% 48 138 -90 March-11 20288 17709 2578 12.7% 112 129 -17 April-11 20459 17862 2597 12.7% 172 153 19 May-11 20555 17873 2683 13.1% 96 10 86 June-11 20587 17915 2672 13.0% 32 43 -11 July-11 20599 18014 2585 12.6% 12 99 -87 August-11 20584 18089 2494 12.1% -16 75 -91 September-11 20568 18191 2377 11.6% -16 102 -117 October-11 20518 18088 2431 11.8% -50 -103 54 November-11 20585 18223 2362 11.5% 67 135 -69 December-11 20615 18249 2366 11.5% 30 26 4 January-12 20744 18400 2344 11.3% 129 151 -22 February-12 20631 18264 2367 11.5% -113 -136 23 March-12 20788 18403 2385 11.5% 157 139 18 April-12 20949 18580 2369 11.3% 161 177 -16 May-12 21032 18662 2369 11.3% 83 82 0 June-12 21067 18724 2343 11.1% 35 62 -26 July-12 21145 18753 2392 11.3% 78 29 49 August-12 21253 18818 2434 11.5% 108 66 42 September-12 21447 18918 2529 11.8% 194 99 95 October-12 21549 19022 2527 11.7% 102 104 -2 November-12 21703 19134 2569 11.8% 154 112 42 December-12 21813 19217 2596 11.9% 110 83 27 January-13 21891 19312 2579 11.8% 78 95 -17 February-13 21948 19389 2558 11.7% 57 77 -20 March-13 22022 19441 2581 11.7% 75 51 23 April-13 22160 19555 2604 11.8% 138 115 23 May-13 22164 19526 2638 11.9% 4 -29 33 June-13 22177 19514 2662 12.0% 13 -11 24 July-13 22174 19411 2763 12.5% -3 -103 100 August-13 22228 19445 2783 12.5% 54 34 20 September-13 22219 19438 2781 12.5% -9 -7 -2 October-13 22237 19537 2700 12.1% 17 99 -81
6
Table 2 Seasonally adjusted employment by sector (in thousands)
Agriculture Manufacturing Construction Service Monthly changes
September-10 5648 4489 1413 11042 Agriculture Manufacturing Construction Service
October-10 5803 4498 1437 11086 155 9 24 44 November-10 5853 4667 1507 11084 50 169 69 -2 December-10 6034 4642 1563 11145 181 -25 57 61 January-11 6038 4656 1578 11209 4 14 14 64 February-11 6188 4652 1624 11304 150 -4 47 95 March-11 6199 4790 1628 11291 12 138 4 -13 April-11 6077 4828 1632 11402 -123 38 4 111 May-11 6020 4777 1652 11443 -56 -51 20 41 June-11 6092 4697 1666 11552 72 -80 14 109 July-11 6111 4710 1686 11618 19 13 20 66 August-11 6184 4682 1750 11658 72 -28 63 40 September-11 6121 4707 1755 11729 -62 25 5 71 October-11 6185 4657 1673 11757 64 -50 -82 28 November-11 6157 4700 1651 11872 -28 43 -22 114 December-11 6051 4701 1639 11909 -107 1 -12 37 January-12 6055 4685 1724 11991 4 -16 85 82 February-12 6041 4684 1585 11995 -14 -1 -139 4 March-12 6026 4721 1583 12099 -14 37 -2 104 April-12 6057 4792 1652 12136 31 71 69 37 May-12 6111 4760 1708 12194 54 -32 56 59 June-12 6051 4761 1718 12245 -60 1 10 50 July-12 6049 4778 1691 12284 -3 17 -28 40 August-12 6045 4745 1735 12339 -3 -33 44 54 September-12 6146 4735 1763 12420 100 -10 28 82 October-12 6213 4732 1777 12512 67 -3 15 92 November-12 6192 4814 1775 12545 -20 82 -2 32 December-12 6138 4856 1785 12576 -54 42 10 32 January-13 6113 4870 1849 12593 -25 14 64 17 February-13 6143 4886 1856 12647 30 16 7 54 March-13 6120 4948 1813 12680 -23 62 -44 33 April-13 6103 5030 1816 12709 -17 82 3 29 May-13 6031 5044 1722 12759 -72 14 -94 50 June-13 5973 5015 1737 12762 -58 -29 15 2 July-13 5969 4991 1657 12763 -3 -24 -81 1 August-13 5993 4964 1704 12777 24 -27 48 13 September-13 6012 4914 1747 12777 19 -50 43 0 October-13 5920 4899 1841 12797 -92 -15 94 20