264 IEEE TRANSACTIONS ON ULTRASONICS, FERROELECTRICS. AND FREQUENCY CONTROL. VOL. 36, NO. 2. MARCH 1989
Improvement
of
Anisotropy Sensitivity in the
Scanning Acoustic Microscope
ABDULLAH ATALAR
Ab.sfracr-Thr response of the conventional scanning acoustic micro- scope (SAM) to anisotropic materials is theoretically investigated. For this purpose, the reflection coefficient of plane acoustic naves incident on a liquid-solid interface is numerically calculated for a general an- isotropic solid oriented in an) arhitrar) direction. In general, the re- flection coefficient depends on polar and azimuthal angles of incidence. For the case o f a circularly symmetric acoustic microscope lens, a mean reflectance function can he defined that depends only on the polar an- gle. With this mean reflectance function it is ver) easy to predict the anisotropic material response o f the acoustic microscope. Moreover, one can explore the effects of changing lens parameters such as the acoustic fields at the back side o f the lens. It is found that under certain conditions, the amplitude response of the acoustic microscope can de- pend heavily on the orientation of the solid material under investiga- tion. The amplitude o f the acoustic microscope signal is influenced by
the orientation of the material because there is a cancellation of acous- tic rays reflected from the object surface at different azimuthal angles. This cancellation i 5 revealed as a minimum in the mean reflectance function. It is shown by numerical simulation that, the sensitivity to orientation can he increased by use of a ring-shaped insonification at the hack o f the acoustic lens. W'ith such lenses it may he possible to
determine the orientation of crystallites in a material with a high lat- eral resolution.
I . INTRODUCTION
T
HE scanning acoustic microscope (SAM) has become a useful new instrument for nondestructive testing ap- plications by its ability to penetrate optically opaque ma- terials/
l ] . It is possible to use it in characterizing the properties of materials on a microscope scale 121. Crys-talline materials such as integrated circuits and thin film structures are typically acoustically anisotropic. For such materials direction sensitive acoustic lens geometries have been utilized for characterization purposes: Kushibiki et al. 131, [4] proposed and used successfully a cylindrically focused lens to get direction sensitive information with
the complete loss of resolution in one direction. Hilde- brand and Lam [ 5 ] produced a lens with separate trans- mitter and receiver to get a partially directive geometry with a slight loss in resolution. Tan et al. [6] reported a geometry containing two or three confocal lenses, again with a sensitivity to anistropy of the materials under in- vestigation. Davids and Bertoni [ 7 ] proposed a special transducer geometry to increase the sensitivity to an-
isotropy without losing very much in the lateral resolu- Manuscript received M a y 6. 1988.
Thc author i \ with the Electrical and Electronics Engineerlng Depan- I E E E Log Number 8824738.
mcnt. P.K. 8 klalrcpe. Ankara 06572, Turkey.
tion. Khuri-Yakub and Chou [S], [9] used a shear wave transducer instead of the longitudinal transducer in the regular lens arrangement. The acoustic transmission char- acteristics of shear waves from the lens material to liquid generates a circularly asymmetrical field pattern that in turn produces a direction sensitive arrangement.
In all cases, the material dependent images as obtained from the acoustic microscope are a result of the sound wave reflection at the liquid-solid interface. The reflec- tion coefficient-both amplitude and phase-at this inter- face uniquely characterizes the material under investi- gation. To understand the images and the information they convey. a thorough understanding of reflection coefficient is necessary.
Theoretical aspects of the reflection problem for the an- isotropic solid case and some numerical calculations for special cases [IO]-[ 121 can be found in the literature. Somekh et
LII.
[l31 have studied the reflection coefficient of anisotropic materials at a liquid interface for the pur- pose of understanding acoustic images obtained by acous- tic microscopes. They have numerically calculated the re- flection coefficients for some materials and applied the results for interpretation of contrast in acoustic images. Crean and Waintal [l41 have calculated Rayleigh wave velocity on anisotropic substrates for the same purpose.In this paper, first, the results of a study on the reflec- tion and of plane acoustical waves at a liquid-aniso-
tropic-solid interface are presented. Then, the results are used to determine the response of the scanning acoustic microscope to anistropic materials. Finally, a way of im- proving the sensitivity to anisotropy is proposed.
11. RESPONSE OF T H E ACOUSTIC MICROSCOPE TO ANISOTROPIC MATERIALS
For a planar object surface placed perpendicular to the lens axis, the scanning acoustic microscope output can be expressed in its nonparaxial form as [
1.51
( 1 )
where V is the output voltage of the acoustic microscope,
K is a proportionality constant, U + is the acoustic field
A T A L A R : IMPROVEMENT OF ANISOTROPY SENSITIVITY 265
(scalar potential of the particle velocity field) at the back side of the acoustic lens, P is the pupil function of the
lens, f is the focal length of the lens, @ is the complex reflectance function at the liquid-solid interface, h is the
wavelength of acoustic waves in the liquid medium, and
Z is the distance between the focal point and the object position. This expression is valid for the most general case when the lens geometry and/or the reflectance function are not circularly symmetric. We point out that for an- isotropic materials, @ does not have circular symmetry. We also note that, the extra
41
- ( x / f ) ' - ( y / f ) ' fac- tor in the denominator of the above integral as derived by Liang er al., [l61 applies to a spherical transducer with no buffer medium. That factor cancels out with a cosine factor in the nominator for the conventional acoustic lens arrangement, so the equation above remains valid fornonparaxial cases as well. Equation (1) can be written in cylindrical coordinates as
V ( Z ) = K
if'
jr"'
[ u + ( r cos4,
Y sin + j 0 2-
P ( r cos4,
r sin 4)] sin4
exp[
-j(4rZ/X) r.
J1
- ( r / f ) ' l r d r d 4 ( 2 ) where r is radial distance, (x'+
y-) , is the azimuthal angle, tan-' ( y / x ) , and r,,, is the pupil radius. For a cir- cularly symmetric lens geometry, the functions U+and Pcan be written as functions of r only, but the I$ depen- dence of R remains. For the purposes of simplifying this integral, it is possible to define a mean reJectancefunc- tion [13],
R',
as7 l / ?
& ' (sin 6') = & ( s i n 6 cos
4,
sin 6' sin4 j
d4 ( 3 )where sin 6' = r / f . Here, R ' is a function of sin 6' only, since the
4
dependence is removed by an integration in4
direction.
Using this definition for a circularly symmetric insoni- fication and pupil function, (2) can be simplified. Com- bining (3) with ( 2 ) one can arrive at a one-dimensional
integral
&'
ainO,,, V ( Z ) = Kf'1
sin 6' [ u + ( f s i n 19) 0.
P ( f s i ne,]'
@'(sine )
where sin
e,,,
= r I I l / f .The evaluation of this integral requires the determina- tion of the mean reflectance function,
R',
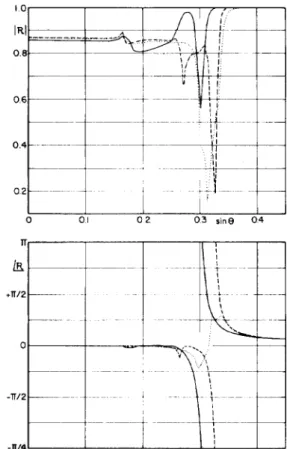
and thus @. A formulation of the reflection coefficient problem to deter-Fig. I . Mean reflection function amplitude and phase for water-silicon i n -
terfaces at carious orientations as function of sin B for ( O O l ) , (01 I ) , and
( I I I ) surfaces shown by solid. dotted, and dashed lines, respectively.
mine & for the liquid-anisotropic-solid interface can be found elsewhere [ 171. The formulation ignores acoustical attenuation and piezoelectricity of both media. The media are assumed to be of infinite extent and the interface is assumed to be an infinite plane. Due to the complexity of the expressions, an analytical solution is not possible, hence the solutions are obtained by numerical calcula- tions. The developed computer program can handle ma- terials with arbitrary stiffness matrices of 21 constants, so materials with arbitrary orientation can be handled with proper transformation of stiffness matrix by multiplication with Bond matrices [ 1 S]. The program is tested with some anisotropic materials whose reflection coefficients were
previously calculated [ 121, [ 131.
The integral in (3) must be carefully evaluated because of the complex nature of the reflectance function. Suffi- ciently many points must be included in the integral for correct results, especially for large sin 6' values. We have calculated a number of such curves for the purpose of
V ( Z ) response determination. Fig. l shows the amplitude and phase plots of R ' for water-silicon interface at prin- cipal planes of silicon. Since silicon crystal is of cubic structure, for (001) surface integration is performed for
4
between 0" and 45", for (0 11) surface between 0" and
90" and for ( 1 11) surface between 0" and 60". Notice that, amplitude curves have an unusual structure near sin 0 = 0.3. For (01 1 ) and ( 1 11) surfaces the mean reflection coefficient becomes as low as 0.2. Moreover, the phase
266 IEEE TRANSACTIONS ON ULTRASONICS, FERROELECTRICS. AND FREQUENCY CONTROL. VOL. 36. NO. 2. MARCH 1989
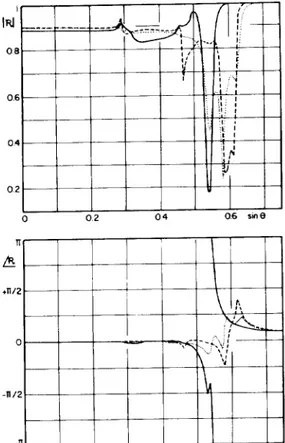
Fig. 2 . Mean reflection function amplitude and phase for water-GaAs in- terface at various orientations as function of sin e for (OOI), ( O l l ) , and ( 1 1 1 ) surfaces shown by solid, dotted, and dashed lines, respectively.
Fig. 4. Mean reflection function amplitude and phase for water-iron in- terface at various orientations as function of sin 0 for ( O O I ) , (01 I ) . and ( l 1 1 ) surfaces shown bp solid, dotted, and dashed lines. respectively.
Fig. 5. Mean reflection function amplitude and phase for water-aluminum interface at various orientations as a function of sin B for (001). (01 I ) ,
ATALAR: IMPROVEMENT OF ANISOTROPY SENSITIVITY 267 I I RI 0.8 06 0 4 0.2 0 OJ 0 2 0.3 rlne 0 4
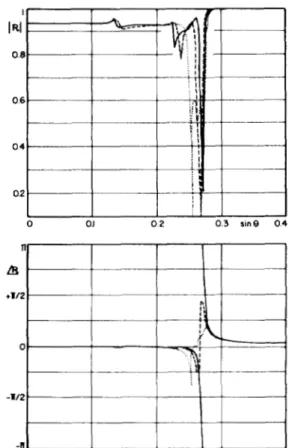
Fig. 6. Mean reflection function amplitude and phase for water-quartz in- Fig. 7 . Mean reflection function amplitude and phase for water-sapphire terface at various orientations as a function of sin 8 for ( O O l ) , (100). and interface at various orientations as a function of sin e for (001). ( I O O ) , (010) surface shown by solid, dotted, and dashed lines, respectively. and (010) surface shown by solid. dotted, and dashed lines, respectively.
curve for (01 1) surface does not have the usual 2a phase transition. Figs. 2-5 are similar presentations for water-
GaAs, -nickel, -iron, and -aluminum interfaces. Figs. 6
and 7 depict
(3'
for two trigonal crystals, quartz and sap- phire, also at the water interface for their (loo), (010) and (001) surfaces. For these calculations the integrationranges for
4
at different orientations are as follows: (001) surface between 0" and 30", (100) surface between 0" and 90" and (010) surface between 0" and 180". To test the validity of our computer program, we verified that the relation (3' = 6i holds true for isotropic solids. For an- isotropic solids the C#I step size is made successively smaller until a no significant change in (Rf is observed. Inall cases, a sin 0 step size of 0.0015, and a
4
step size of0.5" are used. Elastic constants of solids were taken from Auld [ 1 81. The constants for water are taken as follows:
c , , = 2.277 x lo9 and p = 1 . 0 x lo3 in MKS units. After inspection of these plots we make the following observations: The longitudinal wave critical angle for
which the reflections coefficient amplitude reaches one, seems to disappear. Most of the mean reflectance func- tions have significant dips in amplitude and in some cases the 2-a phase transition disappears. The dips in the curves occur near the phase transition and they are as a result of cancellation of reflected rays at different azimuthal angles after the integration operation. The cancellation is insig- nificant for isotropic or nearly isotropic materials where the phase transition occurs nearly at the same 0 for differ- ent
4
values. Recall that, the angular position of the phasetransition is related to the Rayleigh wave velocity, and
that for isotropic materials Rayleigh wave velocity is the same for all directions. But for anisotropic materials the phase transition occurs at different 0 values for different
4
values, because the Rayleigh wave velocity varies as a function of direction. When the acoustic rays at these an- gles are vectorially added, there is a cancellation. We must point out that our calculated curves for (Rf do not agree with Figs. 8- 10 of Somekh et a i . [ 131 although the curves for 6i are in perfect agreement with their Fig. 4. The dis- crepancy between the results may be explained by insuf- ficient sampling in their integration computations [ 191.We recall that the interference effect, which gives rise to material dependence of V ( 2 ) curves, occurs between the central rays and the rays near the phase transition an- gle [20]. For most anisotropic materials we observe that the amplitude of the rays near transition angle is consid- erably reduced because of the cancellation effect men- tioned above. For a number of cases, the 2-7r phase tran- sition does not exist at all. Hence, the nulls and peaks of
V ( Z ) will not be very deep and for such materials the sensitivity to material parameters will be small.
Once
03'
is found, the integral of (4) is relatively easy to calculate. The functions U + and P are determined fromthe lens parameters. Typically one uses transducer sizes which will minimize the diffraction loss in the buffer rod to maximize the signal-to-noise ratio (SNR) of the acous- tic microscope system. As an example we consider a lens with cavity radius of 105 pm, a pupil radius of 75 pm,
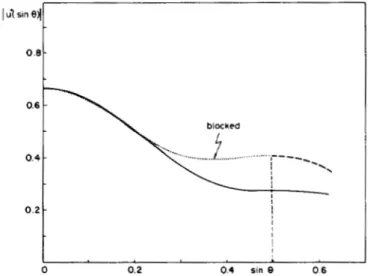
Fig. 8 . lnsonification functions used i n computations. Solid curve: de-
signed to minimize diffraction l o s s ( ( 1 , = 100 p m , = 75 p m , cf = Fig. 10. Calculated
v ( z )
cuneh for(001), (01 l ) , and ( l l l ) faces o f nickel10'00 pm, X = I O . I p m ) . Dashed curve: designed to improve sensitivity to anisotropy ((I, = 120 pm. u2 = 75 pm, bz = 60 pm, d = I140 pm, X = 10. 1 p m ) . Dotted curve: blocked pari
shown by solid, dotted, and dashed lines, respectively
1 -15 -10 -5 0 5 IO Fig. 1 1 . Calculated V ( Z ) curves for (001). (01 l ) . and ( I I I ) faces of iron Z(pm) shown by solid, dotted, and dashed lines, respectively. Fig. 9. Calculated V ( Z ) curves for (001). (01 l ) , and ( I I I ) faces of gal-
lium arsenide. shown by solid. dotted. and dashed lines, respectively.
placed at a sapphire buffer rod length of 1000 pm and used at a frequency of 1100 MHz. The optimum transducer radius turns out to be 100 pm. The solid curve in Fig. 8 shows the plot of
I
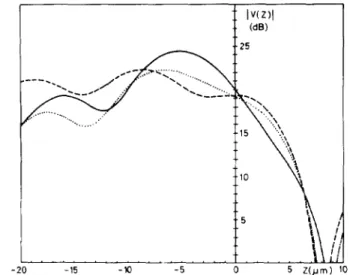
U +1
for this case. The pupil function,P , includes the effect of the antireflection layer on the lens surface whose thickness may vary because of the depo- sition procedure. The results of calculations for gallium arsenide crystal at various orientations with this lens are shown in Fig. 9. V ( 2 ) curve for the (001) surface can be directly compared with the measurement results [ 151, and it is in good agreement. Notice that, the V ( Z ) curves fail to have a rich structure usually observed with isotropic materials. Nevertheless, the difference between the curves
are appreciable when Z is made sufficiently negative, i.e., 0
-
I5 -10 - 5 0 5 Z(ym) IOI . . . . . .
. . .
when the Object surface is brought closer to the lens than FIE. I ? . Calculated V ( Z ) curves for ( O O I ) , ( O l l ) , and ( I 1 l ) faces o f alu- the focal distance. Figs. 10-12 are similar. presentations minum shown by solid. dotted, and dashed lines. respectively.
A T A L A R : I M P R O V E M E N T OF ANISOTROPY SENSITIVITY 269
for nickel, iron and aluminum crystals. The curves there also show that deep nulls and sharp peaks which normally give rise to the high contrast in acoustic images are miss- ing. Apparently,
4
dependent Rayleigh wave velocity washed out the conventional V ( Z ) effect after the inte- gration operation. To get a contrast between different crystallographic planes of the same material, object must be in an out-of-focus position in the negative 2 direction.The inversion of V ( 2 ) has been used to characterize
materials [ 161. It is possible to obtain the reflectance func- tion from the measured V ( Z ) by proper transformations. If this technique is applied to anisotropic materials, the result will be the mean reflectance function defined above.
111. INCREASING T H E SENSITIVITY TO ANISOTROPY As mentioned above, the well-known interference
mechanism, which is responsible for the material depen- dence of V ( Z ) curves, is not particularly successful for anisotropic materials. We must try to find another mech- anism to enhance the sensitivity to anisotropy. Inspection of Figs. 1-7 may suggest a way to get an increase in con- trast between the surfaces of the same material with dif- ferent crystallographic orientation. Comparison of the
amplitude curves indicate that the reflection coefficients around zero degree do not differ considerably. Use of
these reflected rays as a reference is not helpful, since the conventional V ( Z ) interference mechanism does not work very well. Hence, there is no sense in wasting power for rays near normal incidence. On the other hand. at higher angle values and especially around the phase transition there is more difference. This difference can be empha- sized, if power can be concentrated in this region and if only those angles can be excited. Such an insonification can be achieved through an annular type excitation. Ni- koonahad et a1 [21] used an acoustic lens with a suitable transducer to exclude some excitation angles for provid- ing Rayleigh wave suppression. Our proposal here is just the opposite. The central rays are to be suppressed to in- crease sensitivity to anisotropy. Note that, providing an
annular transducer does not guarantee that excitation U +
will be annular. Diffraction effects are not at all negligible when it is considered that at typical operating frequencies the wavelength is comparable to the size of the trans-
ducer.
A . Annular Excitation
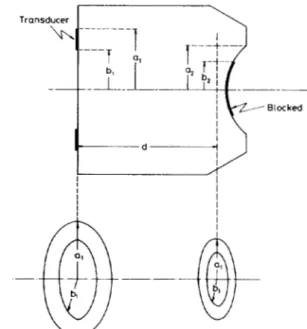
Achieving an annular insonification is possible easily if the transducer is deposited directly on the curved surface of lens in the desired pattern. For small lenses this may create technological problems. In this case, the annular transducer must be deposited on the opposite and flat sur- face of the buffer rod at a distance from the lens (Fig. 13). For such a geometry the diffraction loss may be quite high if no optimization is made. Minimization of diffraction loss is important for maximizing the SNR of the acoustic microscope. For this purpose we refer to (4) and use it for a perfect reflector as the object
(a'
= 1 ), Assuming thatTransducer
Fig. 13. Geometry used in calculating diffraction l o s s between two-ring shaped transducers separated by distance.
the functions U + and P are purely real (uniform phase),
we find the maximum received signal. at Z = 0 as V,,,, = V ( 0 ) ( n c , = , =
Kf'
1
sin B [ u f ( f s i n 19)sin O,,,
0
P ( f s i n 0)12 d(sin 0 ) .
Using the Cauchy-Schwartz inequality we can convert the integral on the right to
.
P(f
sine ) ]
d( sine )
( 5 )where the equality is satisfied if U+ and P are constant
(uniform insonification). The integral inside the square
sign of ( 5 ) is proportional to the voltage generated by a fictitious transducer whose shape is defined by the pupil function P , when it is insonified by the field U + generated
by the transducer of the acoustic lens. Hence, minimizing the diffraction loss between these two transducers will help us achieve our goal of maximizing the SNR. The square operation in ( 5 ) signifies the two-way propagation of the acoustic waves. Hence, to calculate the diffraction loss encountered in the proposed geometry for annular exci- tation, we may instead calculate the diffraction loss be- tween the two transducers. Doubling the loss in decibels for such a geometry will approximately give us the re- quired diffraction loss in a pessimistic sense. The approx- imation involved here gets better, as the insonification function U + becomes more uniform that is usually a de-
sired property for a high resolution performance. As de- picted in Fig. 13, the ring shaped receiving transducer simulates the lens surface that is suitably blocked for cen- tral rays.
270 IEEE TRANSACTIONS ON ULTRASONICS. FERROELECTRICS, AND FREQUENCY CONTROL, VOL. 36. N O . 2 , MARCH 1989
We now turn to calculation of diffraction loss between two ring shaped transducers. An analytical expression for the diffraction loss between two circular transducers was given earlier [22]. The transmission coefficient, F, be- tween two circular longitudinal wave transducers that are located coaxially and facing each other at a distance d can be written to a very good approximation as
( 6 ) where j i n c ( x ) = J , ( T X ) / ~ X , J , is the first order Bessel
function of the first kind, a l and a? are the radii of the two circular transducers, ko is the wavenumber and b is the
anisotropy factor in the propagation medium between them. The anisotropy factor is defined by Waterman 1231 along or close to pure mode directions and it provides a simple but approximate method of computing diffraction in anisotropic media. The integral in (6) can be easily evaluated when it is converted into a Fourier transform:
rect ( k / k ,
-
1 / 2 )1
I( 7 )
r = d
where rect ( x ) = 1 for
1
xI
5 and 0 otherwise.Using this result, one can express the diffraction loss between two ring shaped transducers as follows. Suppose that the two ring transducers have outer radii a , and a 2 ,
inner radii b , and b2, respectively (See Fig. 13). By prin-
ciple of superposition, the ring transducers can be ex- pressed as the difference of two circular transducers. Tak- ing care of constant factors properly, the transmission
coefficient between the two transducers,
rr,
is 1r,(d) = { a l a * r ( a l , 0 2 , d )
J(a; - b:f ( U ; - b$
+
h,b,I'(b,, b z , d )-
a , b J ' ( a , , b2: d )- a 2 b 1 r ( a 2 , h,, d l } ( 8 )
We can now relate the maximum received signal to the transmission coefficient as V,,, oc
r;
( d>.
First, we kept the size of the transducers the same, i.e. a , = a2 and h , = b2 and made a number of calculations for different values of a , and b , . It was seen that the curves corresponding to different values of a l and b l are barely
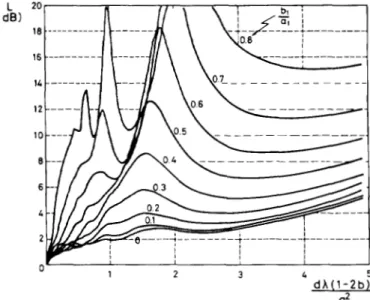
( d B ) L I I I d h ( 1 - 2 b ) 5 1 2 3 4 a:
Fig. 14. Diffraction loss between two equal size annular transducers with inner radius b , and outer radius U , as function of separation d between them where h is wavelength in medium and h is anisotropy factor.
distinguishable from each other as long as bl /al ratio re- mains the same. This simplifies the presentation of re- sults. One set of curves is applicable to almost all cases. Fig. 14 is a plot of one-way diffraction loss ( L = -20 log
1 1
) as a function of distance ( d ) between the trans- ducers. Inner radius of the annulus is the parameter in the plot. The horizontal axis is normalized with respect toa : / X ( 1 - 2 b ) , where X is the wavelength in the propa- gation medium. The vertical axis is normalized such that at d = 0 the diffraction loss is zero. The curves shown are for a l = 20X, but they are nearly independent of the value of a , except when a , is very small. We have used a
16 384-point fast Fourier transform (FFT) in calculating the given curves.
Inspection of Fig. 14 shows that the diffraction loss is quite high in the Fresnel region of the transducer where the acoustic energy tends to collect around the symmetry axis. The minimum diffraction loss occurs at d h ( 1 -
2b)/a: = 1 . 1 f o r b , / a , = 0.6, at 1.2 a t b , / a l = 0.7 and
at 1.3 for b , / a , = 0.8, with corresponding diffraction losses of 6 . 4 , 8.0 and 10.2 dB. As the ring gets thinner, the loss increases. Since we have to double this value to find the two-way loss, the only acceptable solution is in the very near field of the transducer. For example, a ring ( b l / a , = 0 .7 ) of radius 10 X would result in a one-way diffraction loss of less than 2 dB as long as the rod length is less than 10 X. This may be acoeptable at low frequen- cies (10-MHz range) where the wavelength is long, but at high frequencies (1-GHz range) the resulting buffer rod length is too short to be realizable.
At high frequencies, the near field solution is not prac- tical. We should try to find an acceptable solution in the Fresnel region. Numerical experimentation with various sizes of rings has shown that choosing equal size trans- ducers is not at all-to our surprise-the optimum solution in the Fresnel region. Unequal ring sizes gave lower dif-
A T A L A R : I M P R O V E M E N T OF ANISOTROPY SENSITIVITY
TABLE I
h f l N l M C M D I F F K A C I ' I O \ LOSS GEOMETRIES FOR R I N G S H A P E D IUSONIFICATIOU
Optimum Transducer Size and One-way Loss
k z./ a , / a 2 h l a z d X ( 1 - 2b)/a: Loss (dB) 0.5 I .43 0.0 I .53 3.80 0.5 0.833 0.0 2.33 4.34 0 . 6 I .43 0 . 0 I .63 4.69 0.6 0.714 0.0 2.09 0.7 I .54 0.0 I .89 5.93 5.29 0.7 0.588 0.0 I .80 6.53 0 . 8 I .60 0.0 2.05 7.76 0 . 8 0.50 0 . 0 1.60 8.28 0.9 I .66 0.0 2.22 10.9 0.9 0.435 0 . 0 1.46 11.33
fraction loss values compared to the equal size case. In fact, when one of the transducers is a complete circular transducer, the diffraction loss becomes minimum. Table I summarizes the optimum transducer sizes we found for various b 2 / a 2 ratios. Two sets of transducer sizes are
given for every b 2 / a 2 ratio. One set is for a l
>
a2 and the other is for U ,<
a2. It is seen that a significant im- provement in diffraction loss over Fig. 14 is possible with use of these values. Therefore, Fig. 14 should be used as a design aid at low frequencies, and Table I should be consulted at high frequencies.When the acoustic lens surface is acting as the receiver transducer, the central portions will unavoidably get in- sonified. To correct the situation, the central portions of the acoustic lens surface may be coated by an absorber material or the antireflection layers may be etched away in this region. We have to note that, a ring shaped inson- ification will reduce the resolution slightly, because the side lobe level at the focal plane will rise.
B. V ( Z ) Curves with Annular Excitation
We will now consider a lens with annular excitation to prove the improvement in sensitivity to anisotropy. To be able to make a comparison we use the same frequency ( l 100 MHz) and the same lens size (cavity radius 105 pm, pupil radius 75 pm) as above; but we block the central portion of the lens pupil up to the radius 60 pm ( b 2 / a 2 =
0.8 ) . Using Table I, the optimum transducer radius and buffer rod length are found to be 120 pm, 1140 pm, re- spectively, resulting in a two-way diffraction loss of about
15 dB, at worst. The insonification function
I
U +1
of(4)
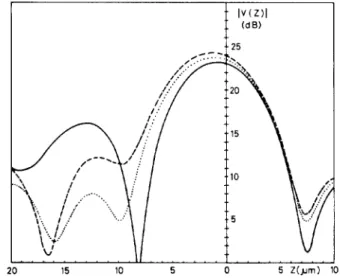
for this case is shown in Fig. 8 as dashed lines. Dotted lines in the same figure represent the acoustic field pattern that is blocked. Fig. 15 depicts calculated V ( Z ) curves
for GaAs at various orientations with this annular exci- tation. Comparing this figure with Fig. 9 we first note a reduction in the signal level that is due to the extra dif-
fraction loss. But more importantly, the difference be- tween the curves corresponding to different orientations increases. Notice also that the difference is significant even at Z = 0. Hence, grain structure of materials can be
observed also at Z = 0 without losing resolution. A sim-
27 1
-20 -I5 -10 -5 0 5 Z(pm) 10
Fig. 15. Calculated V ( Z J curves for (001). (01 I ) , and ( I I I ) faces of gal- lium arsenide with center blocked lens, shown by solid, dotted. and dashed lines, respectively.
l
Fig. 16. Calculated V ( Z ) curves for ( O O I ) , (01 11, and ( I I l ) faces of
nickel, shown by solid, dotted, and dashed lines, respectively. with cen- ter blocked lens.
ilar comparison can be made between Figs. I O and 16 for the case of nickel. Figs. 17 and 18 are corresponding cal- culation results for iron and aluminum. In all cases, an improvement in sensitivity to anisotropy is obtained, with an SNR sacrifice of about 12 dB. We also point out that the use of ring insonification, not only increased the an- isotropy sensitivity, but also the material dependence. For example, iron and nickel are hardly differentiated in Figs.
10 and 11, whereas they are significantly different in Figs.
16 and 17.
It is possible to increase the sensitivity even further. if narrower excitation can be used. But, this is rather diffi- cult because of diffraction effects in the buffer rod. With a very narrow ring type transducer, the buffer rod length should be also very small. Such thin lenses are very dif- ficult to manufacture and they will be very fragile. More- over, a narrow excitation would reduce the applicability of the lens to different materials.
272 IEEE TRANSACTIONS ON ULTRASONICS. FERROELECTRICS. AND FREQUENCY CONTROL. VOL. 36. NO. 2, MARCH 1989
::
IV(Z)I .. ( d B )-20 -15 -10 - 5 0 5 ZOJrn) 10
Fig. 17. Calculated V ( Z ) curves for ( O O I ) , (01 l ) . and ( 1 I I ) faces of iron. shown by solid, dotted. and dashed lines. respectively. with center
blocked lens.
Fig. 18. Calculated V ( Z ) curves for ( O O I ) , (01 I ) , and ( I I I ) faces ofalu- minum. shown by solid. dotted. and dashed lines, respectively, wlth center blocked lens.
The approach of Kushibiki er al. gives the highest sen-
sitivity to anisotropy and it is possible to get quantitative information such as surface-wave velocity, but the result- ing instrument is not suitable for imaging purposes. The special two-transducer geometry used by Hildebrand and Lam and also by Tan er a l . requires special and difficult
to manufacture lenses. Since these lenses have separate input and output, they are not directly compatible with the conventional SAMs. The shear wave transducer arrange- ment used by Khuri-Yakub and Chou has the required characteristics in terms of compatibility with existing sys- tems and high resolution. However, there will be a con- siderable reflection loss at the lens liquid interface reduc- ing the S N R . Moreover, the spherical aberration in the lens will be higher than the regular lens, because shear waves have lower velocity than the longitudinal waves.
The reflection configuration proposed in this paper to increase sensitivity to anisotropy is relatively simple, di-
rectly compatible with existing systems and the loss in resolution is small. But, there is not an easy way to extract quantitative information about object parameters.
IV. CONCLUSION
The reflection coefficient of plane acoustic waves at the liquid-solid interface is the most important factor for the material dependent response of the SAM. For an aniso- tropic solid. the reflection coefficient is a complex func- tion of polar and azimuthal angles of incidence. For cir- cularly symmetric geometries, a mean reflectance function can be defined which is obtained by integrating the reflec- tion coefficient in the azimuthal direction, and thus it de- pends on polar angle only. The mean reflectance function for most anisotropic materials has a dip around the phase transition angle, because of a cancellation resulting from the direction dependence of the Rayleigh wave velocity. After determination of this function for a given aniso- tropic material, it is a simple matter to compute the re- sponse of an acoustic microscope to that material. We
have presented the response of the acoustic microscope to some common anisotropic crystals at their principal
planes. The dip of the mean reflectance function near the phase transition reduces the effectiveness of the usual in- terference mechanism of V ( Z ) curves. It was seen that a small difference in response exists between different crys- tallographic surfaces of the same material, provided that the object surface is closer to the lens than the focal length. With such curves, the grain contrast in acoustic images of polycrystalline materials can be predicted.
We have also shown that it is possible to increase the sensitivity of the scanning acoustic microscope to an- isotropy by blocking the central portions of the lens cav- ity. We have presented the calculated response of such an acoustic lens for the same materials to make a compari- son. It was seen that the difference in response between different crystalographic planes is enhanced.
We determined the optimal transducer geometry for
minimizing the diffraction loss for an annular excitation. At low frequencies, where the lens can be placed in the near field of the transducer, use of a ring shaped trans- ducer gives the lowest diffraction loss. On the other hand, at high frequencies, where the lens can be placed no closer than the Fresnel region, a full circular transducer insoni- fying a central blocked lens results i n the lowest loss. In return for an increased anisotropy sensitivity, some SNR must be sacrificed.
ACKNOWLEDGMENT
The author would like to thank Orhan Arlkan and Emre Telatar for the development of the reflection coefficient program at the liquid-anisotropic-solid interface.
REFERENCES
[ l ] N . J . Bunon, “NDT applications o f scanning acoustic microscopy,” I E E Proc.. vol. 134. no. 3 , pt. A . Mar. 1987. pp. 283-289.
121 S . A Hildebrand. K . Liang. and S . D. Bcnnett, “Fouricr-transt’ol.111 approach to material characterization with the acoustic microscope."
ATALAR: IMPROVEMENT OF ANISOTROPY SENSITIVITY 273
131 J . Kushibiki. A. Ohkuho, and N. Chubachi, “Anisotropy detection
in sapphire by acoustic microscope using line-focus beam.” Elecfron.
141 J . Kushibiki and N . Chubachi. “Material characterization by line- L P / ~ . . vol. 17, pp. 534-536, July 1981.
focus-beam acoustic microscope.” IEEE Trcrns. S o n i c s U/~~US(JII., vol. SU-32. no. 2 . pp. 189-212. Mar. 1985.
151 J . A. Hildebrand and L. K . Lam, “Directional acoustic microscopy forobservation ofelastic anisotropy.” Appl. Phys. Left.
.
vol. 42, n o .S . p p . 413-415. Mar. 1983.
161 M . R. T. Tan, H . L. Ransom Jr.. C. C. Cutler. and M . Chodorow. “Oblique, offspecular, linear, and nonlinear observations with a scanning micron wavelength acoustic microscope.” J. ,4pp/. P h y s . ,
v o l . 57. no. I I , pp. 4931-4935. June 1985.
171 D. A. Davids and H. L . Bertoni, “Bow-tie transducers for meajure- ment of anisotropic materials i n acoustic microscopy,” in Proc. U / -
rrmon. Symp., Williamsburg, V A . 1986, pp. 735-740.
[ X ] B. T. Khuri-Yakub and C-H. Chou. “Acoustic microscope lenses with shear wave transducers,” i n Proc. IEEE Ulfrc2son. Symp., 1986, pp. 741-744.
191 C-H. Chou, B. T . Khuri-Yakub and K. K. Liang, “Acoustic micros- copy with shear wave transducers,” in Proc. lEEE L‘lrrason. Symp.. 1987. pp. 813-816.
1 I O ] G . L. Jones and E . G . Henneke 11, “Reflection of stress waves at a free boundary i n quartz single crystals,” IEEE Truns. Sonics L’lrrcr-
.s’m. vol. SU-20. no. 3. pp. 267-274, July 1973.
1 I I] E. G. Henneke I1 and G . L . Jones. ”Critical angle for reflection at a liquid-solid interface i n single crystals,” J . A m u s r . Soc. A n , . , vol.
59. no. l . pp. 204-205, Jan. 1976.
1121 A . Atalar, “Reflection of ultrasonic waves at a liquid-cubic-solid i n - terface,” J . A c o u s f . Soc. A r n . , vol. 73, no. 2 , pp. 435-440. Feb.
1983.
1131 M . G . Somekh, G . A. D. Briggs, and C . Ilett, “The effect of elastic aniwtropy on contrast i n the scanning acoustic microscope.” Philo-
.\ophiccr/ Magu:inu A , vol. 49, no. 2, pp. 179-204, 1984.
1141 G . M . Crean and A . Waintal. “Average Rayleigh-wave velocity of a
computer simulated crystallographic plane,” J . A p p l . Crysf., vol. 19,
1151 A . Atalar, “ A n angular spectrum approach to 01 Ttrast In reflection
acoustic microscopy.” J . Appl. P h y s . , vol. 49. no. 10. pp. 5130- 5139. Oct. 1978.
[ 161 K . K. Liang, G . S. Kino and B. T . Khuri-Yakub, ”Material charac- terization by the inversion of V ( Z ) , ” IEEE Trctrls. Sonics Ultrrtsotr..
[l71 0 . Arikan, E. Telatar, and A. Atalar, “Reflection coefficient n u l l of vol. SU-32. no. 2 , pp. 213-224. Mar. 1985.
acoustic waves at a liquid-anisotropic-solid interface.” J. AcorrAr. Sor.
A m . , Dec. 1988. pp. 181-187. 1986.
[IS] B. A. Auld, Acousric Fields rrr~rl W N W S irr S ~ l i d . \ . Vols. 1 and 2 .
1191 M . G . Somekh, private communication.
[ZO] W . Parmon and H . L. Bertoni. “Ray interprctatlon 01‘ the material
signature in the acoustic microscope.” Electrorl. L p f t . . vol. 15. no.
2 1 . pp. 684-686, Oct. 1979.
(211 M. Nikoonahad. P . Sivaprakasapillai. and E. A. .4sh, “Rayleigh ~ a v e suppression in reflectmn acoustlc microscopy,” Elccfron. Lvrr., v o l .
19, no. 22. pp. 906-908, Oct. 1983.
(221 A. Atalar, “A fast method of calculating diffraction loss hetwecn two facing transducers.“ lEEE T~UIIS. Ultrasou. Ferroelec. Freq. C o M r . .
vol. 35, no. S. pp. 612-618. Sept. 1988.
1231 P. C . Waternman. “Orientation dependence of elastic waves in single crystals,” Phys. R e i , . . vol. 113. no. 5 . pp, 1240-1253. 1959. New York: Wiley-lnterscience. 1973.
hbdullah Atalar was born in Gazlantep, Turkey.
i n 1954. He received the B . S . degree in 1974 from
Middle East Technical University, Ankara, T u r - key. and the M . S . and Ph.D. degrees i n l976 and 1978, respectively, from Stanford University.
Stanford, CA, all in electrical engineering. HIS thesis work was on reflection acoustic micros- copy
He was first a Post Doctoral Fellow from 1978
to 1980 and later an Engineering Research As\()-
ciate at Stanford University. where he continued his work on acoustic microscopy. For eight months he wah with Hcwlett Packard Labs, Palo Alto, CA. engaged in photoacoustics research. He joined the Middle East Technical University in 1980 as an Assistant Pro-
fessor. While on leave from the University from 1982 to 1983. he was with Ernst Leitz Wetzlar, Wetzlar, West Germany, where he was involved in the development of the commercial acoustic microscope. He is presently an Associate Professor and chairman of the Electrical and Electronics En- gineering Department at Bilkcnt University. His current research interests include acoustic imaging. linear acoustics, and computer-aided design in Electrical Engineering.
Dr. Atalar was given the H . Tu& Foundation Award of TUBITAK. Turkey in 1984 for his contributions to acoustic microscopy.