Fit Among Business Strategy, Strategy
Formality, and Dynamic Capability
Development in New Product Development
Lale Gumusluoglu
1and Nuran Acur
2,31Faculty of Business Administration, Bilkent University, Ankara, Turkey 2Faculty of Business, Ozyegin University, Istanbul,
3Turkey and University of Strathclyde, Glasgow, UK
Taking new product development (NPD) as the unit of analysis, this study, based on strategic fit approach, investigates the effects of NPD strategy formality and dynamic capabilities (sensing, seizing, and reconfiguring) on NPD performance for different business strategy types (prospectors, analyzers, defenders). The sample of the study includes 203 companies from nine countries: Australia, Denmark, Finland, Norway, the Netherlands, Slovakia, Portugal, Spain, and Turkey. The study finds that a formal NPD strategy is an important driver of NPD performance for all companies regardless of the strategy pursued. Of the dynamic capabilities, sensing capabilities have significant performance effects for all strategy types. Seizing capabilities have stronger effect on NPD performance for prospectors and analyzers, than for defenders while reconfiguring capabilities is a driver of performance only for defenders. Furthermore, dynamic capabilities explain NPD performance above and beyond strategizing, irrespective of the strategy pursued.
Keywords: NPD strategy formality; dynamic capabilities; business strategy; NPD performance
Introduction
With the growing level of competition across industries, dynamic capability development in new product devel-opment (NPD) has been at the heart of product competition for more than a decade (e.g., Brown and Eisenhardt, 1995; Deeds et al., 1999; Marsh and Stock, 2003; Prieto et al., 2009). Dynamic capabilities consist of ‘specific strategic and organizational processes that create value for firms within dynamic markets by manipulating resources into new value-creating strat-egies’ (Eisenhardt and Martin, 2000: 1106). Dynamic capability literature claims that a firm’s competitive advantage is informed by its business strategy that exploits its assets, resources and competences in a sys-tematic way (O’Connor, 2008). Accordingly, dynamic capabilities are about a firm’s ability to acquire, inte-grate, and adapt its skills and resources to the rapidly changing environment (Teece et al., 1997; Teece, 2007; Wu, 2007; Easterby-Smith and Prieto, 2008). Firms differ considerably in their efforts to develop business
strategies and dynamic capabilities in product competi-tion, which can yield a range of diverse performance affects (e.g., Day, 1994; Eisenhardt and Martin, 2000). Yet despite the theoretical and managerial importance of this issue, researchers know little about how different capabilities should be organized for NPD in firms with different business strategies. Furthermore, the ability to generate new products is also suggested to be dependent on a clearly defined strategy (i.e., NPD strategy formal-ity) (Cooper et al., 2004). In this vein, our research ques-tion is: How can NPD strategy formality and dynamic capabilities lead to superior NPD performance for firms with different business strategies?
Examining this complicated theoretical and mana-gerial problem raises two significant challenges. First, the development of dynamic capabilities and business strategies are each viewed as multidimensional phenom-ena involving many different but related issues. Yet strat-egy scholars frame the relationships between these phenomena in holistic terms as the role of dynamic capabilities in implementing business strategy. Put dif-ferently, how well a firm implements a business strategy is influenced by how well it adapts its products, pro-cesses, and organizational routines (i.e., dynamic capa-bilities) to the requirements of its environment. Teece Correspondence: Lale Gumusluoglu, Faculty of Business
Administra-tion, Bilkent University, 06800 Bilkent Ankara Turkey. Tel: 90-312-2902319; Fax: 90-312-2664958; E-mail: [email protected] DOI: 10.1111/emre.12070
et al. (1997) suggest that, in dynamic environments,
firms should not only have strong resources (resource-based view; RBV), they must also have strong organizational routines for developing and renewing those resources and organizational capabilities, specifi-cally, sensing, seizing, and reconfiguring capabilities. While all companies have to develop these three com-ponents of dynamic capabilities to adapt to the rapidly changing environment, the ability to do so ‘is not uni-formly distributed amongst enterprises’ (Teece, 2007: 1323). Accordingly, the extent to which firms might develop each of these capabilities is dependent on many factors such as their strategies, structures, established capabilities, complementary assets, and administrative routines. For example, leader companies might invest heavily in identifying market opportunities to maintain their leadership positions, while others might emphasize reconfiguring their existing competences to address the needs of their current customers.
Successfully organizing dynamic capabilities for dif-ferent business strategies involves resolving multiple and conflicting strategic possibilities to match environ-mental changes. Scholars suggest that various dimen-sions of dynamic capabilities can be assessed in terms of their ‘fitness’ (Matsuno and Mentzer, 2000; Augier and Teece, 2007; Teece, 2007). Accordingly, the business strategy pursued by a firm influences the relative empha-sis it might put on capability development (McKee et al., 1989; Zhou and Li, 2010). The alignment of dynamic capabilities with a firm’s strategy and environment is the basis of this contingency approach to strategy (McKee
et al., 1989; Di Benedetto and Song, 2003; Song et al.,
2007; Zhou and Li, 2010). Although strategic manage-ment scholars state that a firm has competitive advantage in NPD when its dynamic capabilities fit its business strategy (Di Benedetto and Song, 2003; Harreld et al., 2007), the wide range of possible levels of fitness makes the identification of ‘correct’ configurations of dynamic capabilities needed for a particular business strategy dif-ficult and complex. Therefore, the first challenge that strategy and NPD scholars face lies in assessing how the different components of dynamic capabilities can be organized to enable the implementation of particular business strategies in product competition. Hence, we suggest that for different business strategies, different components of dynamic capabilities (i.e., sensing, seizing, and reconfiguring) are more important for their effects on NPD performance.
In a similar vein, we suggest that the extent to which firms formalize their NPD strategies is dependent on their business strategy. Although several studies suggest that firms need clearly defined strategies on which to focus their efforts and allocate resources, and a plan for carrying out their goals (Cooper et al., 2004), previous research yielded inconsistent findings about the strategy formality-performance link. Hence, we introduce
business strategy as a contingency factor in this link and suggest that the extent to which NPD strategy formality influences NPD performance is dependent on business strategy.
The second problem area in the strategy domain relates with whether competitive advantage stems from investing in dynamic capability development, rather than in strategy formalization. Hence, scholars point out that dynamic capabilities can affect performance above and beyond strategizing. While in general strat-egies are outward-looking, since they are a result of managerial responses to external environmental condi-tions (Fiegenbaum and Thomas, 2004; Veliyath and Shortell, 1993), dynamic capabilities are inward-looking and focus on how to integrate and rejuvenate a firm’s resources (Zhou and Li, 2010). Accordingly, Teece et al. (1997: 509) state that ‘[i]dentifying new opportunities and organizing effectively and efficiently to embrace them are generally more fundamental to private wealth creation than is strategizing.’ Based on these observations, this study aims to co-examine the effects of dynamic capabilities and NPD strategy for-mality on NPD performance.
The purpose of this paper, therefore, is to investigate how business strategy, NPD strategy formality and dynamic capabilities engage, if at all, to affect NPD performance. To this end, we explore the impact of NPD strategy formality and dynamic capabilities on NPD success. As noted previously, we focus on the three core components of dynamic capability (e.g., sensing, seizing, and reconfiguring capabilities) to examine this relationship because the extent to which firms focus on these components depends on their business strategy (Teece, 2007). We examine each component for their relationships to different business strategies based on the Miles and Snow (1978) typology (prospectors, analyzers and defenders) and examine their individual influences on NPD performance. Here, Miles and Snow’s (1978) typology provides a way to conceptualize the major decisions that companies must make when they seek to fit their strategy formalization and dynamic capability development activities with their business strategies. In summary, we present a framework that synthesizes the knowledge in strategy formalization and dynamic capa-bility development in the context of NPD and business strategy literature to understand their links to NPD per-formance. We also take environmental characteristics into account to identify the contingencies for our study. Our study makes four contributions. First, we fill a major knowledge gap by providing empirical support for theorized links between dynamic capability, business strategy, and NPD performance. This helps managers understand how to organize and develop dynamic capa-bilities to meet the implementation requirements of dif-ferent business strategies and why this is important in driving NPD performance. Second, our study examines
the effects of NPD strategy formality on NPD perfor-mance for prospectors, analyzers, and defenders. While several studies show that the existence of a formal strat-egy is important for company performance (e.g., Brews and Hunt, 1999; Acur et al., 2012), we do not know how it impacts NPD performance for firms pursuing different business strategies. Third, despite accumulating research on the topic, few studies explore dynamic capabilities in an NPD context (e.g., Deeds et al., 1999; Marsh and Stock, 2003; Prieto et al., 2009). Examining dynamic capabilities in NPD is equally noteworthy because they enable adaptation to the environmental requirements which in turn foster NPD performance. Fourth, from a theoretical standpoint, by co-examining the performance effects of NPD strategy formalization and dynamic capability development, the study provides insights about whether dynamic capabilities can affect perfor-mance above and beyond strategizing in an NPD context. Such knowledge may be especially important for management resource allocation decisions.
Theoretical background
Firms differ considerably in their efforts in developing strategies and dynamic capabilities in product competi-tion, which may cause different performance affects (e.g., Day, 1994; Eisenhardt and Martin, 2000). Studies rooted in strategic fit approach indicate that a firm’s business strategy influences the relative emphasis it puts on capability development; in other words, dynamic capabilities should be organized in ways that enable implementation of a particular business strategy (McKee
et al., 1989; Di Benedetto and Song, 2003; Song et al.,
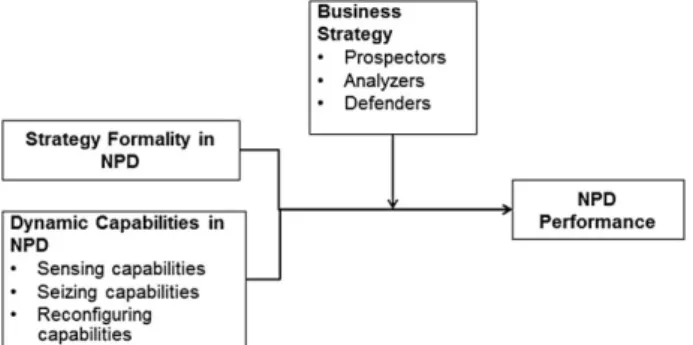
2007; Teece et al., 1997; Zhou and Li, 2010). Based on the strategic fit approach, which is generally accepted as necessary for business success (Augier and Teece, 2007; Matsuno and Mentzer, 2000; Teece, 2007), the study offers a model in an NPD setting and tests it for Miles and Snow’s (1978) business strategy typology. Hence, in Figure 1, we combine insights from the strategy formali-zation, dynamic capabilities, and NPD literatures to
develop a conceptual model that examines the relation-ships between NPD strategy formality, dynamic capabil-ities in NPD, and NPD performance for different types of business strategies. We specifically examine (1) the effects of NPD strategy formality and dynamic capabil-ities (sensing, seizing, and reconfiguring) on perfor-mance by taking the NPD function as the unit of analysis and (2) how the above relationships will vary for pro-spectors, analyzers, and defenders. Four factors (envi-ronmental hostility, and dynamism, firm size, and age) are used as control variables.
Business strategy
Because the present study focuses on NPD, we use Miles and Snow’s (1978) typology, which focuses on intended rate of product-market change as compared to Porter’s (1980) typology which focuses on customers and competitors (Hambrick, 2003). Previous research widely embraced Miles and Snow’s (1978) typology and attributed the typology’s excellence to its innate parsi-mony, industry-independent nature and to its corre-spondence with the actual strategic postures of firms across multiple industries and countries (Hambrick, 2003). Notably, in line with many previous studies which used Miles and Snow’s typology (e.g., Shoham
et al., 2002), the study’s hypotheses do not include
reac-tors, the fourth type of business strategy. As also sug-gested by Miles et al. (1978), because reactors do not have a consistent strategy-structure relationship and are not able to respond to their environmental changes effec-tively, this strategy type is not sustainable.
According to Miles et al. (1978), strategy is the pattern of decisions by which a company aligns itself with its environment. This ‘adaptive cycle’ comprises three stages: managing products and markets (the entre-preneurial problem); designing a system for producing and distributing products (the engineering problem); and developing organizational structures and processes to support the entrepreneurial and engineering decisions (the administrative problem). The three problems essen-tially concern a firm’s positioning in the environment, its technology, and organizational design, respectively. Miles and Snow’s (1978) strategic business types have their own way of solving the above problems. Several studies (e.g., Hambrick, 1983; Shoham et al., 2002) show that these strategy types differ in their performance objectives. Prospectors move quickly to take advantage of opportunities in the marketplace through new prod-ucts, new markets, and new technologies. Defenders have a stable set of products and customers, and aggres-sively maintain their domain. Analyzers are a hybrid of prospectors and defenders; they focus on imitating the leaders (prospectors) in their industry, learn from the leaders’ experiences, and develop improved products quicker and/or more efficiently. Analyzers are not first
movers, but explore developments in line with market opportunities and product policies, prepare an adaptive mechanism for turbulent markets, and pursue efficiency in the stable markets they serve. Notably, firms pursuing different strategies may operate in the same industry; for example, in a rapidly changing market, prospectors may rely on leadership in NPD while defenders may seek to reduce risk exposure by heavily defending their posi-tions (Desarbo et al., 2005).
NPD strategy formality and business strategy
A formal NPD strategy involves clear product concept statements, target markets, and a systematic project port-folio management (Cooper and Kleinschmidt, 1995). In other words, a firm’s NPD strategy describes what the firm desires to achieve from its new products and pro-vides strategic direction for its NPD activities (Brews and Hunt, 1999) by planning the role and goals of and allocating adequate resources to that function (Brown and Eisenhardt, 1995). This paper, then, defines NPD strategy formality as the degree to which a firm identifies a formal NPD strategy that clearly defines NPD goals, strategic arenas, or areas of focus, and the degree to which that strategy includes a formal portfolio manage-ment system to select projects and allocate developmanage-ment resources to them.
Scholars acknowledge the importance of having a clear, well-defined NPD strategy formality backed up by detailed action plans to new product success (e.g., Brown and Eisenhardt, 1995; Cooper and Kleinschmidt, 1995; Calantone et al., 2003; Acur et al., 2012). Cooper
et al. (2004) identify a strong formal NPD strategy as a
best practice. However, previous research yielded incon-sistent findings about performance – strategy formality link. For example, Mintzberg (1990) asserts that the pre-determined and inflexible paths introduced by formal strategies create resistance to change. Con-versely, Acur et al. (2012) claim that a formal NPD strategy can improve communication, increase integra-tion, and reduce potential conflicts between NPD and marketing. Several studies show that formal strategies have positive influences on firm performance in unstable or dynamic environments (e.g., Priem et al., 1995), while others find that they are best suited to stable envi-ronments (e.g., Fredrickson and Mitchell, 1984). Based on an analysis of 656 firms, Brews and Hunt (1999) suggest that in unstable environments, firms should have specific but flexible plans and must be prepared to rework and change plans incrementally as implementa-tion proceeds. That is, strategies are not always intended, but may emerge as organizations learn about their task-environments. From the above observations, this paper introduces business strategy as a contingency factor and argues that the performance effects of strategy formality will vary according to a firm’s business strategy.
Miles et al. (1978) claim that prospectors conduct broad rather than intensive planning in their organic structures, characterized by low degrees of formalization and high degrees of decentralization. In a similar vein, Mintzberg et al. (1998) argue that prospectors should have clear vision and mission statements but flexible strategies so they can respond first to environmental changes. Supporting these conventions, Veliyath and Shortell (1993) and Slater et al. (2006) show that pro-spectors’ performance is harmed by high levels of strat-egy formalization. While these studies examined the effects of strategy formality on the company-level per-formance of prospectors, we expect similar perper-formance effects of NPD strategy formality at the NPD-level as well. Prospectors aim to be the market leader by finding and developing new products or technologies. These firms avoid long-term commitments to a single type of a product or technology; rather, they create multiple, pro-totypical offerings (Miles and Snow, 1978). Hence, a formally stated NPD strategy may bring rigidity into prospectors’ entrepreneurial behavior. Entrepreneurs not only adapt but also shape their environments (Teece, 2007). Through introducing brand new products and technologies, prospector companies shape opportunities in the market. In constantly searching for opportunities, these companies may rely less on formal NPD strategies and more on emergent strategies that give them the flexi-bility to not only exploit the existing opportunities but also develop new ones and enhance their NPD perfor-mance. Hence, we propose that the presence of a formal NPD strategy will have weaker effects on the NPD success of the companies pursuing a leader strategy as compared to those with other than leader strategies.
Shortell and Zajac (1990) report that analyzers score significantly higher on strategy formalization. These companies cautiously follow prospectors into new product-market domains and seek efficiency in their more-stable markets. To deploy their resources effec-tively among this dual set of intentions and achieve equilibrium between the conflicting demands for flexi-bility and staflexi-bility, these firms are expected to set prior-ities for their markets and formalize their strategies accordingly. Miles and Snow (1978) suggest that analyzers use some form of matrix structure where func-tion managers unite with product managers to form a balanced coalition. Consequently, intensive planning between the functional areas concerning the stable domain and comprehensive planning among the func-tional and product divisions concerning new products and markets may be more appropriate for these compa-nies. In these companies, a formal NPD strategy may ensure that NPD efforts receive sufficient resources and can help reduce conflict among stakeholders within the firm (Parry et al., 2009).
Defenders maintain a relatively stable domain by pro-ducing goods or services as efficiently as possible. These
firms have centralized and mechanistic organizations where coordination is achieved through formal rules and procedures. To ensure efficiency, defenders rely on intensive cost-oriented planning (Miles et al., 1978). Veliyath and Shortell (1993) and Mintzberg et al. (1998) suggest that tightly coupled and centrally controlled firms tend to set more formalized, deliberate, and agreed-upon strategies and goals. Indeed, Slater et al. (2006) report that formal strategies have positive rela-tionships with performance in defender companies. More importantly, the authors show that this process has the greatest effect on performance among defenders seeking low costs than among other business types. A formal NPD strategy and set of goals may enable defenders follow a clearly articulated sequence of steps in NPD which will in turn increase efficiency and also decrease operational uncertainty in this unit. From the above observations, we hypothesize that a formal NPD strategy will be a stronger driver for NPD performance for defenders and analyzers, than for prospectors.
Hypothesis 1. A formal NPD strategy will have a stronger positive effect on NPD performance for analyzers and defenders, than for prospectors.
Dynamic capabilities in NPD
Capabilities are ‘complex bundles of skills and accumu-lated knowledge, exercised through organizational pro-cesses that enable firms to coordinate activities and make use of their assets’(Day, 1994: 38). Accordingly, dynamic capabilities concern a firm’s ability to acquire, integrate, and adapt its skills and resources to a rapidly changing environment (Teece et al., 1997; Teece, 2007; Wu, 2007; Easterby-Smith and Prieto, 2008). These abilities are rooted in a firm’s organizational and knowledge pro-cesses, through which resources are obtained, combined, and deployed (Zollo and Winter, 2002) and enable the firm to achieve greater innovation and better organizational performance (Kyrgidou and Spyropoulou, 2012). For this reason, NPD is proposed as an ideal frame for development of dynamic capabilities (Eisenhardt and Martin, 2000; Prieto et al., 2009). To clarify the concept of dynamic capabilities, the current literature differenti-ates between operational (zero-order) and dynamic (first-order) capabilities (Zollo and Winter, 2002; Winter, 2003). The former include activities related to a firm’s operational functioning, while the latter facilitate sensing new opportunities, creating new asset combinations, and building new capabilities to match new market needs (Cepeda and Vera, 2007; Zahra et al., 2006). Building on these perspectives, this paper cites dynamic capabilities as a firm’s higher-order capabilities (sensing, seizing, and reconfiguring), which bring about new combinations of resources and operational routines to address environ-mental changes. While many factors affect a firm’s ability
to develop dynamic capabilities, this paper’s theoretical discussion is rooted in Teece’s (2007) three components of dynamic capability development: (1) sensing capabil-ities; (2) seizing capabilcapabil-ities; and (3) reconfiguring capabilities.
Sensing capabilities (identifying and integrating opportunities) require firms to continuously scan, search, and explore markets and technologies (Teece, 2007). Sensing new opportunities not only involves investment in in-house R&D, it also involves external search which embraces potential collaborators such as customers, suppliers and universities. In an NPD context, building sensing capabilities requires firms to identify and exploit internal and external sources of new product/process ideas (e.g., suppliers, competitors, cus-tomers) as well as to integrate existing knowledge with external knowledge (e.g., interpreting and internalizing past NPD projects, as per Marsh and Stock, 2003). Seizing capabilities (building competences) ‘involves maintaining and improving technological competences and complementary assets and then, when the opportu-nity is ripe, investing heavily in the particular technol-ogies and designs most likely to achieve marketplace acceptance’ (Teece, 2007: 1326). Competence is ‘an ability to accomplish something by using a set of material (e.g., equipment, machinery, mailing lists) and immaterial resources (e.g., manufacturing know-how, an understanding of customer needs)’ (Danneels, 2002: 1102). As such, seizing capabilities comprise building and improving competences and deploying (e.g., learning capabilities) resources from internal and exter-nal sources. Reconfiguring capabilities (reconfiguring competences) is ‘the firm’s ability to sense the need to reconfigure its asset structure and to accomplish the necessary internal and external transformation’ (Teece
et al., 1997: 520). In an NPD context, reconfiguration
concerns a firm’s ability to change the patterns of pre-viously utilized processes to enhance the development of existing products or its ability to develop new products (Zollo and Winter, 2002; Cepeda and Vera, 2007). Hence, reconfiguration might take the form of adjusting existing NPD processes to future time, cost, and process requirements. While reconfiguring, companies can also leverage their complementary assets and capabilities to dynamically revive themselves, such as in the case of Nintendo, who relied on its software-driven mindset to produce novelty in its hardware development process (Subramanian et al., 2011).
Sensing capabilities and business strategy
Because competitive advantage is often short-lived in dynamic markets, continually searching for opportunities is a critical dynamic capability for firms in such markets, who often compete by creating a series of temporary advantages rather than by building a long-term position in
a specific product or technology. Hence, ‘their strategic logic is opportunity’ (Eisenhardt and Martin, 2000: 1117); they achieve strategic advantage by identifying opportunities and integrating them into their internal activities and technologies. Opportunities may also reside in their existing knowledge base and experiences. Prospectors are technologically innovative, ready to pursue and accept state-of-the-art technologies, consist-ently first in adopting new ideas, and show greater risk-taking behavior than defenders and analyzers (Miles and Snow, 1978; Hambrick, 1983; Shortell and Zajac, 1990). These firms owing to their decentralized organizations with great local autonomy are more likely to spot market and technological opportunities (Teece et al., 1997). Because prospectors deal with time-based competition and aim to produce products of great variety with state-of-the-art technologies and design very quickly, they have a high level of entrepreneurial orientation; continu-ally hunting for external and internal opportunities (i.e., technological, design, market, and product opportu-nities) ahead of their competitors and exploiting them to maintain their reputations as innovators. Such continu-ous monitoring of the external environment enables such firms to not only spot opportunities that will better suit the needs of the markets but also helps them avoid over-reliance on past practices (Kyrgidou and Spyropoulou, 2012). Teece (2007) notes that good entrepreneurial management is needed to sense and seize opportunities. This attribute stems not only from prospectors’ domain knowledge but also from their high proactivity and inte-gration skills. These firms use an open-minded inquiry process, where they actively and systematically scan the environment for changes and unexploited opportunities (Day, 1994). Hence, prospectors continuously (re)create their own markets by rapid product innovations. For instance, 3M incorporates solutions to unarticulated cus-tomer needs for new products by working closely with lead users (customers who recognize a need before the majority of the market).
Defenders have a narrow product-market domain and therefore often ignore developments outside of it (Miles
et al., 1978). These firms, also due to their centralized
organizations are more likely to be blindsided by market and technological opportunities (Teece et al., 1997). They mostly focus on producing and distributing their goods/services as efficiently as possible, investing a great deal of resources in solving problems, for example, by process reengineering (Miles et al., 1978). Defenders are thus expected to emphasize reconfiguring capabil-ities more than sensing and seizing capabilcapabil-ities. Analyzers share characteristics with prospectors and defenders. They aim to integrate products developed by prospectors. As they try to more cheaply produce the best products developed by the prospectors, they are expected to put less emphasis on scanning technological or market trends but instead have a close eye on the
products of prospectors which have a proven success in the market. Based on the above observations, this paper expects that of the three strategic types studied, sensing capabilities would be most important to prospectors for enhancing their NPD performance as compared to analyzers and defenders.
Hypothesis 2. Sensing capabilities will have a stronger positive effect on NPD performance for pro-spectors, than for analyzers and defenders.
Seizing capabilities and business strategy
Competences can be enhanced through developing new ideas or exploring new technological developments by tapping into internal (e.g., manufacturing department, marketing department.) or external sources (e.g., collabo-rations, partnerships). Acquiring such resources is a nec-essary but not sufficient condition for firm success; learning across individuals, groups, and organizational boundaries must also occur for such competences to become dynamic capabilities (Cepeda and Vera, 2007; Easterby-Smith and Prieto, 2008). That is, knowledge must be transferred throughout the organization, inte-grated with other knowledge areas, and applied to a new product or process because solutions to NPD problems may reside in different functional or organizational units (Schulze and Brojerdi, 2012; Kessler et al., 2000). Through absorptive capacity – ‘the ability of a firm to evaluate and assimilate external knowledge’ (Cohen and Levinthal, 1990: 128) – firms absorb and integrate new knowledge into their domains, which over time enhances their dynamic capabilities, and in turn their NPD capa-bilities (Deeds et al., 1999). Creating a shared under-standing of internal and external knowledge through market communication systems, technology assessments and benchmarking in the organization fosters the new knowledge creation needed for NPD (Dougherty et al., 2000).
Prospectors would not only be expected to sense opportunities in the market but also to build relevant competences to address those opportunities (Conant
et al., 1990). To maintain their leadership positions, it is
equally important for these firms to build and deploy distinctive resources faster than others. Indeed, innova-tive firms have been shown to possess significantly higher resource allocation and learning capabilities than conservative firms (Yam et al., 2004). It is especially critical for prospector firms to build a learning organi-zation and culture supportive of innovation. Siguaw
et al. (2006: 563) state that ‘[a]n innovation-oriented
firm encourages and facilitates knowledge transfer across and within subunits to retain diversity of views and fosters cooperative beliefs and understandings among all functional areas to direct them toward inno-vation.’ Song et al. (2008) report that prospectors have
greater IT capabilities than analyzers and defenders, which allow them to facilitate the intra-organizational communication flow and cross-functional integration needed for learning capabilities.
Analyzers try to improve their technological competences and complementary assets while retaining a base of traditional segments and competences. Hence, similar to prospectors, these firms need to build competences to respond to new customer preferences and similar to defenders, they need to reconfigure their existing competences to better address the needs of current customers. These firms are thus likely to develop learning systems that facilitate distributing and sharing new information across functional boundaries. Defend-ers, with their emphasis on operational efficiency and protecting their mature market positions, are generally less focused on building new competences as compared to prospectors and analyzers. Even if these companies sense a business opportunity, they may be less willing to seize it due to their bureaucratic and administrative rou-tines which reinforce risk aversion and status quo orien-tation. Furthermore, their mechanistic organizations and slow decision-making processes (Miles et al., 1978) may become obstacles in seizing opportunities in the NPD unit since seizing capabilities can be used effec-tively if data is collected and disseminated throughout the organization in a timely manner. Hence, we argue that, unlike prospectors and analyzers, seizing capabil-ities will be less important for the NPD performance for these companies.
Hypothesis 3. Seizing capabilities will have a stronger positive effect on NPD performance for pro-spectors and analyzers, than for defenders.
Reconfiguring capabilities and business strategy
Reconfiguring capabilities refers to a firm’s ability to enhance, combine, protect, and adjust its intangible and tangible assets (Teece, 2007). Those capabilities include modifying existing systems and aligning the organiza-tion with its technologies, processes, strategy, and envi-ronment. Contingency theories hypothesize that such consistency is required for a company to be most effec-tive (e.g., Mintzberg, 1990). Similarly, Koufteros et al. (2002) suggest that companies need to fit their product development function to the industry to enhance their competitiveness.
Defenders mainly focus on better penetrating markets and improving their products (Dvir et al., 1993). These firms offer a limited range of products and protect their niche by offering lower prices or higher quality and better service than their competitors. Defenders must determine how to achieve strict control of the organiza-tion to ensure efficiency, hence, their strategy is charac-terised by tight cost control (e.g., adjusting NPD
processes to future cost requirements). Therefore, it is really important for these companies to enhance their adaptive capabilities and decrease their costs. In other words, reconfiguring capabilities is a major driver for them in enhancing their NPD performance.
Analyzers, who follow a hybrid strategy, face con-flicting goals of flexibility and efficiency. To respond to changing customer preferences, they not only need to invest in the necessary resources to develop appropriate new products, but also refine their production processes to match those new needs (Poulis and Jackson, 2010; Zhou and Li, 2010), that is, build and reconfigure competences to improve performance. For example, these firms rapidly adapt new product designs to fit their existing stable technologies (Miles et al., 1978). Pro-spectors’ interests lie in actively exploiting new product/ technology opportunities in order to bring about brand new products with the latest designs and technologies (Walker and Ruekert, 1987). Although these companies also reconfigure their systems / production technologies and processes (e.g., reprogramming the robots, new tooling, reeducating their employees, etc.) to address existing demands to some extent, given their ambition for the brandnew products and technologies, they will benefit the least from reconfiguring capabilities for the development and performance of their new products in the market.
Hypothesis 4. Reconfiguring capabilities will have a stronger positive effect on NPD performance for defenders and analyzers, than for prospectors.
Research methodology
Research designThe data in this study were drawn from the international ‘Patterns in NPD’ survey, which was designed to collect information about NPD practices and performance. In the present study, data collected from nine countries is used: Denmark, Australia, Finland, Norway, the Nether-lands, Slovakia, Portugal, Spain, and Turkey. The sam-pling frame consisted of 4,527 randomly selected firms from all nonservice firms listed in the European data-bases EPO, Nnerhverv, Voitto, FME, Chamber of Com-merce, Diagnose and DUNS. A pre-survey telephone inquiry was made to all 4,410 firms to verify the suit-ability of the company in terms of number of full-time-equivalent (FTE) product development employees in the NPD function and for requesting preapproval of partici-pation. The study’s sampling frame consists of 1,597 suitable companies which were independent firms and strategic business units of large firms with at least five or more FTE product development employees. Of these 1,597, companies, 445 firms agreed to participate and
provided a contact person. The surveys were adminis-tered separately by research coordinators in each of the countries, and data were pooled in a common database. For Portugal, Turkey, Spain, and Slovakia the question-naire was translated by native speakers, and translated back by other native speakers. For the other countries, an English version of the questionnaire was used.
In administering the final survey, the total design method for survey research was followed (Dillman, 2000). The first mailing package included a personalized letter, the survey, and a priority postage-paid envelope with an individually typed return address label. The survey was sent to 445 firms that agreed to participate. The contact person was asked to distribute the survey to the NPD or R&D manager of the company who has been involved in developing new products or has knowledge of new product programs in his/her organization.
To increase the response rate, four follow-up mailings to the companies were sent. One week after the mailing, a follow-up letter was sent. Two weeks after the first follow-up, a second package with same content as the first package was sent to all nonresponding companies. After two additional follow-up letters, questionnaires were collected from 203 companies, representing a response rate of 45% (203/445).
Measures
Multi-item scales were developed based on the literature on NPD and strategic management. When existing scales were unavailable, new scales and measures were developed. To develop reflective scales, the framework proposed by Churchill (1979) was used. Constructs were defined, an item pool was generated, and the measure-ment format was decided on. A list of potentially useful measures was developed from the literature. The initial item tool was reviewed by a number of experts in aca-demia and industry. On the basis of this review, some statements were dropped, and a few were modified.
Items adapted from Cooper and Kleinschmidt’s (1995) and Cooper et al.’s (2004) best-practices scales measure NPD strategy formality. Respondents indicated their level of agreement with each statement on a scale from 1 (‘strongly disagree’) to 7 (‘strongly agree’). Sample items included: ‘There is a formally stated NPD strategy,’ ‘We have clearly defined goals for all our indi-vidual new products,’ and ‘The project portfolios are aligned with the business strategy.’ This construct is validated by Kandemir and Acur (2012), who used the same database (AVE= 58.9%; HSV = 22%; CR = 0.80). Regarding dynamic capabilities, respondents indi-cated the extent to which their NPD unit achieves objec-tives of identifying opportunities, building competences, and reconfiguring competences on a scale of 1 (‘not at all achieved’) to 7 (‘very well achieved’). Six items meas-ured sensing capabilities, of which two concerned new
product-market options (adapted from Johnson et al., 2003), three concerned windows of opportunity (from De Brentani and Kleinschmidt, 2004), and one concerned proactive market orientation (from Narver et al., 2004). Sample items included: ‘Our current development proj-ects include new product-market options,’ ‘NPD is suc-cessful in opening new markets to our organization,’ and ‘We incorporate solutions to unarticulated customer needs in our new products.’ Using the same database, Kandemir and Acur (2012) validated the measure of sensing capabilities, which they labeled as ‘windows of opportunity’ (AVE= 49.8%; HSV = 26%; CR = 0.80).
Seizing capabilities is measured by six items, four of which concerned the ability to acquire resources (ideas and technologies) from internal and external sources (adapted from Kessler et al., 2000) and two the ability to deploy resources (Yam et al., 2004). Sample items included: ‘We built upon manufacturing competences for the exploitation of new technological developments’ and ‘We can pass lessons learned across organizational boundaries.’ Using the same database, Acur et al. (2010) validated this measure, which they labeled as ‘compe-tence development’ (AVE= 67.2%; HSV = 33.0%; CR= 0.90).
Reconfiguring capabilities is measured by six items, one of which concerned anticipating total time (Griffin, 1997), two of which concerned firms’ ability to adjust the speed (Griffin and Page, 1993), and three the ability to adjust the productivity and flexibility of NPD pro-cesses to future requirements (Clark and Wheelwright, 1993; Thomke, 1997). Sample items included: ‘We are able to adjust our NPD process to future time requirements,’ ‘We are able to adjust our development process to future cost requirements,’ and ‘We are able to adjust the average time of product redesign to future requirements’.
A six-item scale measured NPD performance, con-cerning four items (customer satisfaction, timeliness, cost, and quality of new products) adapted from Chiesa
et al. (1996) and two items (sales/returns from new
products) from De Brentani and Kleinschmidt (2004). This measure reflects product concept effectiveness in terms of ‘fits with market demands’ or ‘market accept-ance of the new product’ (see the meta review about product development by Brown and Eisenhardt, 1995) as well as the financial performance of the new product. Sample items included: ‘Our new products meet cus-tomer requirements,’ ‘The impact of our NPD program on our sales level is positive,’ and ‘We get good returns from our NPD program relative to our spending on it.’ The seven-point scale for the capabilities measure was also used for this performance measure.
To determine the business strategy companies pursued, respondents read four texts each describing a strategy type (from Snow and Hrebiniak’s 1980 definitions), and via a self-typed paragraph identified the
strategy that most closely described their business unit’s approach. Many studies validate this measurement method (e.g., Conant et al., 1990; Shortell and Zajac, 1990). Based on the responses, the sample included 80 prospectors, 97 analyzers, 26 defenders, and six reac-tors. Because the study is not interested in reactors, those six companies were removed from further analysis. Respondents next identified the portion of innovative products in their total sales, determining the percentages of annual sales of four types of products: breakthrough new products, next-generation new products, additions to the product family and/or derivatives/enhancements, and non-modified products introduced in the last three years. This question functioned as a proxy for the type of strategy and was used to verify the answers subjectively provided by the respondents.
Based on the responses, the authors defined prospec-tors as respondents whose sales portfolio consists of more than 60% breakthrough innovations and next-generation new products (i.e., a high sales percentage of radical innovations). Defenders’ sales portfolios consist of more than 60% non-modified products and additions to the product family and/or derivatives/enhancements (i.e., a high sales percentage of existing products). Analyzers’ sales from breakthrough innovations and next generation new products range between 40% and 60% (Laugen et al., 2006). If inconsistency between two classification criteria occurred, the percentage distribu-tion of the company’s total NPD activities accounted for by each of the four product categories (included in the questionnaire) functioned as an additional criterion. Accordingly, the authors labeled 58 companies as pro-spectors, 119 as analyzers, and 26 as defenders for analysis purposes.
The market environment directly impacts new product performance and the strategy-performance relationship (McKee et al., 1989; Gatignon and Xuereb, 1997). Accordingly, this study controls for environmental hos-tility and dynamism, measuring two items for the former and three items for the latter (Bantel, 1998). Sample items for each included: ‘The environment is risky; one false step can mean my organization’s undoing’ and
‘Our organization must frequently change its practices to keep up with the market and competitors.’ Respond-ents were asked to answer these questions on a seven-point scale (1: ‘not at all’ to 7: ‘very much’). Similarly, firm size (measured by the number of full-time employees) and firm age (in terms of years) are con-trolled. When industry and country dummies were included with the other independent variables of the study, the results revealed non-significant findings. Therefore, they are not included in further analyses.
Results
Descriptive statistics
The authors used a database comprising 203 companies in Denmark (26), the Netherlands (46), Finland (13), Australia (19), Norway (8), Spain (18), Portugal (11), Slovakia (13), and Turkey (49). Company distribution regarding strategy and country shows that all countries but Spain, Norway, and Finland house all three strategy types. In all countries except Portugal and Slovakia, more than half of the firms pursue the analyzer strategy. Only 2% of the companies were pursuing reactor strategy, supporting the contention by Miles et al. (1978) that reactor method is not sustainable. Of these six reactors, which were excluded from the study, two were from Denmark, two from Turkey, one from Australia and one from the Netherlands. Company distribution regarding strategy and industry for 194 firms (down from 203 due to missing sector data) shows that the majority operate in the ICT (34), automotive (26), medical devices (26), elec-tronics (20), telecommunications (18), and food (18) industries. The majority of prospectors operate in ICT (11), automotive (9), and telecommunications (8); the majority of analyzers in ICT (18), medical devices (17), and electronics (14); and the majority of defenders in ICT (5), automotive (4), medical devices (4), and food (4).
Tables 1, 2, and 3 show the means, standard devia-tions, and zero-order correlations among the variables for each strategy group respectively. Table 4 show the
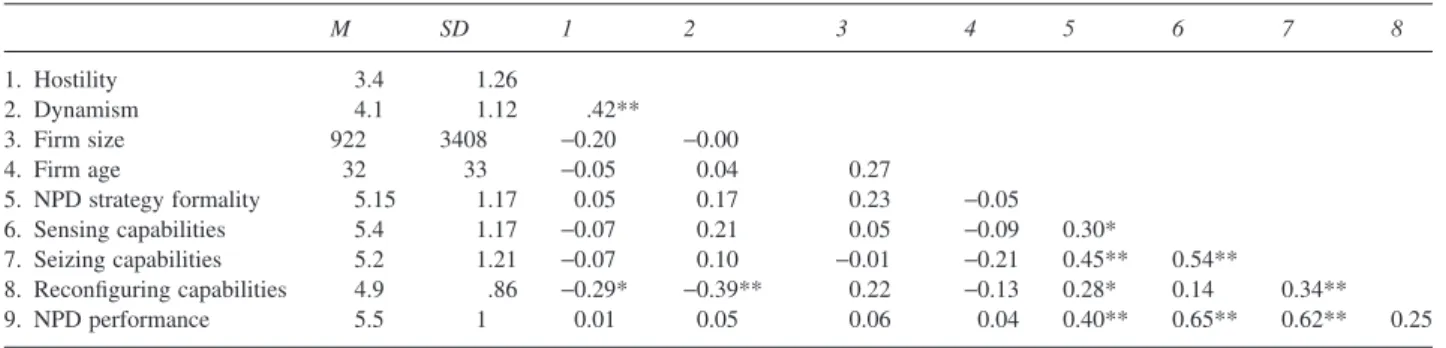
Table 1 Means, standard deviations, and zero-order correlations for prospectors
M SD 1 2 3 4 5 6 7 8 1. Hostility 3.4 1.26 2. Dynamism 4.1 1.12 .42** 3. Firm size 922 3408 −0.20 −0.00 4. Firm age 32 33 −0.05 0.04 0.27 5. NPD strategy formality 5.15 1.17 0.05 0.17 0.23 −0.05 6. Sensing capabilities 5.4 1.17 −0.07 0.21 0.05 −0.09 0.30* 7. Seizing capabilities 5.2 1.21 −0.07 0.10 −0.01 −0.21 0.45** 0.54** 8. Reconfiguring capabilities 4.9 .86 −0.29* −0.39** 0.22 −0.13 0.28* 0.14 0.34** 9. NPD performance 5.5 1 0.01 0.05 0.06 0.04 0.40** 0.65** 0.62** 0.25 *p< 0.05, **p < 0.01.
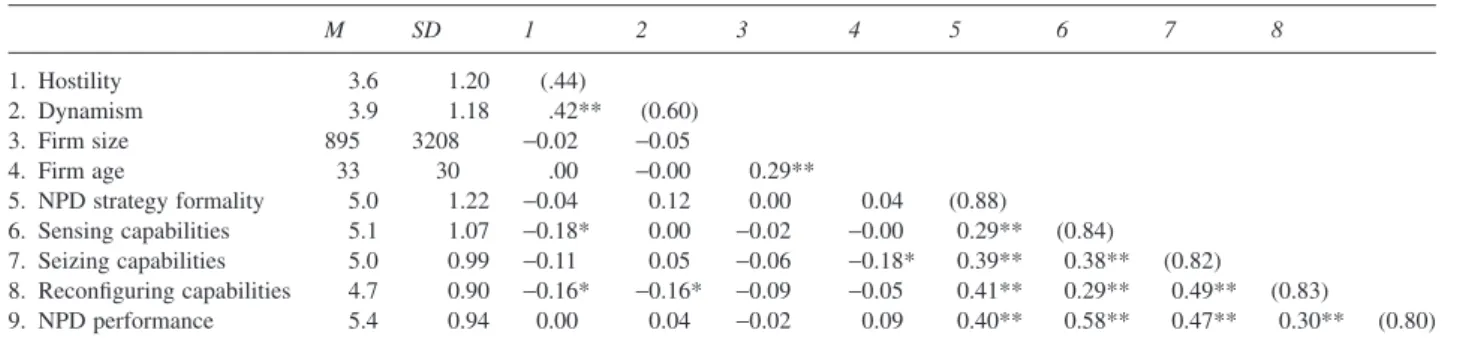
means, standard deviations, and zero-order correlations among the variables for the whole sample. Accordingly, components of dynamic capabilities (sensing, seizing, reconfiguring) show moderate relationships with each other, ranging between 0.29 and 0.49. (p< 0.01). More importantly, NPD strategy formality and dynamic capa-bilities both have moderate relationships with NPD per-formance; 0.40 for the former and ranging between 0.30 and 0.58 for the latter (p< 0.01).
Preliminary analyses
The authors used multi-item scales for each construct in this study, and prior to creating the final scales, checked
the data for normality and outliers. Several methods refined the measures and assessed their construct valid-ity. First, the authors ran exploratory analyses for the dynamic capabilities scale, which resulted in theoreti-cally predicted factor solutions. They conducted factor analysis with a varimax rotation for 18 items represent-ing dynamic capabilities. The explained variances by the first factor (reconfiguring capabilities), second factor (seizing capabilities), and third factor (sensing capabil-ities) resulted in 35.25%, 19.92%, and 16.93%, respec-tively. The total variance explained by these three factors resulted in 72.10%. Second, the authors ran reliability analyses (Cronbach’s alpha) for all constructs, which were all above the accepted level of 0.70 (except for
Table 2 Means, standard deviations, and zero-order correlations for analyzers
M SD 1 2 3 4 5 6 7 8 1. Hostility 3.5 1.18 2. Dynamism 3.7 1.23 0.40** 3. Firm size 889 3286 0.16 −0.00 4. Firm age 33 33.8 0.01 −0.04 0.29** 5. NPD strategy formality 5.03 1.19 −0.04 0.11 −0.11 0.06 6. Sensing capabilities 5.05 0.98 −0.20* −0.10 −0.09 0.06 0.22* 7. Seizing capabilities 4.92 0.90 −0.13 −0.00 −0.11 −0.15 0.28** 0.27** 8. Reconfiguring capabilities 4.67 0.86 −0.09 −0.13 −0.28** 0.00 0.40* 0.36** 0.56** 9. NPD performance 5.35 0.88 −0.04 −0.03 −0.11 0.13 0.39** 0.50** 0.40** 0.40** *p< 0.05, **p < 0.01.
Table 3 Means, standard deviations, and zero-order correlations for defenders
M SD 1 2 3 4 5 6 7 8 1. Hostility 3.94 1.18 2. Dynamism 3.92 1.12 .62** 3. Firm size 1001 2983 −0.14 −0.41* 4. Firm age 32 25 0.17 0.02 0.42* 5. NPD strategy formality 4.7 1.14 0.05 0.28 0.11 0.18 6. Sensing capabilities 4.5 1.11 −0.19 0.05 0.13 0.06 0.34 7. Seizing capabilities 5.0 0.71 0.07 0.26 0.08 −0.28 0.48* 0.27 8. Reconfiguring capabilities 4.57 0.94 0.09 0.26 0.09 −0.13 0.41* 0.18 0.62** 9. NPD performance 5.1 1.07 0.19 0.28 0.16 0.17 0.46* 0.59** 0.30 0.28 *p< 0.05, **p < 0.01.
Table 4 Means, standard deviations, zero-order correlations, and reliabilities for the whole sample
M SD 1 2 3 4 5 6 7 8 1. Hostility 3.6 1.20 (.44) 2. Dynamism 3.9 1.18 .42** (0.60) 3. Firm size 895 3208 −0.02 −0.05 4. Firm age 33 30 .00 −0.00 0.29** 5. NPD strategy formality 5.0 1.22 −0.04 0.12 0.00 0.04 (0.88) 6. Sensing capabilities 5.1 1.07 −0.18* 0.00 −0.02 −0.00 0.29** (0.84) 7. Seizing capabilities 5.0 0.99 −0.11 0.05 −0.06 −0.18* 0.39** 0.38** (0.82) 8. Reconfiguring capabilities 4.7 0.90 −0.16* −0.16* −0.09 −0.05 0.41** 0.29** 0.49** (0.83) 9. NPD performance 5.4 0.94 0.00 0.04 −0.02 0.09 0.40** 0.58** 0.47** 0.30** (0.80) *p< 0.05, **p < 0.01.
hostility and dynamism; but because these variables are control variables, they remain in the analysis). Third, to assess whether common method variance might be a problem, the authors applied Harman’s single-factor test (Podsakoff and Organ, 1986). The presence of six factors with Eigenvalues greater than one, and with the first factor accounting for only 31% of the variance suggests that common method bias is unlikely to be a concern.
To assess non-response bias, the authors conducted a test for comparing the averages of annual sales and the number of employees of early and late respondents (Armstrong and Overton, 1977). Because the data col-lection began at the same time in all countries, the responses were pooled initially and then sorted based on the date they were received. The t-tests between the mean responses of early and late respondents indicate no statistically significant differences at the 0.05 level. Overall, non-response bias in the data is not a concern.
Findings
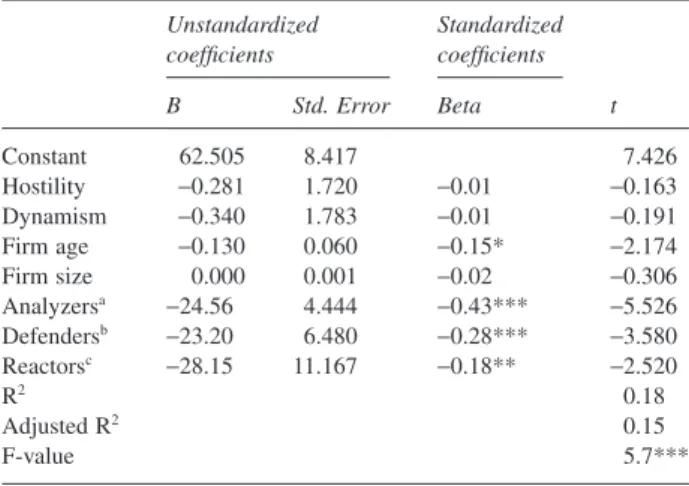
Each of the independent variables was regressed on NPD performance alone before they were included together in the hypothesis testing. The analyses revealed significant relationships between each independent vari-able and NPD performance (β = 0.43, p < 0.001 for NPD strategy formality;β = 0.63, p < 0.001 for sensing capabilities;β = 0.50, p < 0.001 for seizing capabilities; andβ = 0.30, p < 0.001 for reconfiguration capabilities). Furthermore, to see if splitting the data has any merit we regressed controls together with dummies for business strategy (prospectors taken as the reference group) on NPD performance.1 As can be seen from Table 5,
analyzers, defenders and reactors have significantly lower scores for the dependent as compared to the prospectors.
The authors tested the hypotheses using ordinary least squares regression within subgroups. Subgroup analysis is an appropriate technique to test for moderation when the moderator variable is categorical (Sharma et al., 1981). To determine the relative impact of NPD strategy formality and dynamic capabilities in NPD on NPD performance for alternative strategies, the authors con-ducted hierarchical regression analysis, controlling for environmental hostility, dynamism, firm age, and size. In Step 1 of the hierarchical regression analysis, the authors entered the control variables; in Step 2 they entered NPD strategy formality; and in Step 3 entered dynamic capa-bilities in NPD (sensing, seizing, and reconfiguring). Table 6 summarizes the results. For comparisons, we examined the difference in magnitude of the relationship
between the predictor and the criterion variable for each pair of strategy types (Cohen et al., 2003; Slater et al., 2006).
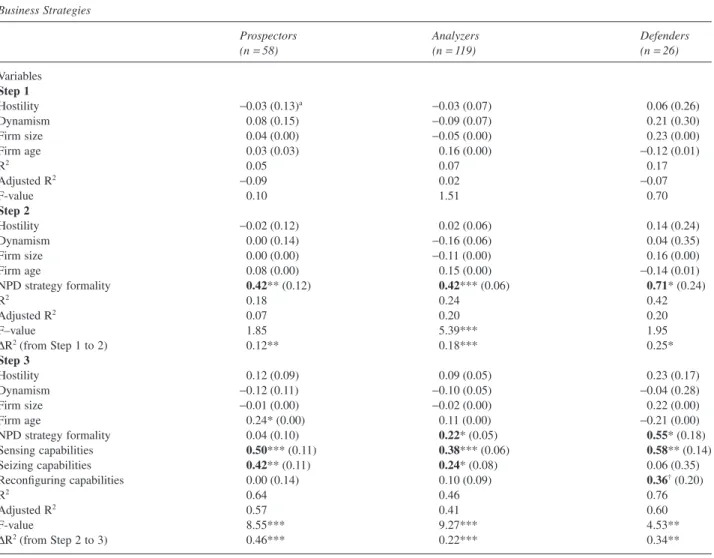
NPD strategy formality
For analyzers and defenders, as expected, the authors find a positive effect of NPD strategy formality on NPD performance in Step 2 and 3 (β = 0.22, p < 0.05; from Step 2 to Step 3, ΔR2= 0.22, p < 0.001 for analyzers,
β = 0.55, p < 0.05; from Step 2 to Step 3, ΔR2= 0.34,
p< 0.01 for defenders). For prospectors, there is a posi-tive effect of NPD strategy formality on NPD perfor-mance in Step 2 (β = 0.42, p < 0.01; from Step 1 to Step 2,ΔR2= 0.12, p < 0.01), however, this effect looses its
significance in Step 3 when dynamic capabilities are added to the analyses. Hence, Hypothesis 1 is partially supported.
Dynamic capabilities
As predicted, the authors identify a positive effect of sensing capabilities on NPD performance for prospec-tors (β = 0.50, p < 0.001) (from Step 2 to Step 3, ΔR2= 0.46, p < 0.001). Sensing capabilities were also
found to have a significant effects on NPD performance for defenders (β = 0.58, p < 0.01) and analyzers (β = 0.38, p < 0.001) (from Step 2 to Step 3, ΔR2= 0.34,
p< 0.01 for defenders and ΔR2= 0.22, p < 0.001 for
analyzers). While this effect is stronger for prospectors (β = 0.50, p < 0.001)) than for analyzers (β = 0.38,
p< 0.001), the difference between prospectors and
defenders (β = 0.58, p < 0.01) is not significant. Hence, Hypothesis 2 is partially supported.
1We thank the anonymous reviewer for his/her scholarly
per-spective and guidance.
Table 5 Regression with strategy dummies (analyzers, defenders,
reac-tors) on the NPD performance (in terms of radical-next generation product sales) Unstandardized coefficients Standardized coefficients B Std. Error Beta t Constant 62.505 8.417 7.426 Hostility −0.281 1.720 −0.01 −0.163 Dynamism −0.340 1.783 −0.01 −0.191 Firm age −0.130 0.060 −0.15* −2.174 Firm size 0.000 0.001 −0.02 −0.306 Analyzersa −24.56 4.444 −0.43*** −5.526 Defendersb −23.20 6.480 −0.28*** −3.580 Reactorsc −28.15 11.167 −0.18** −2.520 R2 0.18 Adjusted R2 0.15 F-value 5.7*** *p< 0.05, **p < 0.01, ***p < 0.001.
aAnalyzer= 1 if the SBU is classified as an Analyzer, 0 if not. bDefender= 1 if the SBU is classified as a Defender, 0 if not. cReactors have all the dummy variables= 0. (Reactors shown in the table
As predicted, the authors identify a stronger positive effect of seizing capabilities on NPD performance for prospectors (β = 0.42, p < 0.01) and analyzers (β = 0.24,
p< 0.05), than for defenders. This relationship is not
significant for defenders. Thus, Hypothesis 3 is sup-ported. The effect of reconfiguring capabilities on NPD performance is not significant for prospectors and analyzers, whereas it shows a tendency for defenders (†p= 0.07, Table 6). Hence, Hypothesis 4 is partially
supported.
Adding dynamic capabilities to the model in Step 3, the authors observe significant R2changes from Step 2 to
Step 3 for all strategy types (ΔR2= 0.46, p < 0.001 for
prospectors, ΔR2= 0.22, p < 0.001 for analyzers and
ΔR2= 0.34, p < 0.01 for defenders). NPD strategy
for-mality significant in Step 2 for all strategy types, decreases in terms of magnitude and significance for analyzers and defenders, while loses its significance for prospectors. This supports the expectation that dynamic capabilities have explanatory power above and beyond
that of a strong NPD strategy for all strategy types, most significantly for prospectors.
Discussion and conclusions
The study provides important contributions to the litera-ture by investigating the effects of NPD strategy formal-ity and dynamic capabilities on NPD performance for different business strategies. First, the findings show that the effects of NPD strategy formality and dynamic capa-bilities on NPD performance vary depending on a firm’s business strategy. Given that firms have different prior-ities around responding to their environment, the degree to which they focus on a formal strategy, and capability development differ, so do their performance effects. Second, the study provides empirical evidence for the stronger explanatory power of dynamic capabilities compared to strategizing. The overriding performance effects of such capabilities are evident irrespective of the
Table 6 Business strategies: regression results for NPD performance as the criterion variable Business Strategies
Prospectors Analyzers Defenders (n= 58) (n= 119) (n= 26) Variables Step 1 Hostility −0.03 (0.13)a −0.03 (0.07) 0.06 (0.26) Dynamism 0.08 (0.15) −0.09 (0.07) 0.21 (0.30) Firm size 0.04 (0.00) −0.05 (0.00) 0.23 (0.00) Firm age 0.03 (0.03) 0.16 (0.00) −0.12 (0.01) R2 0.05 0.07 0.17 Adjusted R2 −0.09 0.02 −0.07 F-value 0.10 1.51 0.70 Step 2 Hostility −0.02 (0.12) 0.02 (0.06) 0.14 (0.24) Dynamism 0.00 (0.14) −0.16 (0.06) 0.04 (0.35) Firm size 0.00 (0.00) −0.11 (0.00) 0.16 (0.00) Firm age 0.08 (0.00) 0.15 (0.00) −0.14 (0.01) NPD strategy formality 0.42** (0.12) 0.42*** (0.06) 0.71* (0.24) R2 0.18 0.24 0.42 Adjusted R2 0.07 0.20 0.20 F–value 1.85 5.39*** 1.95 ΔR2(from Step 1 to 2) 0.12** 0.18*** 0.25* Step 3 Hostility 0.12 (0.09) 0.09 (0.05) 0.23 (0.17) Dynamism −0.12 (0.11) −0.10 (0.05) −0.04 (0.28) Firm size −0.01 (0.00) −0.02 (0.00) 0.22 (0.00) Firm age 0.24* (0.00) 0.11 (0.00) −0.21 (0.00) NPD strategy formality 0.04 (0.10) 0.22* (0.05) 0.55* (0.18) Sensing capabilities 0.50*** (0.11) 0.38*** (0.06) 0.58** (0.14) Seizing capabilities 0.42** (0.11) 0.24* (0.08) 0.06 (0.35) Reconfiguring capabilities 0.00 (0.14) 0.10 (0.09) 0.36†(0.20) R2 0.64 0.46 0.76 Adjusted R2 0.57 0.41 0.60 F-value 8.55*** 9.27*** 4.53** ΔR2(from Step 2 to 3) 0.46*** 0.22*** 0.34**
aNumbers in parentheses are coefficient standard deviations.
type of business strategy pursued. In these respects, the present study makes important contributions to the strat-egy literature. Third, the study examines stratstrat-egy for-mality and the components of dynamic capabilities, taking NPD as the unit of analysis; previous studies mostly focus on the effects of these factors at the organizational level. This study contributes to the product development literature especially by investigat-ing dynamic capabilities in an NPD context because developing such capabilities is significant in developing competitive new products in addition to existing success factors (Danneels, 2002; Marsh and Stock, 2003; Prieto
et al., 2009).
As expected, the study identifies that a formal NPD strategy is an important driver of NPD success for analyzers and defenders, and it unexpectedly finds that such a strategy is also important for prospectors. For prospectors, the positive link between NPD strategy for-mality and performance is inconsistent with Veliyath and Shortell (1993) and Slater et al. (2006). This incon-sistency might stem from the unit of analysis; while those two studies investigate the effects of strategy for-malization at the business unit level, the current study focuses on the NPD unit. This inconsistency may also be due to the different samples under investigation; while the above-noted studies examine US firms, the current study focuses on European firms. As suggested by recent research (Kirca et al., 2005; Acur et al., 2012), US firms prefer short-term payoffs while European firms, such as in Denmark, Norway, the Netherlands, and Finland, are more comfortable with long-term strategic orientations. This finding of the present study supports Shortell and Zajac’s (1990) study, which reports that strategy for-malization is positively related to innovation for pro-spectors. Hence, the authors suggest that ‘formality should not be considered synonymous with a rigidity that might restrict the ability of prospectors to respond to a quickly changing market’ (Shortell and Zajac, 1990: 828). Accordingly, for prospectors a formal NPD strat-egy may provide the basis for deciding which new opportunities should be pursued and integrated. Notably, as will be explained below, for prospectors the positive performance effect of NPD strategy formality becomes insignificant in the presence of dynamic capabilities.
Sensing capabilities have been identified to have sig-nificant effects on NPD performance for all three strat-egy types. While, as expected, these capabilities have stronger effects for prospectors than for analyzers, unex-pectedly, the effect for prospectors is not significantly stronger than for defenders. In other words, sensing capabilities are found to be strong drivers of NPD per-formance for defenders as well. This result for defenders is not consistent with much of the previous research (e.g., Hambrick, 1983), but may coincide with some recent studies. For example, Laugen et al. (2006) show that all three types of companies need to emphasize
monitoring the market for opportunities. Ellonen et al. (2009) suggest that sensing capabilities are a prerequi-site for generating innovation and for survival in dynamic markets. These contentions may find support in today’s increasingly competitive markets; even defend-ers may now be under increasing pressure to identify and integrate opportunities to protect their domains.
In line with our expectations, seizing capabilities have significant performance effects for prospectors and analyzers, than for defenders. This finding is in line with Conant et al. (1990). Prospectors and analyzers both seek to develop capabilities around the engineering problem. Prospectors tend to develop radical innovations that usually require building new capabilities rather than reconfiguring old ones that have worked well for previous products/technologies. Those new capabilities are most often built in a separate entity or subsidiary so they will not play against the old competences. Such ‘ambidex-trous organizations,’ that is, with differentiated but par-tially or weakly integrated subunits (O’Reilly and Tushman, 2004), may be common to analyzers as well, who need to create new competences within new units but preserve their old competences within their established units. Miles and Snow (1978) note that analyzers face an engineering problem that includes improving technologi-cal competences and complementary assets while retain-ing a base of traditional segments and competences. Hence, analyzers must also acquire new competences and develop a shared understanding of them through their functional units to be able to follow prospectors.
Reconfiguring capabilities have significant perfor-mance effects only for defenders. This finding suggests that agressively maintaining their domain through com-petitive pricing, as suggested by Miles et al. (1978), is a viable strategy for these companies. However, contrary to the current study’s expectations, for analyzers this relationship is insignificant. Although Ellonen et al. (2009) suggest that analyzer firms are better able to leverage their existing capabilities and reconfigure their competences, this study finds that those capabilities do not enhance analyzers’ NPD performances. Instead, these companies might maintain their domains through offering new products not only to their more dynamic markets but also to their existing markets. Analyzers’ NPD performance might be increasingly dependent on their sensing and seizing capabilities, as this study also identifies.
Notably, another contribution of the study is that it employes a measure of dynamic capabilities which fully covers the three dimensions defined by Teece (2007). Of those previous studies which examine dynamic capabil-ities, only a limited number are empirical investigations, and their coverage of dynamic capabilities is incom-plete. For example, these studies operationalize dynamic capabilities in terms of research team capabilities and R&D management capabilities (Deeds et al., 1999),
knowledge retention, interpretation and integration of prior knowledge (Marsh and Stock, 2003) and knowl-edge generation, integration and reconfiguration capa-bilities (Prieto et al., 2009). To this end, the present study, by adopting a more comprehensive approach to the measurement of dynamic capabilities contributes to the field, which is still in its infancy, with overlapping definitions, measures, and inconsistencies (Zahra et al., 2006; Wu, 2010).
Concluding remarks, future research, and managerial implications
Most study findings support Laugen et al. (2006), who show that the three strategy types are growing towards each other, that is, differences between companies in terms of their competitive priorities and the systems they use to support their functioning may be disappearing. Laugen et al. (2006) point out that when Miles and Snow published their work in 1978, competition was mostly price based; today’s companies need to develop new capabilities in terms of market, technology, variety, speed, and, increasingly, innovation (Ellonen et al., 2009). Parallel to this view, sensing capabilities are noted in the present study as dynamic capabilities with strong performance effects not only for prospectors but also for defenders. Perhaps traditional defenders, who are mecha-nistic and efficiency-seeking, are less likely to survive in most industries today, at least in those facing global and competitive forces. Defenders must now also seek oppor-tunities and focus on new products in their NPD efforts to improve performance. Similarly, the study finds that for analyzers, sensing capabilities are important drivers of NPD performance, although to a lesser extent when com-pared to prospectors. This finding parallels Desarbo et al. (2005), who, based on data from 709 firms in three countries, find that analyzers do not necessarily constitute a separate group, but behave as prospectors or defenders. Considering the current study’s results, such companies may be moving closer to prospectors if the Miles and Snow typology is viewed as a continuum (Olson et al., 2005). As also suggested by McKee et al. (1989), a firm may show strategic flexibility and move toward an adjacent strategy type. Supporting these contentions, analyzers in this study may be moving closer to prospec-tors, and defenders may be moving closer to analyzers, given the apparent importance of sensing capabilities in generating higher performance.
The current study’s findings call for future research to investigate (1) the effects of sensing capabilities on defenders’ performance at the organizational level, (2) whether analyzers are approaching prospectors and defenders are approaching analyzers with respect to behaviors other than dynamic capability development, and (3) the role of other components of strategic man-agement, for example, analyzing situations and
evaluating strategic alternatives (Slater et al., 2006), as well as the role of strategic implementation (Veliyath and Shortell, 1993) in NPD performance for different business strategies.
Importantly, the present study finds that dynamic capa-bilities explain NPD performance above and beyond a formal NPD strategy, regardless of the type of strategy pursued. That is, in the presence of dynamic capabilities, a formal NPD strategy has much less effect on NPD performance. For prospectors, the performance effect of a strong NPD strategy is no more significant when it coex-ists with dynamic capabilities. These findings provide empirical evidence for Teece et al.’s (1997) theoretical suggestions, which postulate that competitive advantage stems from investing in soft assets, that is, high-performance routines shaped by processes, positions, and paths, rather than from strategizing about how best to take advantage of competitors’ limitations or firm resources. The authors argue that ‘except in special circumstances, too much “strategizing” can lead firms to underinvest in core competences and neglect dynamic capabilities, and thus, harm long-term competitiveness’ (Teece et al., 1997: 528). Similarly, Pitt and Clarke (1999) suggest that competitive environments in the new millennium chal-lenge firm behavior in that firms increasingly need fluid, directed, yet adaptive learning to prosper. Simultaneously examining NPD strategy formality and dynamic capabil-ities in the present study enabled validating the conten-tion that in NPD settings dynamic capabilities have stronger performance effects than strategizing. Future research in the strategy area and dynamic capabilities stream should provide empirical evidence from contexts other than NPD to lend further support to the overriding effects of the capabilities view.
This study has several limitations. First, it is based on cross-sectional data, therefore the relationships are cor-relational and do not show cause and effect. Future research should employ longitudinal data, if possible. Second, prior performance of companies is not meas-ured in the study. With such data, it may also be possible to observe changes in the NPD performance of compa-nies as they develop dynamic capabilities over time. As some scholars have also suggested, even small differ-ences in dynamic capabilities among firms over time can result in differential firm performance (Adler and Helfat, 2003; Zott, 2003). Third, the sample size for defenders is small, suggesting that the related findings should be taken into consideration cautiously and should be further explored in future studies. This is a common problem for studies conducting subgroup analysis in the business strategy area (e.g., Di Benedetto and Song, 2003; Olson
et al., 2005; Song et al., 2007). To explore further on
this limitation, as suggested by Cohen and colleagues (2003), we conducted a power analysis to determine the probability of finding the sample R2 to be greater than