Published online: 10 February 2006
Saroj Kumar Bhattacharyya Patrycja Maciejewska Lars Börger
Manfred Stadler Akif Mehmet Gülsün Hasan Basri Cicek Helmut Cölfen
Development of a Fast Fiber
Based UV-Vis Multiwavelength Detector
for an Ultracentrifuge
Saroj Kumar Bhattacharyya·
Patrycja Maciejewska· Helmut Cölfen (u) Department of Colloid Chemistry, MPI Research Campus Golm, Max Planck Institute of Colloids and Interfaces, Am Mühlenberg 2, 14424 Potsdam, Germany
e-mail: [email protected] Lars Börger· Manfred Stadler
Polymer Research Laboratory, BASF AG, G201, 67056 Ludwigshafen, Germany Akif Mehmet Gülsün· Hasan Basri Cicek Department of Electrical and Electronics Engineering, Bilkent University, 06800 Bilkent Ankara, Turkey
Abstract The advantages of sim-ultaneously detecting multiple wavelengths in ultracentrifugation experiments are obvious, especially for interacting systems. In addition, the detection of the wavelength dependence of turbidity opens up the possibility to obtain independent information on the particle size in addition to the usual sedimentation coefficient distribution for colloidal systems. We therefore made an effort to develop a fast UV/Vis detector, which is able to simultaneously detect the range from 200–800 nm. This is possible by the use of a modern CCD chip based generation of UV-Vis spectrometers, which translates the dispersed white light onto a CCD chip, where each pixel corresponds to a particular wavelength. In addition to the simultaneous detection of a large number of wavelengths in the range 200–800 nm, also with non integer values, these spectrometers are very fast. Current typical spectrum scan times with the necessary scan quality in the ultracentrifuge are in the range of 100 ms but this time can be significantly shortened down to 3 ms for higher light intensities and even down to 10µs for a new generation of CCD chip based spectrometers.
The introduction of a fiber based UV-Vis optics into a preparative XL-80K ultracentrifuge with the associated hardware developments
will be described as a first generation prototype. In this study, we use a wavelength dependent optical lens system instead of the necessary but more complex wavelength indepen-dent mirror optical system for a first check on possibilities and limitations of the optical system. First examples for biopolymers and latexes will be presented and compared to those obtained in the commercial XL-A ultracentrifuge. Already the fast detection enables completely new possibilities like the determination of a particle size distribution in a few minutes. Multiwavelength detection at constant position in dependence of time will be demonstrated, which is an important mode for the use of speed profiles for very poly-disperse samples. Also, the use of radial multiwavelength scans will be demonstrated producing a three di-mensional data space for monitoring the sedimentation via radial scans with multiwavelength detection. However, despite the advantages, the current problems with the detector will also be discussed including the main problem that much intensity is lost in the important UV range as a result of fiber coupling and bending. Keywords Analytical
Ultracentrifugation· CCD based UV-Vis Spectrometer· Detector Development· Fiber Optics
Introduction
The development of optical detection systems for ultracen-trifuges is as old as Analytical Ultracentrifugation itself and dates back to the development of Analytical Ultra-centrifugation [1]. The classical detection systems are UV-Vis absorption optics, Rayleigh Interference optics and Schlieren optics as discussed in detail in the classical book of Lloyd [2]. Furthermore, fluorescence optics was de-veloped for the platform of the Beckman Model E [3] and more recently for the platform of the Beckman XL-I ultracentrifuge [4, 5]. In addition, turbidity optics was de-veloped for the characterization of particle size distribu-tions of colloidal particles [6–9]. Despite some progress on the detector or illumination part of the optical systems concerning the transformation of photographic detection to CCD chip detection for Schlieren and Interference op-tics or the use of laser light sources [10–18] (for further references see also the references for multiplexer systems) and photomultiplier detection for the UV-Vis [19] and flu-orescence optics [3, 4], the classical optical systems re-mained essentially unchanged for decades. Exceptions are the Flossdorf optics [20], which significantly increased the detected intensity for UV-Vis optical systems and the ultra-sensitive Schlieren optics [21].
However, the demands of Analytical Ultracentrifuga-tion have greatly improved with the advent of cheap and powerful computer resources. The most obvious change is the speed of data acquisition and the amount of ex-perimental data becoming available from computer based detectors, which has found its commercial expression in the launch of the Beckman XL-I ultracentrifuge in the 90s of last century [19]. This has in turn catalyzed many methodic advances, which enable analyses with an accu-racy not being even imaginable a decade ago [22–26]. However, it must clearly be stated that the development on the data evaluation side is by magnitudes more sig-nificant than the hardware development – especially that of optical detection systems for the Analytical Ultracen-trifuge (AUC). This is understandable as hardware devel-opment is by factors slower than software develdevel-opment due to the delivery and workshop manufacturing waiting times. Nevertheless, there is an urgent need for improved multi detector development for the AUC [27], not only concerning detection speed but also detection capabili-ties. Examples for the benefit of multi detector use are manifold. They include determination of extinction coef-ficients [28], even in complicated mixtures [29] but also the possibility of global analysis by evaluation of mul-tiple experiments [30–32] as well as increased experi-mental information from a single experiment with mul-tiple species and different chromophores by multiwave-length analysis. The detection of multiple wavemultiwave-lengths from UV-Vis absorption optics proved especially useful for the analysis of biopolymers from sedimentation equi-librium [33] or sedimentation velocity [34], although in the
reported cases, the analysis was restricted to the three pos-sible scanning wavelengths of the XL-I AUC under add-ition of information from the interference optical system. Thus, the potential benefit of multiwavelength analyses of hundreds of wavelengths is obvious not only for interac-tion analyses of complicated interacting polymer mixtures but also for colloidal systems as the wavelength depen-dence of the turbidity of colloidal samples contains in-formation about their particle size according to the MIE scattering theory [35–38]. With the advent of global an-alysis approaches involving AUC data, multiwavelength analysis will become an especially important technique for all light absorbing samples of colloidal or polymeric nature.
Parallel to the above developments in AUC methodol-ogy, there was also a significant development in the UV-Vis spectrometer technology. Modern UV-UV-Vis spectrome-ters can use simple CCD line arrays for the simultaneous detection of a large number of wavelengths, which is es-sentially only limited by the CCD array pixel number as well as the quality of the applied diffraction grating for the dispersion of the incoming white light. These spectrome-ters do not only allow for the simultaneous detection of the entire UV-Vis wavelength range, but are furthermore very fast and cheap. Commonly available spectrometers like the USB2000 by Ocean Optics allow for scanning times of down to 3 ms for an entire UV-Vis spectrum [39]. More recent instruments like the Ocean Optics HR4000 [40] or the series of CCD and ICCD based spectrometers available from LOT-Oriel [41] are magnitudes faster and can scan UV-Vis spectra as fast as 10µs. The cooled spectrometers give a quite broad linear dynamic range with the advan-tage of working with low dark current due to cooling [41]. However, although these fast and powerful UV-Vis detec-tors are available, they were not yet applied as detecdetec-tors for AUC’s. One of the reasons is that these detectors are based on fiber optics and also operate with incoming white light. White light with wavelength dependent refractive indices makes the precise use of a refractive optics impossible – at least in the UV range, where the conventional achro-mat lenses cannot be applied or vice versa in the visible range if an expensive UV achromat lens system is applied. This is only one obstacle, with no parallel in previous AUC optics, which always operates with monochromatic light – or in case of the XL-A AUC with a torroidally curved diffraction grating producing monochromatic light. This means that in AUC history, the challenge of a multiwave-length optics has not been undertaken despite the potential benefits. This was the starting point for the cooperation be-tween the Max-Planck Institute of Colloids and Interfaces and the polymer physics department of BASF R&D. This study presents the first results from this cooperation aim-ing to improve the AUC capabilities by the development of new detection systems. We have on purpose started with the use of conventional wavelength dependent refractive index based lens optics as:
1. Ocean Optics as spectrometer supplier also offers opti-mized lens systems. They are available as plug & play components for a fiber based optical system so that po-tentially, a fiber optical plug and play system could be applied using the commercial spectrometer software as a first data acquisition software. With this system, first experiences can be made for the further detector devel-opment.
2. The mirror optics that use small focal length spherical and parabolic mirrors are not standard optical compo-nents, and are not yet available for this application. 3. Fiber optics are only very rarely applied in AUC
de-tectors. Therefore, potentials and limitations of this optical transport medium for AUC detectors shall be explored.
4. The detector hardware needs to be developed. A lens based system is relatively compact but also the most distorting optical system for white light. Nevertheless, first developments can be made with this compact set-up. The adaptation to the mirror based system can be done on the basis of these experiences if necessary. As a consequence, the present study can only be seen as the first step towards a fast fiber based UV-Vis multi-wavelength detector. Here we will only use classical lens optics as a case study well knowing about the problem of chromatic abberation. It is clear that this design can-not be the final prototype but there is already much to be learned not only about the actually detected light in-tensity but potential problems that may come in way for using other components as fibers or fiber coupled spec-trometers. We have therefore also included developments, which are independent of the fiber optical system or multi-wavelength detector so that we report about a fiber based high power Xenon lamp as well as on an advanced mul-tiplexer hard/software based on earlier hardware develop-ments [42] currently available as a LABVIEW software. Although just being a snapshot of an ongoing development process, the present study will be able to show the pos-sibilities but also the first limitations of a fast fiber based UV-Vis detector for the AUC.
Experimental
For the detector development, we used the following com-mercial products: (a) Spectrometer: USB 2000 Fiber Op-tics Spectrometer (UV/Vis), Ocean Optics BV, Duiven, The Netherlands with SMA 905 fiber optics connec-tion, 25µm entrance slit, grating: 600 lines/mm, L2 de-tector collection lens with UV optimized coating and OFLV-350-1000 2-nd order filter installed and operable with the Ocean optics OOIBASE 32 software. For the UV optimized spectrometer, we have applied a 1200 line holographic grating in combination with a 50µm slit as the entrance aperture (Fig. 5, component 3) and all other UV optimized compounds as described above.
(b) Fibers: 600µm UV/Vis fibers in four channel vacuum feed through, OZ optics, Canada for illumination optics. 600µm UV/Vis patchcord from Oceanoptics, Duiven, The Netherlands. (c) Focuser: Receptacle style focuser from OZ optics, Canada with biconvex lens ( f = 15 mm) and SMA 905 connector (d) Linear actuator: Linear actu-ator model T-LA28-SV (shorter version) with necessary power supply from Zaber, Canada for precise movement of the detector arm. (e) Lenses and Prism: Biconvex lenses f = 20.6 mm for custom built collimation optics and f = 20 mm for collecting transmitted UV/Vis light and a right angled prism from Linos, Göttingen, Germany. (f) Slit: 25µm slit from slit-lens assembly of commer-cial Beckman XL-I, Analytical Ultracentrifuge. (g) Light source: Xe-Flash lamp with mirror (model L-4633-01) with the relevant power supply from Hamamatsu Pho-tonics GmbH, Herrsching, Germany. (h) Optical Bench: From Owis GmbH, Göttingen, Germany with possibility for x, y, z adjustment and angular adjustment for coup-ling the light from the flash lamp to fiber. (i) Optical stage: From OWIS GmbH, Staufen, Germany with possibility to fine-adjust in x and y direction for the precise adjustment of the detection optics part of the detector arm. (j) Electri-cal feedthrough: 18 pin electriElectri-cal feedthrough for electriElectri-cal connection of the linear actuator from Lemo Electronic GmbH, Munich, Germany.
Samples for measurement: The proteins were obtained from Sigma-Aldrich, Germany, the latexes were prepared in house. For data generation with the designed detector the following samples were used: (1) BSA (∼ 1.0 g/L) in 0.1 MNaCl, pH = 7.5. (2) Cytochrome C (∼ 1.0 g/L) in 20 mM MOPS pH 7.2 containing 2 microM K3Fe(CN)6 and 5 mg/mL dodecyl maltoside. (3) Polystyrene Latex with different particle sizes (150 nm, 190 nm, 240 nm, 430 nm, 450 nm & 660 nm) were mixed and prepared by dilution with water so that satisfactory intensity of the UV/Vis transmitted light can be detected. (4) For the ex-periment corresponding to Fig. 12, Polystyrene latex par-ticles of sizes 190 nm, 305 nm and 605 nm were mixed in a ratio of 1: 2 : 2 by wt. and diluted with water to suitable dilution for the AUC UV/Vis absorption optics.
Results and Discussion
Hardware Developments
Illumination System. The whole optical system was de-signed as a modular system, which permits the use of as many commercially available components as possible and simultaneously enables easy exchange of individual com-ponents. For illumination, a Hamamatsu L4633-01 flash lamp was used with a built in reflector which focuses the white light directly into an optical fiber. For further de-tails, see [43]. This design enables a fourfold greater rela-tive light intensity relarela-tive to the conventional Hamamatsu
Fig. 1 Set-up of the illumination system for the fiber optics. (1) Lamp, (2) Holder with x, y, z positioning unit, (3) Fiber, (4) Power supply
L-2435 flash lamp, which is installed in the XL-I. How-ever, the main intensity gain is obtained from the fact, that much of the light is coupled into an optical fiber, whereas in the design of the Beckman XL-A AUC, a pinhole in front of the flash lamp is applied as optical aperture, so that much of the light does not enter the optical detec-tion system. A direct intensity comparison between the fiber coupled Xenon flash lamp and the XL-A design in the wavelength range 400–800 nm revealed a factor of 35–70 higher intensity at the end of the fiber set-up de-pending on the applied wavelength. However, the flash repetition speed of the flash lamp is relatively slow (only 100 Hz), which corresponds to a maximum flash repeti-tion of 10 ms. Although this is the same speed as the lamp of the XL-A, it is not satisfactory in view of the fast spectrometer detection capabilities. If it is considered that a single flash is only about 4µs long, but the flash repeti-tion takes 10 ms, it is clear that the flash lamp is the time limiting component in the present set-up at rotor speed > 6000 rpm.
The set-up of the illumination system for the fiber op-tics is simple. An optical bench (OWIS GmbH, Staufen, Germany) with an x, y, z positioning element is used to mount the lamp and the fiber as shown in Fig. 1.
This set-up enables the optimum coupling of the light from the lamp into a fiber, which can be adjusted by ob-serving the beam intensity exiting the fiber on a sheet of paper. Coupling is then further optimized using the inten-sity reading from the spectrometer.
Vacuum Feedthroughs/Heatsink Modification. One of the most significant changes of the AUC hardware necessary for the fiber based UV-Vis optical system is the need to feed light and electricity into and out of the vacuum chamber. In the present set-up, this is solved by drilling 6 holes into the heatsink of the XL ultracentrifuge, which was done in the mechanical workshop of the BASF (see
Fig. 2 XL-heatsink with vacuum feedthroughs and mounted fibers. (1) Focuser (2) Vacuum feedthrough for electrical cables (3) Win-dow for further optical system (4) vacuum feedthroughs for fibers (5) Vacuum feedthrough for electrical cables
Fig. 2). This has the significant disadvantage that the Beck-man warranty is lost so that future designs will be based upon XL-I heatsinks. However, modified heatsinks of the shown type are operated already for several years in the AUC laboratory at BASF AG, Ludwigshafen, Germany without any problem so that they are considered by the authors to be safe. In addition, the present design in prin-ciple allows for the mounting of three detector arms of the type presented in this work so that up to three detec-tors can be run simultaneously. As vacuum feedthroughs, either a four fiber 600µm vacuum feedthrough from Oz Optics, Ottawa, Canada was applied as shown in Fig. 2 or one fiber vacuum feedthroughs with SMA 905 connec-tors (Ocean optics B.V., Duiven, The Netherlands). Both feedthroughs have their specific advantages and disadvan-tages. Whereas the one fiber feedthrough with SMA 905 connector is a very easy and modular system, it looses light (∼ 5%) as it creates an additional two fiber couplings.
The four fiber feedthrough does not have this disadvan-tage. It also uses only one feedthrough for four fibers and should be the system of choice. However, if a fiber breaks, the whole feedthrough has to be taken out and be sent for repair, which can be a significant disadvantage at least in the prototype design process, where many modifications of the optical system are carried out.
The feedthroughs for electrical cables are less problem-atic. Here, we use LEMO Electronic, Munich, Germany electric feedthroughs for 18 cables, where one feedthrough is sufficient for the whole UV-Vis fiber optics.
Optical Fibers. The choice of optical fibers is difficult and always a compromise. On one hand, they should enable the transmittance of as much light as possible, while on the other hand, the precision of the optical system is de-termined by the fiber diameter, as this is the smallest spot size, the light can be focused to. Another requirement is
that the fibers should have a high transmittance over the entire UV-Vis range (200–800 nm). We have decided to al-low for the maximum light intensity, meaning that we use 600µm or even 1000 µm fibers (Oz optics or Ocean op-tics). Another issue, which should not be neglected is the capability of the fibers to bend without too much light in-tensity loss, especially in the UV range, as the fibers have to be bent in the vacuum chamber in the present prototype. As connector system for the fibers, we have applied SMA 905 connectors, which appear to be the most universal for our purpose, but other connectors are also possible.
The Detector Arm. The detector arm is the central elem-ent of the UV-Vis optical system, as it contains all esselem-ential optical components of the optical system itself. The detec-tor arm is schematically shown in Fig. 3.
The fiber coming from the lamp is coupled to a collima-tion system (2 in Fig. 3). This collimacollima-tion system focuses the light onto the center of the cell. However, it has to be mentioned that the focusing is only achieved for the visible part of the white light and that unavoidable errors are made as long as lenses are used due to chromatic aberration. This can partially be compensated for by using achromatic lenses but they are only available for the visible or UV range respectively and not over the entire range between 200–800 nm, which is envisaged in our application. There-fore, we did not use achromats for this prototype. Instead, we have focused the light onto the center of the cell (spot size ca. 2 mm) for the reason that we were not able to make
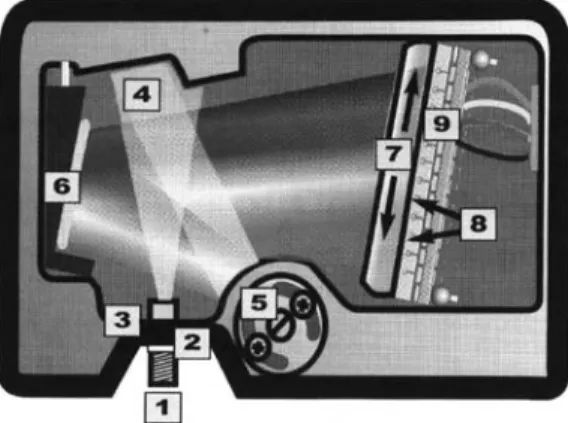
Fig. 3 The detector arm. (1) 600 micron patch fiber UV/Vis (Ocean optics), (2) The collimating lens system (self built), f= 20.6 mm biconvex, (3) 90◦ Quartz prism, (4) Slit-lens assembly (from the XL-A) only one lens f= 20 mm biconvex, (5) Focuser, one bicon-vex lens (15 mm), (6) 600µm patch fiber (Ocean optics). The light path is also shown schematically
Fig. 4 left. Photograph of the arm, (1) Detector arm, (2) Stepping motor (0.1 µm resolution at up to 4 mm/s), (3) Detection unit with x-y positioning screws. Right: Mounted arm in the rotor chamber the light parallel, which is the desired situation and in add-ition needed as much light for detection as possible to investigate the principal capabilities of this first generation prototype. Earlier efforts were made for producing colli-mated light by using plano convex lenses in the collimation optics part. However, the desired collimated light could not be achieved by using commercially available lenses. The light, which has passed the centrifuge cell is then collected by a modified slit-lens assembly from a Beckman XL-A (4 in Fig. 3) with a 25µm slit forming the aperture for the radial resolution. The camera lenses of the original system were replaced by a single biconvex lens (f= 20 mm). After the light has passed the slit, it is collected by a commercial focuser system (Ocean optics, with a f= 15 mm biconvex lens) and coupled back into a fiber to the spectrometer. The whole slit-lens assembly can be adjusted by an x-y table to collect the maximum light.
The entire illumination and detection parts of the de-tector arm (Fig. 3) are connected so that they move as a unit along the ultracentrifuge cell. This is achieved by a Zaber (Zaber, Richmond, Canada) step motor (Model T-LA28-SV), which is very fast and precise (Fig. 4). It en-ables a scanning speed of up to 4 mm/s with an accuracy of 100 nm. In principle, the motor can scan a whole cell in only 3 s. The motor axis itself pushes a plate attached to a spring to ensure mechanical contact between the step motor and the moveable part of the detector arm. The whole detector arm is shown in Fig. 4 in the unmounted state and mounted in the ultracentrifuge.
The UV-Vis Spectrometer. The most important part of the UV-Vis optics, besides the detector arm, is the detector itself. In the present study, we have applied a USB2000 spectrometer (Ocean Optics, Duiven, The Netherlands). There are many available spectrometer options (see http://
oceanoptics.com/), the most important being the choice of the diffraction grating and the spectrometer aperture (see Fig. 5). We have applied the 1200 line holographic grat-ing for the UV optimized spectrometer & 600 lines blazed grating at 400 nm for the UV/Vis in combination with a 25µm slit (for UV/Vis) and a 50 µm (for UV) entrance slit as the entrance aperture (Fig. 5, component 3). The main feature of the USB2000 UV-Vis spectrometer is the use of a CCD line array detector (a 2048-element linear silicon CCD array), which allows for the simultaneous detection of the entire spectral range within an integration time as short as 3 ms. Practical integration times used in this study are in the 50–100 ms range so that the spectrometer is rate limiting rather than the lamp.
The USBS2000 spectrometer has several vital com-ponents. They are shown in Fig. 5 and explained in the following. First, the fiber with the light coming from the sample cell is connected to the SMA905 connector (1) of the spectrometer. After passing a filter (2), the light passes the 25 or 50µm slit (3) as the entrance aperture. It is then collimated by a collimating mirror (4), which reflects the light from the entrance aperture as a collimated beam to-wards the diffraction grating (5), which disperses the white light. The refracted light is subsequently reflected by a fo-cusing mirror (6), which reflects and focuses the light onto the detector array. The light collection efficiency is fur-ther increased by a cylindrical lens in front of the CCD array (7). Before the light finally reaches the CCD detec-tor (9), it passes through a longpass filter (8) for the elimi-nation of second and third order effects. All spectrometer lenses were coated with a special coating for increased UV transmittance. The spectrometer data can then be di-rectly read out by the commercial spectrometer software. However, this is only of very limited use for the applica-tion in an AUC. We therefore used the LABVIEW drivers supplied by Ocean Optics and programmed our own appli-cation software (see 2. Software developments).
Fig. 5 The USB2000 UV-Vis spectrometer. Figure courtesy of Ocean Optics and reproduced with kind permission from Ocean optics BV, Duiven, The Netherlands. For description of the compo-nents see text
Multiplexer and Data Acquisition System. To control the firing of the lamp, a multiplexer system is needed. For this, a trigger signal per rotor revolution has to be generated. This is achieved in our case by polishing an inner sector shaped part of the rotor next to the overspeed disk. This polished part is detected by a reflection light gate similar to an earlier system developed for the model E AUC [42, 44] resulting in a TTL rectangular trigger pulse per rotor revo-lution. This TTL trigger signal then serves for the precise determination of the rotor speed and the exact time be-tween two rotor revolutions. This time interval is divided into 1000 steps corresponding to an angular resolution of 0.36◦ on the spinning AUC rotor and the time delay of a cell passing the optical detection part to the trigger signal from the rotor has to be calculated by a so-called multi-plexer. These units were described before as analog and partially already as digital devices to enable the use of mul-tiplace rotors without wedge windows; [14–17, 45–55]. Multiplexer technology is also common standard in the XL-I AUC although for this centrifuge platform, it is dif-ficult to get precise information on the position where to grab a TTL output signal from the multiplexer. As such signals have to be grabbed directly from the XL-I boards, it is recommended that the user supplies their own separate system for the generation of a TTL trigger pulse similar to the one used in this study.
As we aim at a complete software control of the cen-trifuge system, we applied a National Instruments PCI-6602 timer card, which can be programmed under the LABVIEW environment using the supplied virtual instru-ment drivers. The programming of the multiplexer is de-scribed under Software developments.
Principal Operation Modes
The new fiber based UV-Vis detection system was de-veloped for two principal operation modes. One is the familiar radial mode, where the radial concentration vari-ation in the sample cell is observed at various times, as already realized in all previous AUC’s (Radial mode). This mode, however is not suitable for very polydisperse sys-tems, and only very recently, it became possible to com-bine the radial profiles obtained at various speeds for a sed-imentation velocity experiment [56, 57].
For very polydisperse samples, the use of speed pro-files is essential to resolve the complete sample over the entire colloidal range [7, 58]. This is achieved by observ-ing the sample at a fixed position over time so that via use of a speed profile, all samples pass the detector at some stage and are detected (Time mode). This mode is not only interesting for colloids but also for polymers, for example for the detection of aggregates etc. In addition, it has to be stated that the time mode is a very universal mode, where several different samples can be combined in one run, simultaneously enhancing the effectivity of the AUC measurements.
For each of the detection modes, a calibration scan has to be performed to find the correct sector position as well as for the calibration of the radius. The cell position calibration is done fully automatically, as is the radial cali-bration. An option is implemented to store the calibration file and use it if the same rotor and cells are used again, which is especially useful for fast sedimenting samples. Alternatively, an option can be selected to perform the ra-dial calibration after the last scan of the experiment, which allows for instantaneous sample observation but with the disadvantage that the detector positions are not precisely known until the calibration step at the end of the experi-ment. Both modes are restricted in speed by the flash repe-tition speed of the flash lamp.
Time Mode. In this mode, the detector is set fixed at a de-fined and known position in the cell. Usually, this is the center of the cell, but if a short experimental duration is de-sired, a position near the top of the cell can be selected, where care must be taken that the detection position is far enough from the meniscus to avoid optical and physi-cal distortions of the sedimenting boundary. If the highest fractionation of the sample is desired, a position near the cell bottom can be used. As the detector is very fast, it is possible to use more than one detection positions, as the motor of the detection system can move 4 mm/s and the acquisition of a spectrum is in the ms range. With this, the movement of the sample can be followed between two or more precisely known positions, which greatly enhances the accuracy of measurements in the time mode, as already discussed for the dual beam mode [59]. Up to now, in the existing turbidity optics [8, 9], the sample is detected at a single position and the cells have to be completely filled in order to know the starting point of sedimentation, with the related inaccuracies in case of small remaining air bub-bles etc.
In the time mode, the scan time interval is set as well as the radial position for detection and the length of the entire experiment. This mode is not only useful for very poly-disperse samples but also for very fast detection, as a sed-imentation velocity experiment can be performed in just a few minutes by speeding up the centrifuge to 60 000 rpm with maximum acceleration provided that the samples sed-iment sufficiently fast. This suppresses diffusion to the maximum possible extent. Also, the time mode runs can be very useful screening experiments to find out proper centrifugation conditions for radial scans of an unknown sample. In addition it can be used as supplementary data to radial scan data in a global analysis approach [32], as the time mode can detect minor amounts of large ag-gregates, which maybe lost from detection during rotor acceleration.
Radial Mode. The radial mode is familiar to every cen-trifuge user. The described multiwavelength detector es-sentially works as the XL-A AUC with the difference of
a higher speed and a whole acquired UV-Vis spectrum for each radial point. However, if the user is just interested in 1–3 wavelengths for radial scans, for example to be com-patible with existing XL-A evaluation programs, they can be selected in analogy to the XL-A with the difference, that for the CCD based detector, it makes no difference in detection speed how many wavelengths are detected. For all other applications, the wavelength range is selected in order to save only useful data and to reduce data stor-age space required. Radial scan intervals down to 100 nm can provide a factor 100 in the amount of radial points as compared to the XL-A, which could be a very useful feature for sedimentation equilibrium analysis. Likewise the fast scanning times allow many more radial scan to be acquired per experiment than the XL-A, even with the additional multiwavelength information. However, making the radial steps too small can over-sample the data because two neighbor radial points could be not independent from each other anymore depending on the radial optical reso-lution of the system.
Software Development
The software for centrifuge control, multiplexer and data acquisition was written using the LABVIEW 7.1 (National Instruments) programming environment. The software has the capability of ultracentrifuge and step motor control via a serial port, spectrometer and flash lamp triggering via the timer card, as well as data acquisition from the spec-trometer. It is convenient to classify software options into three categories such as General Options, Cell Options and Calibration Settings.
1) General Options. Before starting an experiment, some important parameters of the experiment are adjusted. Rotor Adjustment: 4 hole or 8 hole rotor
XL Settings Adjustment: Speed, temperature and time set-ting of ultracentrifuge
Scan Mode
Time Mode Scan Radial Mode Scan Scan Options Adjustment
Acquire intensity data instead of absorbance: Default is absorbance data
Filter scan intensities below a certain level: Only in radial mode scan
Stop XL after last scan
Make radial calibration after experiment Method Scan Options Adjustment
Delayed Start: Time delay before the first scan Time between Scans: In Radial Mode only Number of Scans: In Radial Mode only Experiment Directory
2) Cell Options. For both time mode and radial mode scan, after enabling desired cells, their experimental parameters should be adjusted, which differ in the two modes
Common Options
Wavelength Selection: Up to 4 wavelengths Saving Full Spectra
Wavelength Range Time Mode Options
Radius: Position in the cell
Acquisition/Averaging time for one data point (number of lamp flashes)
Radial Mode Options
Rmin and Rmax: Minimum and maximum radial dis-tance
Radial Step: Radial step size between two detector readings
Replicates: Number of data points collected at each wavelength
Set All Settings Identical to Cell 1: Sets the parameters of cell 1 for each cell
3) Calibration Settings.
Cell Calibration: used to set the angular cell positions with respect to the triggering pulse.
Position: angle from the trigger pulse to the cell Length: size of the cell in angle units
Shifting:provides to access two different positions in the cell e.g. reference and sample sector to allow for the correction of the sample for the reference solvent Angle Calibration: the positions of the cells can be de-termined with this property
Radial Calibration: inner and outer radii for the cells are determined
Step Motor Settings: Adjustment of Port, Minimum and Maximum positions of motor
Calibrate Outer Position: Maximum outer position of the step motor determined with a sensor on arm Graph Settings: Determination of Scale Settings
When the scan starts, the user can observe the experi-ment online for each cell. Some important information is also shown such as XL Status and Cell Information. It is also possible to change some experimental parame-ters during the scan such as XL speed, temperature and the intensity limit below which filtering is done. This is an important improvement with respect to the commer-cial XL-I, which only allows for parameter changes after stopping an ongoing scan. All the options above can be saved in different files for different categories so that the user only needs to adjust necessary parts for any other experiment.
The user interface of the control system was adapted to the style of the existing XL-I centrifuge control user inter-face to maintain an easy operation by the majority of users,
already being familiar with the XL-I instrument control and data acquisition software.
Basic System Performance
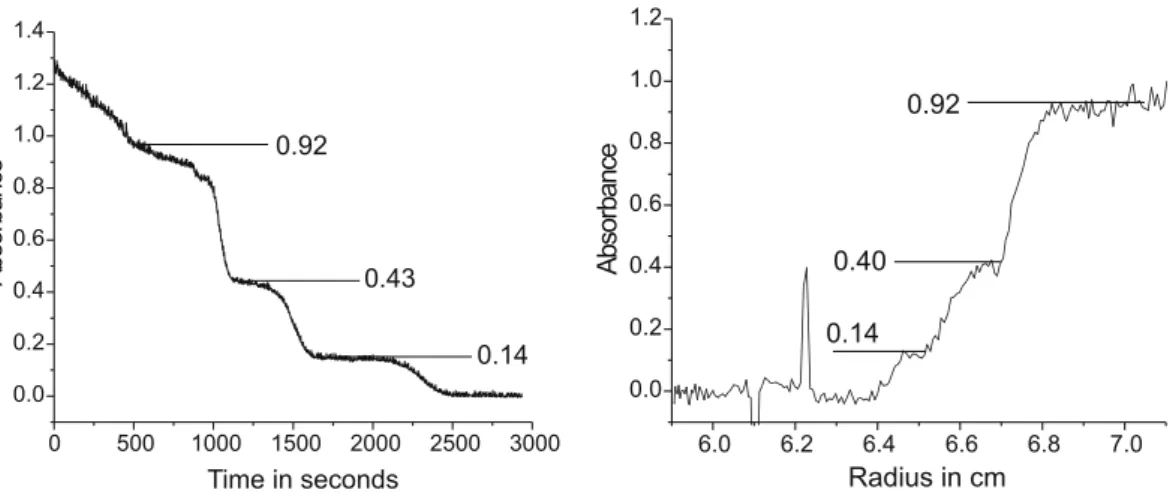
The basic check if the optical system correctly images the ultracentrifuge cell and also provides sufficient radial reso-lution can be performed by scanning a slit. We used a 200µm slit, which was placed as coating on a cell win-dow (see Fig. 6 lower image). This winwin-dow was used in an AUC cell with a 2 mm centerpiece with the slit fac-ing the centerpiece and oriented perpendicular to the radial direction. Scanning this cell in the intensity mode yields a radial scan, which should show a 200µm wide rectan-gular peak. Ideally, the transition from zero to maximum intensity should be very sharp. However, as the aperture slit for the optics is only 25µm, a better optical resolution cannot be expected. In Fig. 6, the result of this experiment is shown for the XL-A (right) and our fiber detector (Fig. 6 left). For the experiment, we chose a radial step size of 3µm, the step size for the XL-A was set to the finest pos-sible value of 10µm. It can be seen that the transition zone for 0–100% intensity is about 50µm for the fiber optics detector. Due to the limited number of data points, the tran-sition is more shallow for the XL-A optical system. This demonstrates that our basic optical system performance is at least as good as that of the XL-A, although we use a lens optics, which shows the chromatic aberration problem for white light.
Fig. 6 Resolution observed by placing a 200 micrometer slit at the
centre of the cell. The figure in the top left shows observation for the fiber optics based detector. The figure at upper right shows the observation for the commercial XL-A. Bottom: A light microscopy image of the slit. Scale bar= 500 µm
Results and Discussion
Time Mode. The first sample, which we used to test our optical system was bovine serum albumin (BSA) – a stan-dard protein sample which shows an absorbance peak at 280 nm in the UV-Vis spectrum. We set the slit position to 6.1 cm close to the meniscus in order to enable a fast meas-urement in the time mode. Absorbance was determined by recording the intensity of the sample and applying the in-tensity recorded for the reference solvent in a separate cal-ibration experiment. The experimental raw data are shown in Fig. 7. The tremendous amount of data becomes directly obvious. Also, it can be seen that the present lower wave-length limit of the fiber detector is 240 nm, which just shows the onset of the 230 nm BSA peak. This is a bad situation for investigations of proteins, where usually the 230 nm peak is the most intense one but tolerable for most other samples. If only one wavelength is picked out of the multiwavelength scans, the time dependent sedimentation can be visualized in a similar way to the traditional AUC scans and the data quality can be controlled (Fig. 8). The expected sigmoidal curve is shown and the data quality is comparable to that of the XL-A.
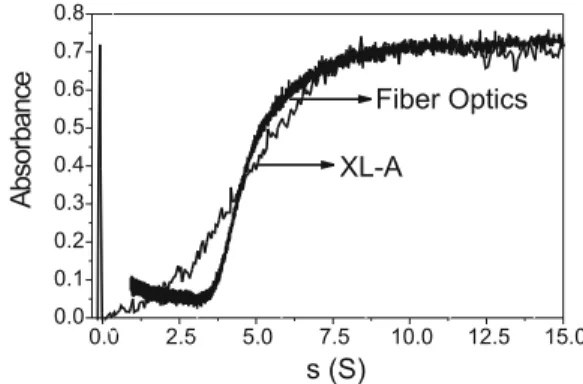
Repetition of the experiment in time mode with the fiber optics and in the radial mode in the XL-A yielded comparable results in terms of the sedimentation coeffi-cients for the identical sample run on both instruments as shown in Fig. 9.
The noise level in both scans is about the same al-though for the fiber optics, there are many more data points, which is advantageous for the subsequent evalua-tion. Another obvious difference is the broadness of the ex-perimental curve. The apparent sedimentation coefficient distribution, which is not corrected for diffusion broaden-ing is considerably sharper from the fiber optics than from
Fig. 7 Sedimentation velocity experiment for BSA, temperature: 25◦C, Rotor Speed: 50 000 rpm, Slit position: 6.1 cm, lowest de-tectable wavelength 240 nm. Spectra recording condition: 98 ms integration time and 10 averages
Fig. 8 Absorbance vs time plot for BSA 1 g/L at 280 nm. (Ex-perimental conditions; Rotor speed: 5000 rpm, Slit position: 6.1 cm. Data recorded with 98 ms integration time and 10 averages). The data were not yet corrected for reference solvent
Fig. 9 Comparison of XL-A and Fiber optics. Slit position 6.1 cm, Meniscus 5.81 cm, Fiber optics: 1 s time interval and time mode scan, XL-A: Continuous radial scan 0.05 cm, 2averages. For fiber optics: 14 100 points and for XL-A: 250 points. The data were recorded at wavelength 280 nm. Equation used to convert ‘r’ values to ‘s’: s= (1/ω2t) ln(r/r
m); variables have their usual meaning
the XL-A. This effect is attributed to the fact that the detec-tor was placed very close to the meniscus so that diffusion broadening of the boundary could not yet set in. Whereas the sedimentation coefficient distributions get sharper with time in the radial mode, as diffusion goes with the square root of time but sedimentation is directly proportional; this is not observed in the time mode as long as the detector is placed at a position, where diffusion broadening could not yet set in to a significant extent. On the other hand, the fractionation capability of the AUC is not fully exploited with that setting. A slightly tilted lower plateau is observed for the data from the fiber optics. The reason for this is not yet clear, but it has to be stressed that we do not yet use a reference solvent correction nor a correction for varia-tions in the flash lamp intensity. In addition, this tilting of the lower plateau is not regularly observed.
Another comparison between the time mode of the fiber optics detector and the radial mode in the XL-A was made for a mixture of three latex standards (150 nm, 190 nm & 240 nm). The results are shown in Fig. 10.
Fig. 10 Sedimentation velocity of a latex mixture (Polystyrene latex mixture with particle sizes 150 nm, 190 nm and 240 nm). Left: Fiber optics, time mode scan (slit position 6.1 cm, Recording conditions, wavelength: 450 nm, Integration time: 100 ms, 10 averages). Right: XL-A, radial mode scan, continuous (0.005 cm and 2 averages)
It can be seen that the 3 components are resolved in both ultracentrifuges. Also, the detected concentration of the individual species is comparable for both ultracen-trifuges. The data quality of the fiber optics detector is, however, much higher than that of the XL-A. The reason maybe the fact that the flash lamp intensity is lower in the visible range, which degrades the data quality. For the fiber optics, the UV-intensity is significantly decreased due to fiber bending (see discussion below) so that the data qual-ity is better in the visible range for the present prototype. However, for the fiber optics, a significant tilting of the up-per plateau is observed at the early times. Such tilting is always observed in case of turbid samples and could have to do with the significantly enhanced stray light for these samples. In the slit-lens assembly of the XL-A, an aper-ture is installed, which limits stray light from the sample to+/− 4◦. This aperture is not yet realized for the present fiber optics prototype. Indicative for stray light is also the fact that just the upper plateau is tilted but not the lower plateau, where all turbid latices have already sedimented.
The turbidity of colloidal dispersions is often a prob-lem for their analysis by AUC. This is caused by the fact that the scattering of particles is size dependent accord-ing to the MIE theory where a small amount of large particles scatters more light than a large amount of small particles. This in turn affects the apparent light absorp-tion and turbidity and makes the absorpabsorp-tion optics sen-sitive to size dependence analysis. Therefore, a so called coupling technique was developed for the determination of particle size distributions with a turbidity detector, where the same sample is investigated at a high concentration to detect the small particles and at a low concentration for the detection of the larger particles [60]. This obsta-cle is omitted with the new multiwavelength detector, as the short wavelengths are especially sensitive, so that small particles could be detected at short wavelengths and the larger ones at the more insensitive large wavelengths in
a single experiment. This effect is demonstrated in Fig. 11 for a binary latex mixture, which is displayed for three dif-ferent wavelengths.
The drastic effect of the wavelength dependence of the detected signals is clearly visible. When for example the wavelengths 430 & 660 nm are combined, the two differ-ent latexes are detected with a comparable sensitivity.
Another feature of the new detector is its speed. It is no problem to perform a whole sedimentation velocity ex-periment during the acceleration of the AUC to 60 000 rpm with maximum speed provided that the samples sediment fast enough. This is shown in Fig. 12 where the experi-mental raw data and the differential distribution being pro-portional to the particle size and sedimentation coefficient distribution are displayed.
In only 3 minutes, the whole sedimentation coefficient distribution is determined. The huge advantage of such ex-periments beside the speed is the fact that diffusion broad-ening is suppressed to the maximum possible extent so
Fig. 11 Latex mixture (150 & 240 nm) observed at three different wavelengths (430, 450 & 660 nm). Experimental conditions: Rotor speed: 10 000 rpm, Temperature: 25◦C, Slit position: 6.1 cm. Data collection conditions: 100 ms averaging time, 10 averages
Fig. 12 Fast sedimentation velocity Experiment with a Polystyrene Latex Mixture of sizes 190 nm, 305 nm and 605 nm in 1: 2 : 2 mixing ratio by wt.; data collected at 350 nm; Left: Experimental raw data. Right: Derivative curve was generated performing differentiation after 5 point FFT smoothing. Slit position: 6.1 cm
Fig. 13 Upper left: Raw data for a total radial Scan (Sample: 175 nm Polystyrene Latex, 10 000 rpm, 25◦C). Upper right: radial scan at a fixed wavelength. Lower left: Radial scan at a fixed wavelength (Zoomed view), lower right: Radial scan after cutting off noisy regions. Note that the radius is expressed in radius points corresponding to the steps of the detector movement and no real radial calibration was performed yet
that a diffusion correction can become obsolete for many samples. However, the evaluation of such experiments has to be improved. With this, we can adapt the experiences with the turbidity detector where similar problems were faced.
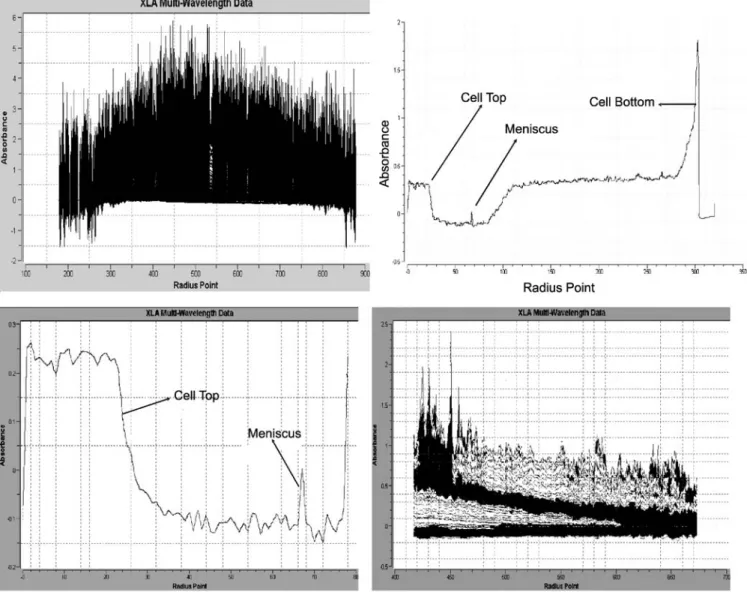
Radial Mode. The data amount of the radial mode is much higher than that of the time mode, as a whole spectrum can be saved for every radial point. A 1 cm solution column can in principle be scanned with 100 nm resolution, which corresponds to 105 data points per scan. For radial scans with the detector prototype, we first used the spectrometer software supplied with the spectrometer and visualized the data with a data viewer written by B. Demeler, UTHCSA, San Antonio. In the following we demonstrate how the useable data in a single scan can be extracted for the ex-ample of a 175 nm latex sex-ample (Fig. 13).
First of all, all experimental data are read in for a par-ticular scan. If the whole cell is scanned as in this example, the first view along the cell from top to bottom just shows noise from the cell part before the sector starts (Fig. 13 up-per left). Therefore, the plot has to be transformed from the wavelength display to a radial display at a selected wavelength (Fig. 13 upper right), which is a familiar data display for every AUC user.
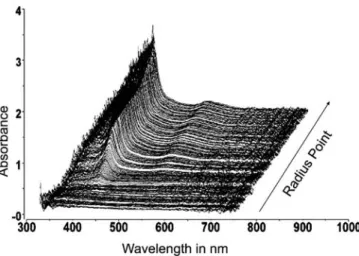
In the zoomed view (Fig. 13 lower left) the meniscus can be seen. Also top and bottom of the cell are clearly visible and define the data regions, which have to be cut off. This step is eliminated in the new data acquisition software, where the radius is calibrated before the experi-ment, so that only the useful data range is scanned. Also, noisy wavelength regions can be clipped until the final scan is obtained as shown in Fig. 13 lower right. If this scan is turned appropriately, the three dimensional nature of a scan becomes obvious (Fig. 14).
Not only the sigmoidal radial sedimentation velocity profile is shown, but also the wavelength dependence of
Fig. 14 Radial Scan for a 175 nm polystyrene latex sample (10 000 rpm, 25◦C)
Fig. 15 Radial scan for a 1.0 g/L solution of Cytochrome C (Speed 50 000 rpm)
turbidity, which can even be used to evaluate the col-loid particle size independently. It is clear that such scan contains much more information than the conventional two dimensional radial scan. Especially fitting algorithms should greatly profit from the additional wavelength di-mension. Another example for a single radial scan is pre-sented in Fig. 15 for Cytochrome C. Even although the typical 230 & 280 protein absorption peaks could not be detected without significant noise in this example, Fig. 15 already shows the information increase of a single multi-wavelength scan as compared to a radial scan at a single wavelength as performed in the commercial XL-I. The use of the introduced multiwavelength detection can easily be imagined for interacting systems with different chro-mophores.
Problems. One of the big current limitations of the de-tector is the low light intensity in the UV region, which is the most important part of the spectrum – at least for
Fig. 16 UV-Vis spectrum detected without fiber bending on an op-tical bench and with fiber bending in the AUC
many biopolymers. This is mainly caused by the necessity to bend the fibers upon installation of the detector arm in the ultracentrifuge (see also Fig. 4). Fiber bending reduces the light especially in the UV region < 250 nm. When the detector arm is mounted on an optical bench without fiber bending, there is still an intensity of more than 200 counts registered down to 225 nm, which would enable the investigation of proteins. Fiber bending, however, causes intensity loss of a factor of three around 250 nm and about a factor of two for the rest of the spectral range (Fig. 15). Therefore, the construction of the arm has to be modified to avoid fiber bending.
Conclusion and Outlook
In this work, we could show a first prototype of a fiber based multiwavelength detector for the XL preparative ul-tracentrifuge. First measurements demonstrate that the de-tector is very fast with present typical scan times of only 100 ms/spectrum and delivers a data quality comparable to that of the XL-A. Due to the speed of the detector, two experimental modes are possible – the well known radial scanning mode as well as the time mode, where the detector is set at a fixed position and the sedimenta-tion is observed with time. These modes extend the pos-sibility of AUC with absorption optics detection to very polydisperse samples. Sedimentation velocity experiments as fast as two minutes become possible now, where just the centrifuge is accelerated to 60 000 rpm and immedi-ately slowed down again. The detector design was made in a modular way so that all components can be easily ex-changed. Therefore, advantage of new developments for example in lamp or spectrometer performance can be fully taken. For example, Ocean optics has very recently re-leased the HR4000 spectrometer, which can scan as fast as 10µs. This already allows the use of a continuous lamp
with a pulsed spectrometer so that a very high light inten-sity could be realized in future designs on that basis. As commercially available compounds are applied, the price for the detector is also moderate.
One drawback of the present detector is the high light intensity loss upon fiber bending and the use of lens op-tics with the associated chromatic aberration problem. Al-though the latter appeared to be of minor importance, we will develop a mirror optical system for this detector in the future, which enables defined and equal light beams at all wavelengths. In addition, mirrors can help to eliminate the necessity for fiber bending.
Nevertheless, the present detector prototype is a cheap and modular add on, which transforms a preparative ul-tracentrifuge into an analytical machine. The now avail-able multiwavelength data add a further dimension to ul-tracentrifuge analyses allowing for future use of global multiwavelength fits, evaluation of the particle size via the wavelength dependence of turbidity, a turbidity de-tection with multiple sensitivity, rapid sedimentation vel-ocity experiments and many more. Nevertheless, the soft-ware basis for these applications still needs to be de-veloped.
Acknowledgement We thank the BASF AG, Ludwigshafen and the Max-Planck-Society for financial support of this work. We also thank Dr. Walter Mächtle, BASF, for useful discussions and Dr. Borries Demeler, UTHCSA, San Antonio for writing a data visual-ization program to display the multiwavelength data. The mechani-cal workshop of the BASF is acknowledged for the modification of the XL heatsink and for building the basic detector arm. Andreas Kretzschmar, mechanical workshop MPI-KGF, is acknowledged for multiple modifications of the detector arm. Henryk Pitas, electrical workshop MPI-KGF, is thanked for help with electrical problems. Dr. K. Tauer (MPI-KGF) is acknowledged for the latex samples and Dr. Neil Robinson (UTHCSA) for the cytochrome samples. Finally, we thank Antje Völkel for helpful assistance and Prof. Dr. Dr. h.c. Markus Antonietti for the overall support of this project.
References
1. Svedberg T, Pedersen KO(1940) The Ultracentrifuge. Clarendon Press, Oxford
2. Lloyd PH (1974) Optical methods in Ultracentrifugation, Electrophoresis, and Diffusion: with a guide to the interpretation of records. Clarendon Press, Oxford
3. Schmidt B, Riesner D (1992) A Fluorescence Detection System for the Analytical Ultracentrifuge and its Application to Proteins, Nucleic Acids, Viroids and Viruses. In: Harding SE et al. (ed) Analytical Ultracentrifugation in Biochemistry and Polymer Science. Royal Society of Chemistry, Cambridge, p 176
4. MacGregor IK, Laue TM (1999) Biophys J 76:357
5. MacGregor IK, Anderson AL, Laue TM (2004) Biophys Chem 108:165
6. Cantow HJ (1964) Makromol Chem 70:130
7. Scholtan W, Lange H (1972) Kolloid Z Z Polym 250:782
8. Müller HG (1989) Colloid Polym Sci 267:1113
9. Mächtle W (1992) Analysis of Polymer Dispersions with an Eight-Cell-AUC-Multiplexer: High Resolution Particle Size Distribution and Density Gradient Techniques. In: Harding SE et al. (ed) Analytical
Ultracentrifugation in Biochemistry and Polymer Science. Royal Society of Chemistry, Cambridge, p 147 10. Klodwig U, Mächtle W (1989)
Colloid Polym Sci 267:1117
11. Clewelow AC, Errington N, Rowe AJ (1997) Eur Biophys J 25:311 12. Holtus G, Borchard W (1989) Colloid
and Polymer Science 267:1133 13. Cölfen H, Borchard W (1994) Progr
Colloid Polym Sci 94:90
14. Kisters D, Borchard W (1999) Progr Colloid Polym Sci 113:10
15. Laue TM (1992) On-Line data aquisition and analysis from the Rayleigh interferometer. In: Harding SE et al. (ed) Analytical
Ultracentrifugation in Biochemistry and Polymer Science. Royal Society of Chemistry, Cambridge, p 63 16. Börger L, Lechner MD, Stadler M
(2004) Progr Colloid Polym Sci 127:19
17. Mächtle W (1999) Progr Colloid Polym Sci 113:1
18. Flossdorf J, Schillig H, Schindler KP (1978) Makromol Chem 179:1617 19. Giebeler R (1992) The Optima XL-A:
A New Analytical Ultracentrifuge with a Novel Precision Absorption Optical System. In: Harding SE et al. (ed) Analytical Ultracentrifugation in Biochemistry and Polymer Science. Royal Society of Chemistry, Cambridge, p 16
20. Flossdorf J (1980) Makromol Chem 181:715
21. Cölfen H, Borchard W (1994) Ultrasensitive Schlieren Optical System. In: Bonner RF et al. (ed) Progress in Biomedical Optics, Vol 2136. SPIE Bellingham, Washington, p 307
22. Schuck P (2000) Biophys J 78:1606 23. Stafford WF (1992) Anal Biochem
203:295
24. Johnson ML, Correia JJ, Yphantis DA, Halvorson (1981) Biophys J 36:575 25. McRorie DK, Voelker PJ (1993)
Self-Associating Systems in the Analytical Ultracentrifuge. Beckman Instruments California
(http://www.beckman.com/Literature/ BioResearch/362784.pdf)
26. Demeler B, van Holde KE (2004) Anal Biochem 335:279 and Ultrascan Website:
http://www.ultrascan.uthscsa.edu/ 27. Mächtle W (1991) Progr Colloid
Polym Sci 86:111
28. Voelker P (1995) Progr Colloid Polym Sci 99:162
29. Cölfen H, Pauck T, Antonietti M (1997) Progr Colloid Polym Sci 107:136
30. Schuck P (2003) Anal Biochem 320:104
31. Cölfen H, Völkel A (2003) Eur Biophys J 32:432
32. Global analysis is also possible with the SEDPHAT software by Peter Schuck. See the following Website for further details:
http://www.analyticalultracentrifu-gation.com/sedphat/sedphat.htm 33. Vistica J, Dam J, Balbo A,
Yikil-maz E, Mariuzza RA, Rouault TA, Schuck P (2004) Anal Biochem 326:234
34. Balbo A, Minor KH, Velikovsky CA, Mariuzza RA, Peterson CB, Schuck P (2005) Proc Natl Acad Sci USA 102 1:81
35. Gledhill RJ (1962) J Phys Chem 66:458
36. Bateman JB, Weneck EJ, Eshler DC (1959) J Colloid Sci 14:308
37. Heller W, Bhatnagar HL, Nakagaki M (1962) J Chem Phys 36:1163 38. Hosono M, Sugii S, Kusudo O,
Tsuji W (1973) Bull Inst Chem Res, Kyoto Univ 51:104 39. http://oceanoptics.com/technical/ engineering/USB2000%20OEM% 20Data%20Sheet.pdf 40. http://oceanoptics.com/technical/ engineering/OEM%20Data% 20Sheet%20–%20HR4000.pdf 41. www.lot-oriel.com/ccd 42. Cölfen H (1994) Bestimmung
thermodynamischer und elastischer Eigenschaften von Gelen mit Hilfe von Sedimentations-gleichgewichten
in einer Analytischen Ultrazentrifuge am Beispiel des Systems
Gelatine/Wasser. Verlag Köster, Berlin
43. Visit the following website: http://usa.hamamatsu.com/en/ products/electron-tube-division/light-sources/xenon-flash-lamps.php 44. Cölfen H, Borchard W (1994) Anal
Biochem 219:321
45. Laue TM (1981) PhD Dissertation, Univ Of Connecticut, Storrs, CT, USA
46. Rockholt DL, Royce CR, Richards (1976) Biophys Chem 5:55
47. Laue TM, Domanic RA, Yphantis DA (1983) Anal Biochem 131:220 48. Yphantis DA, Laue TM, Anderson IA
(1983) Anal Biochem 143:95 49. Mächtle W, Klodwig U (1979)
Makromol Chem 180:2507 50. Mächtle W, Klodwig U (1976)
Makromol Chem 177:1607
51. Sedlack U, Lechner MD (1995) Progr Colloid Polym Sci 99:136
52. Ortlepp B, Panke D (1991) Progr Colloid Polym Sci 86:57 53. Schindler KP (1980) Avail NTIS.
Report (Order No. PB81-167140):157 54. Flossdorf J, Schillig H, Schindler KP
(1980) J Phys E: Scientific Instruments 13:647
55. Kuhnert R, Boedel E, Stegemann H, Wastl G (1973) CZ-Chem Tech 2:441 56. Müller HG (2004) Progr Colloid
Polym Sci 127:9
57. Stafford WE, Braswell EH (2004) Biophys Chem 108:273
58. Müller HG (1989) Colloid Polym Sci 267:1113
59. Mächtle W (1999) Biophys J 76:1080 60. Mächtle W (1988) Angew Makromol